2008 United States House of Representatives elections in Ohio
| ||||||||||||||||||||||||||||
All 18 Ohio seats to the United States House of Representatives | ||||||||||||||||||||||||||||
|---|---|---|---|---|---|---|---|---|---|---|---|---|---|---|---|---|---|---|---|---|---|---|---|---|---|---|---|---|
| ||||||||||||||||||||||||||||
 | ||||||||||||||||||||||||||||
| Elections in Ohio |
|---|
 |
The 2008 congressional elections in Ohio were held on November 4, 2008 and determined who will represent the state of Ohio in the United States House of Representatives. The primary election was held on March 4, 2008.
Ohio has eighteen seats in the House, apportioned according to the 2000 United States Census. Representatives are elected for two-year terms; those elected in November 2008 served in the 111th Congress from January 4, 2009 until January 3, 2011. The election coincided with the 2008 U.S. presidential election.
Districts 1, 15 and 16 changed party (from Republican to Democratic), although CQ Politics had forecasted districts 1, 2, 14, 15, 16 and 18 to be at some risk for the incumbent party. District 15 was not decided until December 8, 2008.[1] As of 2018, this is the last time that Democrats won a majority of congressional districts from Ohio.
Overview
| United States House of Representatives elections in Ohio, 2008[2] | |||||||
|---|---|---|---|---|---|---|---|
| Party | Votes | Percentage | Seats Before | Seats After | +/– | ||
| Democratic | 2,752,111 | 51.21% | 7 | 10 | +3 | ||
| Republican | 2,491,498 | 46.36% | 11 | 8 | -3 | ||
| Libertarian | 44,902 | 0.84% | 0 | 0 | - | ||
| Green | 13,812 | 0.26% | 0 | 0 | - | ||
| Independent | 72,017 | 1.34% | 0 | 0 | - | ||
| Totals | 5,374,340 | 100% | 18 | 18 | — | ||
Match-up summary
District 1

Democratic nominee Steve Driehaus won against Republican incumbent Steve Chabot. CQ Politics rated the race as 'No Clear Favorite'. The following candidates ran in the general election:
| Candidate | Party | Notes | Votes | Percentage |
|---|---|---|---|---|
| Steve Driehaus | Democratic | 155,089 | 52.45% | |
| Steve Chabot | Republican | Incumbent | 140,469 | 47.5% |
| Rich Stevenson (WI) | Independent | 67 | .02% | |
| Eric Wilson (WI) | Independent | 84 | .03% |
- Race ranking and details from CQ Politics
- Campaign contributions from OpenSecrets.org
- Chabot (R-i) vs Driehaus (D) graph of collected poll results from Pollster.com
District 2

Republican incumbent Jean Schmidt won against Democratic nominee Victoria Wulsin and Independent candidate David Krikorian. CQ Politics rated the race as 'Leans Republican'. The following candidates ran in the general election:
| Candidate | Party | Notes | Votes | Percentage |
|---|---|---|---|---|
| Jean Schmidt | Republican | Incumbent | 148,671 | 44.83% |
| Victoria Wulsin | Democratic | 124,213 | 37.46% | |
| David Krikorian | Independent | Endorsed by the Libertarian Party of Ohio | 58,710 | 17.70%[3] |
| James Condit (WI) | Independent | 30 | .01% |
- Race ranking and details from CQ Politics
- Campaign contributions from OpenSecrets.org
- Schmidt (R-i) vs Wulsin (D) graph of collected poll results from Pollster.com
District 3

Republican incumbent Mike Turner won against Democratic nominee Jane Mitakides. CQ Politics rated the race as 'Safe Republican'. The following candidates ran in the general election:
| Candidate | Party | Notes | Votes | Percentage |
|---|---|---|---|---|
| Mike Turner | Republican | Incumbent | 200,204 | 63.32% |
| Jane Mitakides | Democratic | 115,976 | 36.68% |
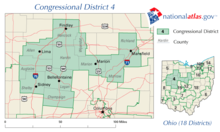
District 4

Republican incumbent Jim Jordan won against Democratic nominee Mike Carroll. CQ Politics rated the race as 'Safe Republican'. The following candidates ran in the general election:
| Candidate | Party | Notes | Votes | Percentages |
|---|---|---|---|---|
| Jim Jordan | Republican | Incumbent | 186,140 | 65.17% |
| Mike Carroll | Democratic | 99,491 | 34.83% |
District 5

Republican incumbent Bob Latta won against Democratic nominee George Mays. CQ Politics rated the race as 'Safe Republican'. The following candidates ran in the general election:
| Candidate | Party | Notes | Votes | Percentage |
|---|---|---|---|---|
| Bob Latta | Republican | Incumbent | 188,905 | 64.09% |
| George Mays | Democratic | 105,840 | 35.91% |
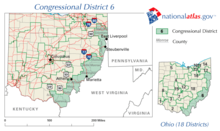
District 6

Democratic incumbent Charlie Wilson won against Republican nominee Richard Stobbs. CQ Politics rated the race as 'Safe Democrat'. The following candidates ran in the general election:
| Candidate | Party | Notes | Votes | Percentage |
|---|---|---|---|---|
| Charlie Wilson | Democratic | Incumbent | 176,330 | 62.28% |
| Richard Stobbs | Republican | 92,968 | 32.84% | |
| Dennis Spisak | Green | 13,812 | 4.88% |
District 7

Republican incumbent David Hobson did not run for reelection in 2008. Republican nominee Steve Austria won against Democratic nominee Sharen Neuhardt. CQ Politics rated the race as 'Republican Favored'. The following candidates ran in the general election:
| Candidate | Party | Notes | Votes | Percentage |
|---|---|---|---|---|
| Steve Austria | Republican | 174,915 | 58.22% | |
| Sharen Swartz Neuhardt | Democratic | 125,547 | 41.78% |
- Race ranking and details from CQ Politics
- Campaign contributions from OpenSecrets.org
- Austria (R) vs Neuhardt (D) graph of collected poll results from Pollster.com
District 8

Republican incumbent John Boehner won against Democratic nominee Nicholas Von Stein. CQ Politics rated the race as 'Safe Republican'. The following candidates ran in the general election:
| Candidate | Party | Notes | Votes | Percentage |
|---|---|---|---|---|
| John Boehner | Republican | Incumbent | 202,063 | 67.9% |
| Nicholas Von Stein | Democratic | 95,510 | 32.1% |
District 9

Democratic incumbent Marcy Kaptur won against Republican nominee Bradley S. Leavitt. CQ Politics rated the race as 'Safe Democrat'. The following candidates ran in the general election:
| Candidate | Party | Notes | Votes | Percentage |
|---|---|---|---|---|
| Marcy Kaptur | Democratic | Incumbent | 222,054 | 74.37% |
| Bradley S. Leavitt | Republican | 76,512 | 25.63% |
District 10

Democratic incumbent Dennis Kucinich won against Republican nominee Jim Trakas. CQ Politics rated the race as 'Safe Democrat'. The following candidates ran in the general election:
| Candidate | Party | Notes | Votes | Percentage |
|---|---|---|---|---|
| Dennis Kucinich | Democratic | Incumbent | 157,268 | 57.02% |
| Jim Trakas | Republican | 107,918 | 39.13% | |
| Paul Conroy | Libertarian | 10,623 | 3.85%[4] |
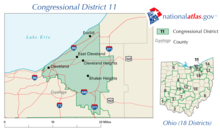
District 11

Democratic nominee Marcia Fudge won against Republican nominee Thomas Pekarek. CQ Politics rated the race as 'Safe Democrat'. The following candidates ran in the general election:
| Candidate | Party | Notes | Votes | Percentage |
|---|---|---|---|---|
| Marcia L. Fudge | Democratic | Incumbent Stephanie Tubbs Jones died. | 212,485 | 85.21% |
| Thomas Pekarek | Republican | 36,705 | 14.72% | |
| Craig Willis (WI) | Independent | 144 | .06% | |
| Eric Johnson (WI) | Independent | 23 | .01% | |
| Robert Reed (WI) | Independent | 0 | .00% |
A special election was held on November 18, 2008 to fill Jones's seat for the remainder of the 110th Congress, until January 3, 2009, which Fudge won with 100% of the vote.[5] See Ohio's 11th congressional district special election, 2008.
District 12

Republican incumbent Pat Tiberi won against Democratic nominee David Robinson. CQ Politics rated the race as 'Republican Favored'. The following candidates ran in the general election:
| Candidate | Party | Notes | Votes | Percentage |
|---|---|---|---|---|
| Pat Tiberi | Republican | Incumbent | 197,447 | 54.79% |
| David Robinson | Democratic | 152,234 | 42.24% | |
| Steve Linnabary | Libertarian | 10,707 | 2.97%[6] |
District 13

Democratic incumbent Betty Sutton won against Republican nominee David Potter. CQ Politics rated the race as 'Safe Democrat'. The following candidates ran in the general election:
| Candidate | Party | Notes | Votes | Percentage |
|---|---|---|---|---|
| Betty Sutton | Democratic | Incumbent | 189,542 | 64.55% |
| David Potter | Republican | 104,066 | 35.44% | |
| Robert Crow (WI) | Independent | 37 | .01% |
District 14

Republican incumbent Steve LaTourette won against Democratic nominee Bill O'Neill. CQ Politics rated the race as 'Republican Favored'. The following candidates ran in the general election:
| Candidate | Party | Notes | Votes | Percentage |
|---|---|---|---|---|
| Steve LaTourette | Republican | Incumbent | 188,488 | 58.32% |
| Bill O'Neill | Democratic | 125,214 | 38.74% | |
| David Macko | Libertarian | 9,511 | 2.94%[7] |
District 15

The election results were essentially tied, requiring an automatic recount. CQ Politics rated the race as 'Leans Democratic'. Republican incumbent Deborah Pryce did not run for reelection in 2008, leaving this an open seat. Kilroy defeated Stivers by 2,311 votes in a race not decided until the final ballots were counted on December 7, 2008.
| Candidate | Party | Notes | Votes | Percentage |
|---|---|---|---|---|
| Steve Stivers | Republican | 137,272 | 45.18% | |
| Mary Jo Kilroy | Democratic | (winner) | 139,584 | 45.94% |
| Mark M. Noble | Libertarian | 14,061 | 4.63% | |
| Don Elijah Eckhart | Independent | 12,915 | 4.25% | |
| Travis Casper (WI) | Independent | 6 | 0% |
- Race ranking and details from CQ Politics
- Campaign contributions from OpenSecrets.org
- Stivers (R) vs Kilroy (D) graph of collected poll results from Pollster.com
District 16

Democratic nominee John Boccieri won against Republican nominee Kirk Schuring. Republican incumbent Ralph Regula did not run for reelection. CQ Politics rated the race as 'Leans Democratic'. The following candidates ran in the general election:
| Candidate | Party | Notes | Votes | Percentage |
|---|---|---|---|---|
| John Boccieri | Democratic | 169,044 | 55.36% | |
| Kirk Schuring | Republican | 136,293 | 44.64% |
District 17

Democratic incumbent Tim Ryan won against Republican nominee Duane Grassell. CQ Politics rated the race as 'Safe Democrat'. The following candidates ran in the general election:
| Candidate | Party | Notes | Votes | Percentage |
|---|---|---|---|---|
| Tim Ryan | Democratic | Incumbent | 217,556 | 78.17% |
| Duane Grassell | Republican | 60,760 | 21.83% |
District 18

Democratic incumbent Zack Space won against Republican nominee Fred Dailey. CQ Politics rated the race as 'Democrat Favored'. The following candidates ran in the general election:
| Candidate | Party | Notes | Votes | Percentage |
|---|---|---|---|---|
| Zack Space | Democratic | Incumbent | 164,150 | 59.88% |
| Fred Dailey | Republican | 110,001 | 40.12% |
References
- ^ AP, Democrat wins central Ohio congressional race.
- ^ http://www.sos.state.oh.us/sos/elections/Research/electResultsMain/2008results.aspx
- ^ FEDERAL ELECTIONS 2008 Federal Elections Commission Washington, DC July 2009
- ^ FEDERAL ELECTIONS 2008. Federal Elections Commission. Washington, DC. July 2009
- ^ U.S. Representative - 11th Congressional District - Unexpired Term Ending 01/03/2009: November 18, 2008 Ohio Secretary of State, November 18, 2008, unofficial results
- ^ FEDERAL ELECTIONS 2008. Federal Elections Commission. Washington, DC. July 2009
- ^ FEDERAL ELECTIONS 2008. Federal Elections Commission. Washington, DC. July 2009
External links
- Elections & Ballot Issues from the Ohio Secretary of State
- U.S. Congress candidates for Ohio at Project Vote Smart
- Ohio U.S. House Races from 2008 Race Tracker
- Campaign contributions for Ohio congressional races from OpenSecrets.org
| Preceded by 2006 elections |
United States House of Representatives elections in Ohio 2008 |
Succeeded by 2010 elections |
