
Genetic history of Europe: Difference between revisions
Undid revision 384095322 by Pyrimidinetransitions (talk) the sourced words do not say Sinai is in Africa, |
→Relation between Europeans and other populations: new chart () |
||
| Line 41: | Line 41: | ||
A later study by Bauchet, which utilised ~ 10 thousand autosomal DNA SNPs arrived at similar results. Principal component analysis clearly identified four widely dispersed groupings corresponding to Africa, Europe, Central Asia and [[South Asia]]. PC1 separated Africans from the other populations, PC2 divided Asians from Europeans and Africans, whilst PC3 split Central Asians apart from South Asians.<ref>{{Harvcoltxt|Bauchet et al.|2007}}</ref> |
A later study by Bauchet, which utilised ~ 10 thousand autosomal DNA SNPs arrived at similar results. Principal component analysis clearly identified four widely dispersed groupings corresponding to Africa, Europe, Central Asia and [[South Asia]]. PC1 separated Africans from the other populations, PC2 divided Asians from Europeans and Africans, whilst PC3 split Central Asians apart from South Asians.<ref>{{Harvcoltxt|Bauchet et al.|2007}}</ref> |
||
===Autosomal genetic distances (Fst) based on SNPs (2009)=== |
|||
Genetic distance is often measured by [[Fixation index|Fixation index (Fst)]], based on genetic polymorphism data, such as [[Single-nucleotide polymorphism|single-nucleotide polymorphisms (SNPs)]] or [[microsatellites]]. It is a special case of F-statistics, the concept developed in the 1920s by Sewall Wright. Fst is simply the correlation of randomly chosen alleles within the same sub-population relative to that found in the entire population. It is often expressed as the proportion of genetic diversity due to allele frequency differences among populations. This comparison of genetic variability within and between populations is frequently used in the field of population genetics. The values range from 0 to 1. A zero value implies complete panmixis, that the two populations are interbreeding freely. A value of one would imply the two populations are completely separate. |
|||
{| class="wikitable" style="text-align:center; width:80%;" |
|||
|+ Intercontinental autosomal genetic distances based on SNPs<ref name="nelis">{{Cite journal |
|||
| doi = 10.1371/journal.pone.0005472 |
|||
| volume = 4 |
|||
| issue = 5 |
|||
| pages = e5472 |
|||
| last = Nelis |
|||
| first = Mari |
|||
| coauthors = et al |
|||
| title = Genetic Structure of Europeans: A View from the North–East |
|||
| journal = PLoS ONE |
|||
| accessdate = 2010-07-05 |
|||
| date = 2009-05-08 |
|||
| url = http://dx.doi.org/10.1371/journal.pone.0005472 |
|||
}}, [http://www.plosone.org/article/fetchSingleRepresentation.action?uri=info:doi/10.1371/journal.pone.0005472.s003 see table]</ref> |
|||
|- |
|||
! scope=col | |
|||
! scope=col | Europe (CEU) |
|||
! scope=col | Sub-Saharan Africa (Yoruba) |
|||
! scope=col | East-Asia (Chinese) |
|||
|- |
|||
! scope=row | Europe (CEU) |
|||
| |
|||
|0.1530 |
|||
|0.1100 |
|||
|- |
|||
! scope=row | Sub-Saharan Africa (Yoruba) |
|||
|0.1530 |
|||
| |
|||
|0.1900 |
|||
|- |
|||
! scope=row |East-Asia (Chinese) |
|||
|0.1100 |
|||
|0.1900 |
|||
| |
|||
|} |
|||
{| class="wikitable" style="text-align:center; width:80%;" |
|||
|+ Intra-European/mediterranean autosomal genetic distances based on SNPs<ref name="nelis"/><ref>{{Cite journal |
|||
| doi = 10.2119/molmed.2009.00094 |
|||
| issn = 1076-1551 |
|||
| volume = 15 |
|||
| issue = 11-12 |
|||
| pages = 371–383 |
|||
| last = Tian |
|||
| first = Chao |
|||
| coauthors = et al. |
|||
| title = European Population Genetic Substructure: Further Definition of Ancestry Informative Markers for Distinguishing among Diverse European Ethnic Groups |
|||
| date = 2009-11 |
|||
| url = http://www.ncbi.nlm.nih.gov/pmc/articles/PMC2730349/ |
|||
}}, [http://www.ncbi.nlm.nih.gov/pmc/articles/PMC2730349/table/t1-09_94_tian/ see table]</ref> |
|||
|- |
|||
! scope=col | |
|||
! scope=col | Italians |
|||
! scope=col | Palestinians |
|||
! scope=col | Swedish |
|||
! scope=col | Finns |
|||
! scope=col | Spanish |
|||
! scope=col | Germans |
|||
! scope=col | Russians |
|||
! scope=col | French |
|||
! scope=col | Greeks |
|||
|- |
|||
! scope=row | Italians |
|||
| |
|||
|0.0064 |
|||
|0.0064-0.0090 |
|||
|0.0130-0.0230 |
|||
|0.0010-0.0050 |
|||
|0.0029-0.0080 |
|||
|0.0088-0.0120 |
|||
|0.0030-0.0050 |
|||
|0.0000 |
|||
|- |
|||
! scope=row | Palestinians |
|||
|0.0064 |
|||
| |
|||
|0.0191 |
|||
| |
|||
|0.0101 |
|||
|0.0136 |
|||
|0.0202 |
|||
| |
|||
|0.0057 |
|||
|- |
|||
! scope=row |Swedish |
|||
|0.0064-0.0090 |
|||
|0.0191 |
|||
| |
|||
|0.0050-0.0110 |
|||
|0.0040-0055 |
|||
|0.0007-0.0010 |
|||
|0.0030-0.0036 |
|||
|0.0020 |
|||
|0.0084 |
|||
|- |
|||
! scope=row |Finns |
|||
|0.0130-0.0230 |
|||
| |
|||
|0.0050-0.0110 |
|||
| |
|||
|0.0110-0.0170 |
|||
|0.0060-0.0130 |
|||
|0.0060-0.0120 |
|||
|0.0080-0.0150 |
|||
| |
|||
|- |
|||
! scope=row |Spanish |
|||
|0.0010-0.0050 |
|||
|0.0101 |
|||
|0.0040-0055 |
|||
|0.0110-0.0170 |
|||
| |
|||
|0.0015-0.0030 |
|||
|0.0070-0.0079 |
|||
|0.0010 |
|||
|0.0035 |
|||
|- |
|||
! scope=row |Germans |
|||
|0.0029-0.0080 |
|||
|0.0136 |
|||
|0.0007-0.0010 |
|||
|0.0060-0.0130 |
|||
|0.0015-0.0030 |
|||
| |
|||
|0.0030-0.0037 |
|||
|0.0010 |
|||
|0.0039 |
|||
|- |
|||
! scope=row |Russians |
|||
|0.0088-0.0120 |
|||
|0.0202 |
|||
|0.0030-0.0036 |
|||
|0.0060-0.0120 |
|||
|0.0070-0.0079 |
|||
|0.0030-0.0037 |
|||
| |
|||
|0.0050 |
|||
|0.0108 |
|||
|- |
|||
! scope=row |French |
|||
|0.0030-0.0050 |
|||
| |
|||
|0.0020 |
|||
|0.0080-0.0150 |
|||
|0.0010 |
|||
|0.0010 |
|||
|0.0050 |
|||
| |
|||
| |
|||
|- |
|||
! scope=row |Greeks |
|||
|0.0000 |
|||
|0.0057 |
|||
|0.0084 |
|||
| |
|||
|0.0035 |
|||
|0.0039 |
|||
|0.0108 |
|||
| |
|||
| |
|||
|- |
|||
|} |
|||
== European population sub-structure == |
== European population sub-structure == |
||
Revision as of 10:56, 11 September 2010
This article or section appears to contradict itself. (February 2010) |
This article needs to be updated. (November 2009) |
The genetic history of Europe can be inferred from the patterns of genetic diversity across continents and time. The primary data to develop historical scenarios coming from sequences of mitochondrial, Y-chromosome and autosomal DNA from modern populations and if available from ancient DNA. European populations have a complicated demographic and genetic history, including many successive periods of population growth.
.jpg)
Genetic studies
One of the first scholars to perform genetic studies was Luigi Luca Cavalli-Sforza. He used classical genetic markers to analyse DNA by proxy. This method studies differences in the frequencies of particular allelic traits, namely polymorphisms from proteins found within human blood (such as the ABO blood groups, Rhesus blood antigens, HLA loci, immunoglobulins, G-6-P-D isoenzymes, amongst others). Subsequently his team calculated genetic distance between populations, based on the principle that two populations that share similar frequencies of a trait are more closely related than populations that have more divergent frequencies of the trait. From this, he constructed phylogenetic trees which showed genetic distances diagrammatically. His team also performed principal component analyses, which is good at analysing multivariate data with minimal loss of information. The information that is lost can be partly restored by generating a second principal component, and so on.[1] In turn, the information from each individual principal component (PC) can be presented graphically in synthetic maps. These maps show peaks and troughs, which represent populations whose gene frequencies take extreme values compared to others in the studied area.[2]
Peaks and troughs usually, but not necessarily, connected by smooth gradients, called clines. Genetic clines can be generated in several ways: including adaptation to environment (natural selection), continuous gene flow between two initially different populations, or a demographic expansion into a scarcely populated environment with little initial admixture with pre-existing populations.[3] Cavalli-Sforza connected these gradients with postulated pre-historic population movements based on known archaeological and linguistic theories. However, given that the time depths of such patterns are not known, “associating them with particular demographic events is usually speculative”.[4]
Studies using direct DNA analysis are now abundant, and may utilize mitochondrial DNA (mtDNA), the non-recombining portion of the Y chromosome (NRY) or autosomal DNA. MtDNA and NRY DNA share some similar features which have made them particularly useful in genetic anthropology. These properties include the direct, unaltered inheritance of mtDNA and NRY DNA from mother to offspring, and father to son, respectively, without the 'scrambling' effects of genetic recombination. We also presume that these genetic loci are not affected by natural selection, and that the major process responsible for changes in base pairs has been mutation (which can be calculated).[5]
The smaller effective population size of the NRY and mtDNA enhances the consequences of drift and founder effect relative to the autosomes, making NRY and mtDNA variation a potentially sensitive index of population composition.[4][6][7] However, these biologically plausible assumptions are nevertheless not concrete. For example, Rosser suggests that climatic conditions may affect the fertility of certain lineages.[4]
Even more problematic, however, is the underlying mutation rate used by the geneticists. They often use different mutation rates, and therefore studies frequently arrive at vastly different conclusions.[4] Moroever, NRY and mtDNA may be so susceptible to drift that some ancient patterns may have become obscured over time. Another implicit assumption is that population genealogies are approximated by allele genealogies. Barbujani points out that this only holds if population groups develop from a genetically monomorphic set of founders. However, Barbujani argues that there is no reason to believe that Europe was colonized by monomorphic populations. This would result in an overestimation of haplogroup age, thus falsely extending the demographic history of Europe into the Late Paleolithic rather than the Neolithic era.[8] (See also Genetic drift, Founder effect, Population bottleneck.) Greater certainty about chronology may be obtained from studies of ancient DNA (see below), but so far these have been comparatively few.
Whereas Y-DNA and mtDNA haplogroups represent but a small component of a person’s DNA pool, autosomal DNA has the advantage of containing hundreds and thousands of examinable genetic loci, thus giving a more complete picture of genetic composition. However, descent relationships can only to be determined on a statistical basis because autosomal DNA undergoes recombination. A single chromosome can record multiple histories; a separate history for each gene. Autosomal studies are much more reliable for showing the relationships between existing populations but do not offer the possibilities for unraveling their histories in the same way as mtDNA and NRY DNA studies promise, despite their many complications.
Genetic studies operate on numerous assumptions and suffer from usual methodological limitations such as selection bias and confounding. Furthermore, no matter how accurate the methodology, conclusions derived from such studies are ultimately compiled on the basis of how the author envisages their data fits with established archaeological or linguistic theories.
Relation between Europeans and other populations
| Africa | Oceania | East Asia | Europe | |
|---|---|---|---|---|
| Oceania | 24.7 | |||
| East Asia | 20.6 | 10 | ||
| Europe | 16.6 | 13.5 | 9.7 | |
| America | 22.6 | 14.6 | 8.9 | 9.5 |
According to Cavalli-Sforza's work, all non-African populations are more closely related to each other than to Africans; supporting the hypothesis that all non-Africans descend from a single old-African population. The genetic distance from Africa to Europe (16.6) was found to be shorter than the genetic distance from Africa to East Asia (20.6), and much shorter than that from Africa to Australia (24.7). He explains:
...both Africans and Asians contributed to the settlement of Europe, which began about 40,000 years ago. It seems very reasonable to assume that both continents nearest to Europe contributed to its settlement, even if perhaps at different times and maybe repeatedly. It is reassuring that the analysis of other markers also consistently gives the same results in this case. Moreover, a specific evolutionary model tested, i.e., that Europe is formed by contributions from Asia and Africa, fits the distance matrix perfectly (6). In this simplified model, the migrations postulated to have populated Europe are estimated to have occurred at an early date (30,000 years ago), but it is impossible to distinguish, on the basis of these data, this model from that of several migrations at different times. The overall contributions from Asia and Africa were estimated to be around two-thirds and one-third, respectively".
This particular model used an Out of Africa migration 100,000 years ago which separated Africans from non-Africans followed by a single admixture event 30,000 years ago leading to the formulation of the European population. The admixture event consisted of a source population that was 35% African and 65% East Asian. However the study notes that a more realistic scenario would include several admixture events occurring over a sustained period. In particular they cite the spread of farming from a source population in West Asia 5000–9000 years ago may have played a role in the genetic relatedness of Africans and Europeans since West Asia is sandwiched in between Africa and Central Asia. The model assumed an out of Africa migration 100kya and a single admixture event 30kya. However, most contemporary studies have more recent dates that place the out of Africa migration 50-70kya. The study also involved a direct comparison between Sub-Saharan Africans (Central Africans and Senegalese) and Europeans. North Africans population were omitted from the study as they are known to have both Eurasian and Sub-Saharan admixture. These considerations might help explain the apparent short genetic distance between Europeans and Africans[9][10][11]
A later study by Bauchet, which utilised ~ 10 thousand autosomal DNA SNPs arrived at similar results. Principal component analysis clearly identified four widely dispersed groupings corresponding to Africa, Europe, Central Asia and South Asia. PC1 separated Africans from the other populations, PC2 divided Asians from Europeans and Africans, whilst PC3 split Central Asians apart from South Asians.[12]
Autosomal genetic distances (Fst) based on SNPs (2009)
Genetic distance is often measured by Fixation index (Fst), based on genetic polymorphism data, such as single-nucleotide polymorphisms (SNPs) or microsatellites. It is a special case of F-statistics, the concept developed in the 1920s by Sewall Wright. Fst is simply the correlation of randomly chosen alleles within the same sub-population relative to that found in the entire population. It is often expressed as the proportion of genetic diversity due to allele frequency differences among populations. This comparison of genetic variability within and between populations is frequently used in the field of population genetics. The values range from 0 to 1. A zero value implies complete panmixis, that the two populations are interbreeding freely. A value of one would imply the two populations are completely separate.
| Europe (CEU) | Sub-Saharan Africa (Yoruba) | East-Asia (Chinese) | |
|---|---|---|---|
| Europe (CEU) | 0.1530 | 0.1100 | |
| Sub-Saharan Africa (Yoruba) | 0.1530 | 0.1900 | |
| East-Asia (Chinese) | 0.1100 | 0.1900 |
| Italians | Palestinians | Swedish | Finns | Spanish | Germans | Russians | French | Greeks | |
|---|---|---|---|---|---|---|---|---|---|
| Italians | 0.0064 | 0.0064-0.0090 | 0.0130-0.0230 | 0.0010-0.0050 | 0.0029-0.0080 | 0.0088-0.0120 | 0.0030-0.0050 | 0.0000 | |
| Palestinians | 0.0064 | 0.0191 | 0.0101 | 0.0136 | 0.0202 | 0.0057 | |||
| Swedish | 0.0064-0.0090 | 0.0191 | 0.0050-0.0110 | 0.0040-0055 | 0.0007-0.0010 | 0.0030-0.0036 | 0.0020 | 0.0084 | |
| Finns | 0.0130-0.0230 | 0.0050-0.0110 | 0.0110-0.0170 | 0.0060-0.0130 | 0.0060-0.0120 | 0.0080-0.0150 | |||
| Spanish | 0.0010-0.0050 | 0.0101 | 0.0040-0055 | 0.0110-0.0170 | 0.0015-0.0030 | 0.0070-0.0079 | 0.0010 | 0.0035 | |
| Germans | 0.0029-0.0080 | 0.0136 | 0.0007-0.0010 | 0.0060-0.0130 | 0.0015-0.0030 | 0.0030-0.0037 | 0.0010 | 0.0039 | |
| Russians | 0.0088-0.0120 | 0.0202 | 0.0030-0.0036 | 0.0060-0.0120 | 0.0070-0.0079 | 0.0030-0.0037 | 0.0050 | 0.0108 | |
| French | 0.0030-0.0050 | 0.0020 | 0.0080-0.0150 | 0.0010 | 0.0010 | 0.0050 | |||
| Greeks | 0.0000 | 0.0057 | 0.0084 | 0.0035 | 0.0039 | 0.0108 |
European population sub-structure
Geneticists agree that Europe is the most genetically homogeneous of all the continents.[15][16] However, some patterns are discernable. Cavalli-Sforza’s principal component analyses revealed five major clinal patterns through out Europe, and similar patterns have continued to be found in more recent studies.[17]
- A cline of genes with highest frequencies in the Middle East, spreading to lowest levels northwest. Cavalli-Sforza originally described this as faithfully reflecting the spread of agriculture in Neolithic times. This has been the general tendency in interpretation of all genes with this pattern.
- A cline of genes with highest frequencies amongst Finnish and Saami in the extreme north east, and spreading to lowest frequencies in the south west.
- A cline of genes with highest frequencies in the area of the lower Don and Volga rivers in southern Russia, and spreading to lowest frequencies in Iberia, Southern Italy, Greece and the areas inhabited by Saami speakers in the extreme north of Scandinavia. Cavalli-Sforza associated this with the spread of Indo-European languages, which he links in turn to a "secondary expansion" after the spread of agriculture, associated with animal grazing.
- A cline of genes with highest frequencies in the Balkans and Southern Italy, spreading to lowest levels in Britain and the Basque country. Cavalli-Sforza associates this with "the Greek expansion, which reached its peak in historical times around 1000 and 500 BC but which certainly began earlier"
- A cline of genes with highest frequencies in the Basque country, and lower levels beyond the area of Iberia and Southern France. In perhaps the most well-known conclusion from Cavalli-Sforza this weakest of the 5 patterns was described as isolated remnants of the pre-Neolithic population of Europe, "who at least partially withstood the expansion of the cultivators". It corresponds roughly to the geographical spread of rhesus negative blood types. In particular, the conclusion that the Basques are a genetic isolate has become widely discussed, but also a controversial conclusion.
He also created a phylogenetic tree to analyse the internal relationships amongst Europeans. He found four major 'outliers'- Basques, Lapps, Finns and Icelanders; a result he attributed to their relative isolation (note: with the exception of the Icelanders, the rest of the groups speak non-Indo-European languages). Greeks and Yugoslavs represented a second group of less extreme outliers. The remaining populations clustered into several groups : "Celtic", "Germanic", "south-western Europeans", "Scandinavians" and "eastern Europeans".[18]
Genetic studies after Cavalli-Sforza
This section needs to be updated. (November 2009) |
New technologies have allowed for DNA haplotypes to be studied directly with increasing speed and accuracy, giving more refined data than was available in the original studies of Cavalli-Sforza.
Human Y-chromosome DNA haplogroups

There are three big Y-chromosome DNA haplogroups which largely account for most of Europe's patrilineal descent.[19]
- Haplogroup R1b is common all over Europe but especially common in Western Europe.[20][21][22] Nearly all of this R1b in Europe is in the form of the R1b1b2 (R-M269) sub-clade, specifically within the R-L23 sub-sub-clade whereas R1b found in Central Asia, western Asia and Africa tends to be in other clades. It has also been pointed out that outlier types are present in Europe and are particularly notable in some areas such as Sardinia.[23] Haplogroup R1b frequencies vary from highs in western Europe in a steadily decreasing cline with growing distance from the Atlantic: 80-90% (Welsh, Basques, Irish, Scots, north-western Spanish, Portuguese and western French); around 40-60% in most other parts of western Europe. It drops outside this area and is around 20% or less in areas such as southern Italy, Sweden, Poland, Turkey, the Balkans and Cyprus. R1b remains the most common clade as one moves east to Germany, while further east in Poland, R1a is more common (see below).[24] In southeastern Europe, R1b drops behind R1a in the area in and around Hungary and Serbia but is more common both to the south and north of this region.[25] R1b in Western Europe is dominated by at least two sub-clades, R-U106, which is distributed from the east side of the Rhine into northern and central Europe (with a presence in England) and R-P312, which is most common west of the Rhine, including the British Isles.[21][22]
- Haplogroup I is found in the form of various sub-clades throughout Europe and is found at highest frequencies in Bosnia and Herzegovina, Croatia, Sweden, Norway, Sardinia, parts of Germany and other countries in the Balkan Peninsula and Scandinavia. This clade is only found in Europe and may have been there since before the LGM.[26]
- Haplogroup R1a, almost entirely in the R1a1a sub-clade, is prevalent in much of central and eastern Europe (and also as far away as central Asia and the Indian subcontinent). For example there is a sharp increase in R1a1 and decrease in R1b1b2 as one goes east from Germany to Poland.[24] It also has a substantial presence in Scandinavia (particularly Norway),[27][28] and some small pockets in Southern Europe, for example the Pas Valley[29] areas of Venice, and Calabria in Italy.[30] In the Baltic countries R1a frequencies decrease from Lithuania (45%) to Estonia (around 30%).[31]
Putting aside small enclaves there are also several haplogroups apart from the above three, which are most common in certain areas of Europe.
- Haplogroup N is common only in the northeast of Europe and in the form of its N1c1 sub-clade reaches frequencies of approximately 60% among Finns and approximately 40% among Lithuanians. This clade is also found far into the east in Siberia, Japan and China.
- Haplogroup E1b1b1, mainly in the form of its E1b1b1a2 (E-V13) sub-clade reaches frequencies above 40% around the area of Kosovo.[32] This clade is thought to have arrived in Europe from western Asia either in the later Mesolithic,[33] or the Neolithic.[34]
- Haplogroup J, in various sub-clades is found in levels of around 15-30% in parts of the Balkans and Italy.[35]
X chromosome
In recent times it has been proposed that X chromosome haplotypes are particularly useful for locating some of the oldest surviving lineages in humanity.[36]
Human mitochondrial DNA haplogroups
There have been a number of studies about the mitochondrial DNA haplogroups (mtDNA) in Europe. In contrast to Y DNA haplogroups, mtDNA haplogroups did not show as much geographical patterning, but were more evenly ubiquitous. Apart from the outlying Saami, all Europeans are characterized by the predominance of haplogroups H, U and T. The lack of observable geographic structuring of mtDNA may be due to socio-cultural factors, namely the phenomena of polygyny and patrilocality.[4] According to the University of Oulu Library in Finland:
Classical polymorphic markers (i.e. blood groups, protein electromorphs and HLA antigenes) have suggested that Europe is a genetically homogeneous continent with a few outliers such as the Saami, Sardinians, Icelanders and Basques (Cavalli-Sforza et al. 1993, Piazza 1993). The analysis of mtDNA sequences has also shown a high degree of homogeneity among European populations, and the genetic distances have been found to be much smaller than between populations on other continents, especially Africa (Comas et al. 1997).
The mtDNA haplogroups[37] of Europeans are surveyed by using a combination of data from RFLP analysis of the coding region and sequencing of the hypervariable segment I. About 99% of European mtDNAs fall into one of ten haplogroups: H, I, J, K, M, T, U, V, W or X (Torroni et al. 1996a). Each of these is defined by certain relatively ancient and stable polymorphic sites located in the coding region (Torroni et al. 1996a)... Haplogroup H, which is defined by the absence of a AluI site at bp 7025, is the most prevalent, comprising half of all Europeans (Torroni et al. 1996a, Richards et al. 1998)... Six of the European haplogroups (H, I, J, K, T and W) are essentially confined to European populations (Torroni et al. 1994, 1996a), and probably originated after the ancestral Caucasoids became genetically separated from the ancestors of the modern Africans and Asians.[38]
Ancient DNA
The genetic history of Europe has mostly been reconstructed from the modern populations of Europe, assuming genetic continuity. This is because it is far easier to retrieve DNA from living subjects than ancient human remains. However, a small number of ancient mtDNA and Y-DNA analyses are available from both the historical and prehistoric periods.
Autosomal DNA
A later study by Seldin (2006) used over five thousand autosomal SNPs. It showed “a consistent and reproducible distinction between ‘northern’ and ‘southern’ European population groups”. Most individual participants with southern European ancestry (Italians, Greeks, Portuguese, Spaniards), and Ashkenazi Jews have >85% membership in the ‘southern’ population; and most northern, western, central, and eastern Europeans (Swedes, English, Irish, Germans, and Ukrainians) have >90% in the ‘northern’ population group. However, many of the participants in this study were actually American citizens who self-identified with different European ethnicities based on familial pedigree.[39]
A similar study in 2007 using samples exclusively from Europe found that the most important genetic differentiation in Europe occurs on a line from the north to the south-east (northern Europe to the Balkans), with another east-west axis of differentiation across Europe. Its findings were consistent with earlier results based on mtDNA and Y-chromosonal DNA that support the theory that modern Iberians (Spanish and Portuguese) hold the most ancient European genetic ancestry, as well as separating Basques and Sami from other European populations. It suggested that the English and Irish cluster with other Northern and Eastern Europeans such as Germans and Poles, while some Basque and Italian individuals also clustered with Northern Europeans. Despite these stratifications, it noted the unusually high degree of European homogeneity: "there is low apparent diversity in Europe with the entire continent-wide samples only marginally more dispersed than single population samples elsewhere in the world."[40]
In 2008, two international research teams published analyses of large-scale genotyping of large samples of Europeans, utilising using over 300, 000 autosomal SNPs. With the exception of usual isolates such as Basques, Finns and Sardinians, the European population lacked sharp discontinuities (clustering) as previous studies have found (see Seldin et al. 2006 and Bauchett et al. 2007), although there was a discernible south to north gradient. Overall, they found only a low level of genetic differentiation between subpopulations, and differences which did exist were characterized by a strong continent-wide correlation between geographic and genetic distance. In addition, they found that diversity was greatest in southern Europe due a larger effective population size and/or population expansion from southern to northern Europe.[41] The researchers take this observation to imply that genetically, Europeans are not distributed into discrete populations.[42][43]
A study in May 2009 [44] of 19 populations from Europe using 270,000 SNPs highlighted the genetic diversity or European populations corresponding to the northwest to southeast gradient and distinguished "four several distinct regions" within Europe:
- Finland, showing the greatest distance to the rest of Europeans.
- the Baltic region (Estonia, Latvia and Lithuania), western Russia and eastern Poland.
- Central and Western Europe.
- Italy, "with the southern Italians being more distant".
In this study, barrier analysis revealed "genetic barriers" between Finland, Italy and other countries and interestingly, barriers could also be demonstrated within Finland (between Helsinki and Kuusamo) and Italy (between northern and southern part, Fst= 0.0050). Fst (Fixation index) was found to correlate considerably with geographic distances ranging from ≤0.0010 for neighbouring populations to 0.0200-0.0230 for Southern Italy and Finland. For comparisons, pair-wise Fst of non-European samples were as follows: Europeans – Africans (Yoruba) 0.1530; Europeans – Chinese 0.1100; Africans (Yoruba) – Chinese 0.1900.[45]
A study by Chao Tian in August 2009 extended the analysis of European population genetic structure to include additional southern European groups and Arab populations (Palestinians, Druzes...) from the Near-East. This study determined autosomal Fst between 18 population groups and concluded that, in general, genetic distances corresponded to geographical relationships with smaller values between population groups with origins in neighboring countries/regions (for example, Greeks/Tuscans: Fst = 0.0010, Greeks/Palestinians: Fst = 0.0057) compared with those from very different regions in Europe (for example Greeks/Swedish: Fst = 0.0087, Greeks/Russians: Fst = 0.0108).[46][47]
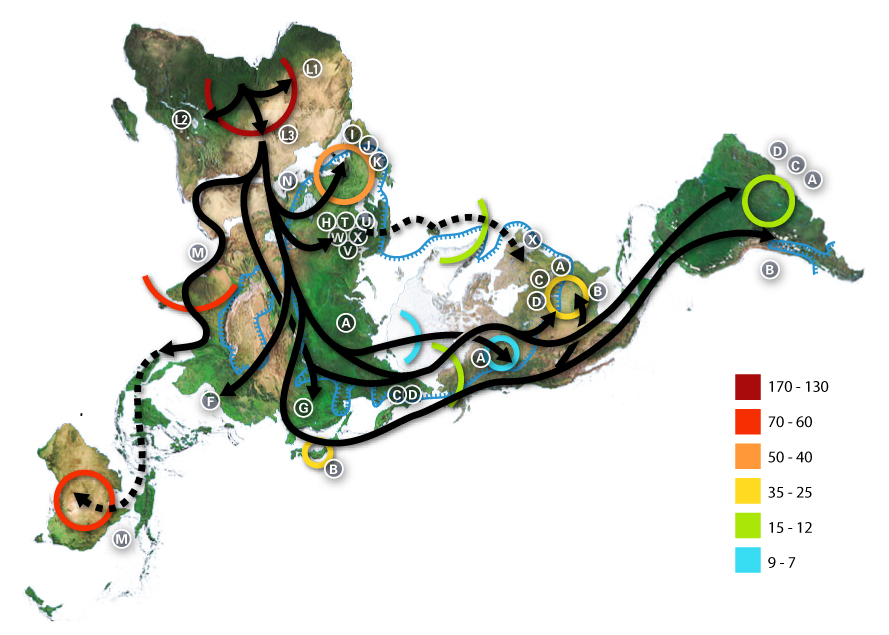
Apparent migrations into Europe
The prehistory of the European peoples can be traced by the examination of archaeological sites, linguistic studies and by the examination of the DNA of the people who live in Europe or from ancient DNA. The research continues and so theories rise and fall. Although it is possible to track migrations of people across Europe using founder analysis of DNA, most information on these movements comes from archeology. It is important to note that the colonization of Europe did not occur in discrete migrations, as might appear to be suggested. Rather, the settlement process was complex and "likely to have occurred in multiple (sic) waves from the east and to have been subsequently obscured by millennia of recurrent gene flow".[48]
Palaeolithic Era

Homo neanderthalensis inhabited much of Europe and western Asia from as far back as 130,000 years ago. They existed in Europe as late as 30,000 years ago. They were replaced by anatomically modern humans (A.M.H.), Cro-Magnoid homo sapiens, who began to appear in Europe c. 40,000 years ago. Given that the two hominid species likely co-existed in Europe, anthropologists wondered whether the two interacted. Before the advent of genetic studies, some anthropologists believed they had discovered skeletons representing Neanderthal/modern human 'hybrids'. These results were deemed 'ambiguous'. Archaeological evidence points to an abrupt change from Neanderthal artefacts to those related to A.M.H during the Upper Palaeolithic. Y chromosomal and mtDNA data suggest that modern European DNA derives from Africa, which diverged less than 100,000 years ago, whereas the last common ancestor between the two species lived between 500,000 to 600,000 years ago. While it is conceivable that the autosomes of modern Europeans may retain Neanderthal sequences, Neanderthals were replaced by modern humans. Technological, economic and intellectual advantages not only allowed AMH to better adapt to the Upper Palaeolithic environment of Europe but probably also resulted in cultural and therefore biological, barriers between the two species. Neanderhthals were thus probably outcompeted by modern humans, with little or no gene exchange.[49]
There has been speculation about the inheritance of specific genes from Neanderthals. For example one MAPT locus 17q21.3 which is split into deep genetic lineages H1 and H2. Since the H2 lineage seems restricted to European populations, several authors have suggested inheritance from Neanderthals.[50][51][52][53][54] However the preliminary results from the sequencing of the full Neanderthal Genome have shown no evidence of interbreeding between Neanderthals and modern humans.[55][56]
The latest findings by Paabo, Richard E. Green of the University of California, Santa Cruz and David Reich of Harvard Medical School, comparing the genetic material from the bones of three Neanderthals with that from five modern humans, show a relationship between Neanderthals and modern people outside Africa. This suggests that interbreeding occurred in the Middle East.
That modern humans began to colonize Europe during the Upper Paleolithic about 40,000 years ago is evidenced by the spread of the Aurignacian culture.[57] From a Y-chromosome perspective, Semino proposed that the large haplogroup R1 is an ancient Eurasiatic marker brought in by Homo sapiens who diffused west into Europe ~ 40 ky ago.[58][59] Haplogroup I might represent another putative Palaeolithic marker whose age has been estimated to ~ 22 kYa. Whilst it is 'unique' to Europe, it probably arose in descendants of men arriving from the Middle East c. 20 - 25 kYa, arising from parent haplogroup IJ. At this time, another Upper Palaeolithic culture appears, the Gravettian culture.[60] Thus the genetic data suggests that, from a male perspective, modern humans might have taken two colonising routes, one from the middle east via the Balkans and another from Central Asia to the north of the Black Sea.
Martin Richards et al. found that 15 - 40% of extant mtDNA lineages trace back to the Palaeolithic migrations (depending on whether one allows for multiple founder events).[6] MtDNA haplogroup U5, dated to be ~ 40 to 50 kYa, arrived during the first early upper Palaeolithic colonisation. Individually, it accounts for 5-15 % of total mtDNA lineages. Middle U.P. movements are marked by the haplogroups HV, I and U4. HV split into Pre-V (around 26,000 years old) and the larger branch H, both of which spread over Europe, possibly via Gravettian contacts.[60][61] Haplogroup H accounts for about half the gene lines in Europe, with many subgroups. The above mtDNA lineages or their precursors, are most likely to have arrived into Europe via the Middle East. This contrasts with Y DNA evidence, whereby some 50%+ of male lineages are characterized by the R1 superfamily, which is of possible central Asian origin. Semino postulates that these differences "may be due in part to the apparent more recent molecular age of Y chromosomes relative to other loci, suggesting more rapid replacement of previous Y chromosomes. Gender-based differential migratory demographic behaviors will also influence the observed patterns of mtDNA and Y variation".
Last Glacial Maximum: refugia and re-colonization
About 25,000 years ago the most recent very cold period (the Last Glacial Maximum, LGM) began, rendering much of Europe uninhabitable. According to the classical model much of northern and central Europe was vacated and people took refuge in climactic sanctuaries (or refugia) as follows:
- Northern Iberia and Southwest France, together making up the "Franco-Cantabrian" refugium.
- The Balkans.
- Ukraine and more generally the northern coast of the Black Sea.[60]
- Italy[62]
This event decreased the overall genetic diversity in Europe, a "result of drift, consistent with an inferred population bottleneck during the Last Glacial Maximum".[63] As the glaciers receded from about 16,000-13,000 years ago, Europe began to be slowly repopulated by people from refugia, leaving genetic signatures.[64]
Some Y haplogroup I clades appear to have diverged from their parental haplogroups sometime during or shortly after the LGM.[26] Haplogroup I2 is prevalent in the western Balkans, as well as the rest of southeastern and central-eastern Europe in more moderate frequencies. Its frequency drops rapidly in central Europe, suggesting that the survivors bearing I2 lineages expanded predominantly through south-eastern and central-eastern Europe.[65]
Cinnioglu sees evidence for the existence of an Anatolian refuge, which also harboured Hg R1b1b2.[66] Today, R1b dominates the y chromosome landscape of western Europe and the British Isles, suggesting that there could have been large population composition changes based on migrations after the LGM.
Semino, Passarino and Pericic place the origins of haplogroup R1a within the Ukrainian ice-age refuge. Its current distribution in eastern Europe and parts of Scandinavia are in part reflective of a re-peopling of Europe from the southern Russian/Ukrainian steppes during the Late Glacial Maximum.[67][68][69]
From an mtDNA perspective, Richards et al. found that the majority of mtDNA diversity in Europe is accounted for by post-glacial re-expansions during the late upper Palaeolithic/ Mesolithic. "The regional analyses lend some support to the suggestion that much of western and central Europe was repopulated largely from the southwest when the climate improved. The lineages involved include much of the most common haplogroup, H, as well as much of K, T, W, and X." The study could not determine whether there were new migrations of mtDNA lineages from the near east during this period; a significant input was deemed unlikely.[48] The alternative model of more refugees was discussed by Bilton et al.[70]
Neolithic migrations
A big cline in genetic variation which has long been recognized in Europe seems to show important dispersals from the direction of the Middle East. This has often been linked to the spread of farming technology during the Neolithic, which has been argued to be one of the most important periods in determining modern Europen genetic diversity.
The duration of the Neolithic varied from place to place, starting with the introduction of farming and ending with the introduction of bronze implements. In SE Europe it was approximately 7000-3000 BC while in NW Europe 4500-1700 BC. During this era, the Neolithic revolution led to drastic economic as well as socio-cultural changes in Europe and this is also thought to have had a big effect on Europe's genetic diversity, especially concerning genetic lineages entering Europe from the Middle East into the Balkans. There were several phases of this period:
- In a late European Mesolithic prelude to the Neolithic it appears that Near Eastern peoples from areas which already had farming and who also had sea-faring technology, had a transient presence in Greece, for example at Franchthi Cave.[71][72]
- There is consensus that agricultural technology and the main breeds of animals and plants which are farmed entered Europe from somewhere in the area of the Fertile Crescent and specifically the Levant region from the Sinai to Southern Anatolia[73][74] (Less certainly, this agricultural revolution is sometimes argued to have in turn been partly triggered by movements of people and technology coming across the Sinai from Africa.)
- A later stage of the Neolithic, the so-called Pottery Neolithic, saw an introduction of pottery into the Levant, Balkans and Southern Italy (it had been present in the area of modern Sudan for some time before it is found in the Eastern Mediterranean but it is thought to have developed independently) and this may have also been a period of cultural transfer from the Levant into the Balkans.
An important issue regarding the genetic impact of neolithic technologies in Europe is the manner by which they were transferred into Europe; whether farming was introduced by a significant migration of farmers from the Near East (Cavalli-Sforza's biological demic diffusion model) or a "cultural diffusion" or a combination of the two. Secondarily, population geneticists have tried to clarify whether any genetic signatures of Near Eastern origin correspond to the expansion routes postulated by the archaeological evidence.[75]
Martin Richards estimated that 11% of European mtDNA is due to immigration in this period. Gene flow from SE to NW Europe seems to have continued in the Neolithic, the percentage significantly declining towards the British Isles. Classical genetics also suggested that the largest admixture to the European Paleolithic/Mesolithic stock was due to the Neolithic revolution of the 7th to 5th millennia BC.[76] Three main mtDNA gene groups have been identified as contributing Neolithic entrants into Europe: J, T1 and U3 (in that order of importance). With others they amount up to around 20% of the gene pool.[77]
In 2000, Semino's study on Y DNA revealed the presence of haplotypes belonging to the large clade E1b1b1 (E-M35). These were predominantly found in the southern Balkans, southern Italy and parts of Iberia. Semino connected this pattern, along with J haplogroup subclades, to be the Y-DNA component of Cavalli-Sforza's Neolithic demic-diffusion of farmers from the Near East.[78] Rosser et al. rather saw it as a (direct) 'North African component' in European genealogy, although they did not propose a timing and mechanism to account for it.[79] Underhill and Kivisild (2007) also described E1b1b as representing a late-Pleistocene migration from Africa to Europe over the Sinai Peninsula in Egypt, evidence for which does not show up in mitochondrial DNA.[80]

Concerning timing the distribution and diversity of V13 however, Battaglia et al. (2008) proposed an earlier movement whereby the E-M78* lineage ancestral to all modern E-V13 men moved rapidly out of a Southern Egyptian homeland and arrived in Europe with only Mesolithic technologies. They then suggest that the E-V13 sub-clade of E-M78 only expanded subsequently as native Balkan 'foragers-cum-farmers' adopted Neolithic technologies from the Near East. They propose that the first major dispersal of E-V13 from the Balkans may have been in the direction of the Adriatic Sea with the Neolithic Impressed Ware culture often referred to as Impressa or Cardial. Peričic et al. (2005), rather propose that the main route of E-V13 spread was along the Vardar-Morava-Danube river 'highway' system.
In contrast to Battaglia, Cruciani et al. (2007) suggest (i) a different point of V-13 origin and (ii) a later dispersal time. Cruciani argues that V-13 arose in western Asia, where it is found in low but significant frequencies, from whence it entered the Balkans sometime after 11 kYa. It later experienced a rapid dispersal which he dated to c. 5300 years ago in Europe, coinciding with the Balkan Bronze Age. Like Peričic et al. they consider that "the dispersion of the E-V13 and J-M12 haplogroups seems to have mainly followed the river waterways connecting the southern Balkans to north-central Europe".
Most likely, the demographic history of V13 is complex, as later population movements further amplified it's frequency in the Europe.[81] (See below.)
After an initial focus upon E1b1b as a Neolithic marker, a more recent study in January 2010, looked at Y haplogroup R1b1b, which is much more common in Western Europe. Mark Jobling said: "We focused on the commonest Y-chromosome lineage in Europe, carried by about 110 million men, it follows a gradient from south-east to north-west, reaching almost 100% frequency in Ireland. We looked at how the lineage is distributed, how diverse it is in different parts of Europe, and how old it is." The results suggested that the lineage R1b1b2 (R-M269), like E1b1b or J lineages, spread together with farming from the Near East. Dr Patricia Balaresque added: "In total, this means that more than 80% of European Y chromosomes descend from incoming farmers. In contrast, most maternal genetic lineages seem to descend from hunter-gatherers. To us, this suggests a reproductive advantage for farming males over indigenous hunter-gatherer males during the switch from hunting and gathering, to farming".[82][83][84][85]
A more recent article concerning R1b made the counter claim that "the data are still controversial and the analyses so far performed are prone to a number of biases" and presented some evidence that R1b was also part of "an earlier, pre-Neolithic dispersal of haplogroups from a common ancestral gene pool".[86]
Bronze and Iron Age migrations
The Bronze Age saw the development of long-distance trading networks, particularly along the Atlantic Coast and in the Danube valley. There was migration from Norway to Orkney and Shetland in this period (and to a lesser extent to mainland Scotland and Ireland). There was also migration from Germany to eastern England. Martin Richards estimated that there was about 4% mtDNA immigration to Europe in the Bronze Age.
One theory about the origin of the Indo-European language centres around a hypothetical Proto-Indo-European people, who are traced, in the Kurgan hypothesis, to somewhere north of the Black Sea at about 4500 BC. They domesticated the horse, and are considered to have spread their culture and genes across Europe. It has been difficult to identify what these "Kurgan" genes might be, though the Y haplogroup R1a is a proposed marker which would indicate that the physical expansion halted in Germany and only the Kurgan culture and language went further. Another hypothesis — the Anatolian hypothesis — suggests an origin in Anatolia with a later expansion from eastern Europe.
To what extent Indo-European migrations replaced the indigenous Mesolithic peoples is debated.
During the Iron Age, Celts are recorded as having moved from Gaul into northern Italy, Eastern Europe and Anatolia. The relationship between the Celts of Gaul and Spain is unclear as any migration occurred before records exist.
Roman Period
During the period of the Roman Empire, historical sources show that there were many movements of people around Europe, both within and outside the Empire. Historic sources sometimes cite instances of genocide incited by the Romans upon rebellious provincial tribes. If this did in fact occur, it would have been limited given that modern populations show considerable genetic continuity in their respective regions. The process of 'romanization' appears to have been accomplished by the colonization of provinces by a few Latin speaking administrators, military personnel and private citizens (merchants, traders) who emanated from the Empire's various regions (and not merely the Italian peninsula). They served as a nucleus for the acculturation of local notables.[87] Given their small numbers and varied origins, Romanization does not appear to have left distinct genetic signatures in Europe. Indeed, Romance-speaking populations in the Balkans have been found to genetically resemble neighbouring Greek and Slavic-speaking peoples rather than modern Italians.[88][89]
Steven Bird has speculated that E1b1b1a was spread during the Roman era from Italy and the Balkans into the rest of Europe.[81]
See also
- African admixture in Europe
- Archaeogenetics
- Archaeogenetics of the Near East
- Caucasoid
- European ethnic groups
- Human genetic variation
- Population genetics
- Genetic history of indigenous peoples of the Americas
- Genetics and archaeogenetics of South Asia
References
References
- ^ Cavalli-Sforza (1993, p. 39)
- ^ Cavalli-Sforza (1993, p. 51)
- ^ Arredi, Poloni & Tyler-Smith (2007, p. 390)
- ^ a b c d e Rosser et al. (2000)
- ^ Milisauskas (2002, p. 58)
- ^ a b Richards et al (2000)
- ^ Semino (2000)
- ^ Barbujani & Bertorelle (2001:22-25)
- ^ a b Cavalli-Sforza (1997)
- ^ a b Cavalli-Sforza (1993, p. 90-93)
- ^ a b Bowcock AM, Kidd JR, Mountain JL; et al. (1991), "Drift, admixture, and selection in human evolution: a study with DNA polymorphisms", Proceedings of the National Academy of Sciences of the United States of America, 88 (3): 839–43, doi:10.1073/pnas.88.3.839, PMC 50909, PMID 1992475
{{citation}}: Explicit use of et al. in:|author=(help); Unknown parameter|month=ignored (help)CS1 maint: multiple names: authors list (link) - ^ Bauchet et al. (2007)
- ^ a b Nelis, Mari (2009-05-08). "Genetic Structure of Europeans: A View from the North–East". PLoS ONE. 4 (5): e5472. doi:10.1371/journal.pone.0005472. Retrieved 2010-07-05.
{{cite journal}}: Unknown parameter|coauthors=ignored (|author=suggested) (help)CS1 maint: unflagged free DOI (link), see table - ^ Tian, Chao (2009-11). "European Population Genetic Substructure: Further Definition of Ancestry Informative Markers for Distinguishing among Diverse European Ethnic Groups". 15 (11–12): 371–383. doi:10.2119/molmed.2009.00094. ISSN 1076-1551.
{{cite journal}}: Check date values in:|date=(help); Cite journal requires|journal=(help); Unknown parameter|coauthors=ignored (|author=suggested) (help), see table - ^ Cavalli-Sforza (1993)
- ^ Lao et al (2008)
- ^ Cavalli-Sforza (1993, p. 291-296)
- ^ Cavalli-Sforza (1993, p. 268)
- ^ Semino O, Passarino G, Oefner PJ; et al. (2000), "The genetic legacy of Paleolithic Homo sapiens sapiens in extant Europeans: a Y chromosome perspective", Science, 290 (5494): 1155–9, doi:10.1126/science.290.5494.1155, PMID 11073453
{{citation}}: Explicit use of et al. in:|author=(help); Unknown parameter|month=ignored (help)CS1 maint: multiple names: authors list (link) Note: Haplogroup names are different in this article. For example: Haplogroup I is referred as M170 - ^ Balaresque; et al. (2010), "A Predominantly Neolithic Origin for European Paternal Lineages", PLoS Biol., 8 (1), doi:10.1371/journal.pbio.1000285, PMID PMC2799514
{{citation}}: Check|pmid=value (help); Explicit use of et al. in:|author=(help)CS1 maint: unflagged free DOI (link) - ^ a b Myres, Natalie (2010), "A major Y-chromosome haplogroup R1b Holocene effect in Central and Western Europe", European Journal of Human Genetics
- ^ a b Cruciani; et al. (2010), "Strong intra- and inter-continental differentiation revealed by Y chromosome SNPs M269, U106 and U152", Forensic Science International: Genetics, doi:10.1016/j.fsigen.2010.07.006
{{citation}}: Explicit use of et al. in:|author=(help) - ^ Morelli (2010), "A Comparison of Y-Chromosome Variation in Sardinia and Anatolia Is More Consistent with Cultural Rather than Demic Diffusion of Agriculture", PLoS ONE, 5 (4), doi:10.1371/journal.pone.0010419
{{citation}}: CS1 maint: unflagged free DOI (link) - ^ a b Kayser, M; Lao, O; Anslinger, K; Augustin, C; Bargel, G; Edelmann, J; Elias, S; Heinrich, M; Henke, J; et al. (2005), "Significant genetic differentiation between Poland and Germany follows contemporary political borders, as revealed by Y-chromosome analysis", Human Genetics, 117 (5): 428–443, doi:10.1007/s00439-005-1333-9, PMID 15959808, retrieved 2009-07-22
{{citation}}: Explicit use of et al. in:|last=(help) A copy can be found here [1]. - ^ Pericic et al. (2005)
- ^ a b S. Rootsi et al. (2004), Phylogeography of Y-Chromosome Haplogroup I Reveals Distinct Domains of Prehistoric Gene Flow in Europe, American Journal of Human Genetics 75 128–137
- ^ Bowden et al. (2008)
- ^ Dupuy et al. (2005)
- ^ Human Y-Chromosome Variation in the Western Mediterranean Area: Implications for the Peopling of the Region
- ^ Scozzari et al. (2001)
- ^ Kasperaviciūte et al. (2005)
- ^ Peričic et al. (2005), "High-resolution phylogenetic analysis of southeastern Europe traces major episodes of paternal gene flow among Slavic populations", Mol. Biol. Evol. 22 (10): 1964–75, doi:10.1093/molbev/msi185, PMID 15944443
- ^ Battaglia; Fornarino, Simona; Al-Zahery, Nadia; Olivieri, Anna; Pala, Maria; Myres, Natalie M; King, Roy J; Rootsi, Siiri; Marjanovic, Damir; et al. (2008), "Y-chromosomal evidence of the cultural diffusion of agriculture in southeast Europe", European Journal of Human Genetics, 17 (6): 820, doi:10.1038/ejhg.2008.249, PMID 19107149
{{citation}}: Explicit use of et al. in:|author=(help) - ^ Cruciani F, La Fratta R, Santolamazza P; et al. (2004), "Phylogeographic analysis of haplogroup E3b (E-M215) y chromosomes reveals multiple migratory events within and out of Africa", American Journal of Human Genetics, 74 (5): 1014–22, doi:10.1086/386294, PMC 1181964, PMID 15042509
{{citation}}: Explicit use of et al. in:|author=(help); Unknown parameter|month=ignored (help)CS1 maint: multiple names: authors list (link) - ^ Semino et al. (2004)
- ^ The Ancestor Hunter
- ^ World mtDNA haplogroup map
- ^ Mitochondrial DNA sequence variation in human populations, Oulu University Library (Finland)
- ^ Seldin MF, Shigeta R, Villoslada P; et al. (2006), "European population substructure: clustering of northern and southern populations", PLoS Genet., 2 (9): e143, doi:10.1371/journal.pgen.0020143, PMC 1564423, PMID 17044734
{{citation}}: Explicit use of et al. in:|author=(help); Unknown parameter|month=ignored (help)CS1 maint: multiple names: authors list (link) CS1 maint: unflagged free DOI (link) - ^ Measuring European Population Stratification using Microarray Genotype Data
- ^ Lao 2008
- ^ Novembre J, Johnson T, Bryc K; et al. (2008), "Genes mirror geography within Europe", Nature, 456 (7218): 98–101, doi:10.1038/nature07331, PMC 2735096, PMID 18758442
{{citation}}: Explicit use of et al. in:|author=(help); Unknown parameter|month=ignored (help)CS1 maint: multiple names: authors list (link) - ^ Lao O, Lu TT, Nothnagel M; et al. (2008), "Correlation between genetic and geographic structure in Europe", Curr. Biol., 18 (16): 1241–8, doi:10.1016/j.cub.2008.07.049, PMID 18691889, retrieved 2009-07-22
{{citation}}: Explicit use of et al. in:|author=(help); Unknown parameter|month=ignored (help)CS1 maint: multiple names: authors list (link) - ^ Genetic Structure of Europeans: A View from the North–East, Nelis et al. 2009
- ^ Pair-wise Fst between European samples
- ^ C.Tian et .al 2009, European Population Genetic Substructure: Further Definition of Ancestry Informative Markers for Distinguishing among Diverse European Ethnic Groups
- ^ C.Tian et al 2009, Paired Fst values for European populations
- ^ a b Richards 2000
- ^ Klein RG (2003), "Paleoanthropology. Whither the Neanderthals?", Science, 299 (5612): 1525–7, doi:10.1126/science.1082025, PMID 12624250
{{citation}}: Unknown parameter|month=ignored (help) - ^ J. Hardy, A. Pittman, A. Myers, K. Gwinn-Hardy, H.C. Fung, R. de Silva, M. Hutton and J. Duckworth (2005), "Evidence suggesting that Homo neanderthalensis contributed the H2 MAPT haplotype to Homo sapiens", Biochemical Society Transactions, 33, part 4,
We suggest that the H2 haplotype is derived from Homo neanderthalensis and entered H. sapiens populations during the coexistence of these species in Europe from approx. 45 000 to 18 000 years ago and that the H2 haplotype has been under selection pressure since that time, possibly because of the role of this H1 haplotype in neurodegenerative disease."..."The tau (MAPT ) locus is very unusual. Over a region of approx. 1.8 Mb, there are two haplotype clades in European populations, H1 and H2 [6,7]. In other populations, only the H1 occurs and shows a normal pattern of recombination
{{citation}}: CS1 maint: extra punctuation (link) CS1 maint: multiple names: authors list (link) - ^ Shaw-Smith, C; Pittman, Am; Willatt, L; Martin, H; Rickman, L; Gribble, S; Curley, R; Cumming, S; Dunn, C; Kalaitzopoulos, D; Porter, K; Prigmore, E; Krepischi-Santos, Ac; Varela, Mc; Koiffmann, Cp; Lees, Aj; Rosenberg, C; Firth, Hv; De, Silva, R; Carter, Np (2006), "Microdeletion encompassing MAPT at chromosome 17q21.3 is associated with developmental delay and learning disability", Nature genetics, 38 (9): 1032–7, doi:10.1038/ng1858, ISSN 1061-4036, PMID 16906163
{{citation}}: Unknown parameter|month=ignored (help)CS1 maint: multiple names: authors list (link) - ^ Zody, Mc; Jiang, Z; Fung, Hc; Antonacci, F; Hillier, Lw; Cardone, Mf; Graves, Ta; Kidd, Jm; Cheng, Z; Abouelleil, A; Chen, L; Wallis, J; Glasscock, J; Wilson, Rk; Reily, Ad; Duckworth, J; Ventura, M; Hardy, J; Warren, Wc; Eichler, Ee (2008), "Evolutionary toggling of the MAPT 17q21.31 inversion region", Nature genetics, 40: 1076, doi:10.1038/ng.193, ISSN 1061-4036, PMID 18690220
{{citation}}: Unknown parameter|month=ignored (help)CS1 maint: multiple names: authors list (link) - ^ Introgression and microcephalin FAQ John Hawks [2]
- ^ Almos, Pz; Horváth, S; Czibula, A; Raskó, I; Sipos, B; Bihari, P; Béres, J; Juhász, A; Janka, Z; Kálmán, J (2008), "H1 tau haplotype-related genomic variation at 17q21.3 as an Asian heritage of the European Gypsy population", Heredity, 101 (5): 416–9, doi:10.1038/hdy.2008.70, ISSN 0018-067X, PMID 18648385,
In this study, we examine the frequency of a 900 kb inversion at 17q21.3 in the Gypsy and Caucasian populations of Hungary, which may reflect the Asian origin of Gypsy populations. Of the two haplotypes (H1 and H2), H2 is thought to be exclusively of Caucasian origin, and its occurrence in other racial groups is likely to reflect admixture. In our sample, the H1 haplotype was significantly more frequent in the Gypsy population (89.8 vs 75.5%, P<0.001) and was in Hardy–Weinberg disequilibrium (P=0.017). The 17q21.3 region includes the gene of microtubule-associated protein tau, and this result might imply higher sensitivity to H1 haplotype-related multifactorial tauopathies among Gypsies.
{{citation}}: Unknown parameter|month=ignored (help)CS1 maint: multiple names: authors list (link) - ^ Wade, Nicholas (12-02-2009), Scientists in Germany Draft Neanderthal Genome, New York Times, retrieved 2010-05-03
{{citation}}: Check date values in:|date=(help) - ^ Neanderthals 'distinct from us', BBC, 12-02-2009
{{citation}}: Check date values in:|date=(help) - ^ Milisauskas (2002, p. 59)
- ^ Semino 2000. * She refers to it as M 173
- ^ Wells 2001. Eurasian heartland
- ^ a b c Semino 2000
- ^ Torroni A, Bandelt HJ, Macaulay V; et al. (2001), "A signal, from human mtDNA, of postglacial recolonization in Europe", Am. J. Hum. Genet., 69 (4): 844–52, doi:10.1086/323485, PMC 1226069, PMID 11517423, retrieved 2009-07-22
{{citation}}: Explicit use of et al. in:|author=(help); Unknown parameter|month=ignored (help)CS1 maint: multiple names: authors list (link) - ^ Pala; Achilli, Alessandro; Olivieri, Anna; Kashani, Baharak Hooshiar; Perego, Ugo A.; Sanna, Daria; Metspalu, Ene; Tambets, Kristiina; Tamm, Erika; et al. (2009), "Mitochondrial Haplogroup U5b3: A Distant Echo of the Epipaleolithic in Italy and the Legacy of the Early Sardinians", The American Journal of Human Genetics, 84 (6): 814:821, doi:10.1016/j.ajhg.2009.05.004, PMC 2694970, PMID 19500771, retrieved 2009-07-22
{{citation}}: Explicit use of et al. in:|author=(help) - ^ R Wells et al. The Eurasian Heartland: A continental perspective on Y-chromosome diversity
- ^ Semino et al. (2000)
- ^ Pericic. 2005
- ^ Cinnioglu et al. Excavating Y-chromosome haplotype strata in Anatolia. 2003
- ^ Pericic et al (2005) For discussion of eastern European dispersal of R1a1
- ^ Passarino et al (2001) For Scandinavian data
- ^ Semino (2000) general introduction
- ^ Bilton DT, Mirol PM, Mascheretti S, Fredga K, Zima J, Searle JB (1998), "Mediterranean Europe as an area of endemism for small mammals rather than a source for northwards postglacial colonization", Proceedings. Biological Sciences, 265 (1402): 1219–26, doi:10.1098/rspb.1998.0423, PMC 1689182, PMID 9699314
{{citation}}: Unknown parameter|month=ignored (help)CS1 maint: multiple names: authors list (link) - ^ Perlès C, Monthel G ( 2001) The Early Neolithic in Greece: The First Farming Communities in Europe. Cambridge University Press, Cambridge.
- ^ Runnels C (2003) The origins of the Greek Neolithic: a personal view, in Ammerman and Biagi (2003 eds).
- ^ Milisauskas (2002, p. 1143, 150)
- ^ Zeder MA (2008) Domestication and early agriculture in the Mediterranean Basin: Origins, diffusion, and impact. PNAS, 105:11597-11604.
- ^ Milisauskas et al.:146)
- ^ Piazza, Alberto; Cavalli-Sforza, L. L.; Menozzi, Paolo (1994), The history and geography of human genes, Princeton, N.J: Princeton University Press, ISBN 0-691-08750-4
{{citation}}: CS1 maint: multiple names: authors list (link) - ^ Richards
- ^ Semino 2000. Here, the clade E-M35 is referred to as "Eu 4".
- ^ Rosser et al 2000
- ^ Y chromosome data show a signal for a separate late-Pleistocene migration from Africa to Europe via Sinai as evidenced through the distribution of haplogroup E3b lineages, which is not manifested in mtDNA haplogroup distributions.
- ^ a b Bird, Steven (2007), "Haplogroup E3b1a2 as a Possible Indicator of Settlement in Roman Britain by Soldiers of Balkan Origin", Journal of Genetic Genealogy, 3 (2)
{{citation}}: Unknown parameter|isbn-status=ignored (help) - ^ Balaresque et al. 2010, A Predominantly Neolithic Origin for European Paternal Lineages
- ^ Most British men are descended from ancient farmers, The Guardian, 20 january 2010
- ^ Most European males 'descended from farmers', BBC News, 20 january 2010
- ^ Study finds Britons are descended from farmers who left Iraq and Syria 10,000 years ago, Daily Mail, 20 january 2010
- ^ Laura Morelli1, Daniela Contu, Federico Santoni, Michael B. Whalen, Paolo Francalacci, Francesco Cucca; et al. (9 April 2010). "A Comparison of Y-Chromosome Variation in Sardinia and Anatolia Is More Consistent with Cultural Rather than Demic Diffusion of Agriculture". Retrieved 29 April 2010.
{{cite web}}: Explicit use of et al. in:|author=(help)CS1 maint: multiple names: authors list (link) CS1 maint: numeric names: authors list (link) - ^ "Pannonia and Upper Moesia. A History of the Middle Danube Provinces of the Roman Empire. Andras Mocsy. London and Boston, Routledge and Kegan Paul. ISBN 0-7100-7714-9
- ^ Comas D, Schmid H, Braeuer S; et al. (2004), "Alu insertion polymorphisms in the Balkans and the origins of the Aromuns", Annals of Human Genetics, 68 (Pt 2): 120–7, doi:10.1046/j.1529-8817.2003.00080.x, PMID 15008791
{{citation}}: Explicit use of et al. in:|author=(help); Unknown parameter|month=ignored (help)CS1 maint: multiple names: authors list (link) - ^ Bosch E, Calafell F, González-Neira A; et al. (2006), "Paternal and maternal lineages in the Balkans show a homogeneous landscape over linguistic barriers, except for the isolated Aromuns", Annals of Human Genetics, 70 (Pt 4): 459–87, doi:10.1111/j.1469-1809.2005.00251.x, PMID 16759179
{{citation}}: Explicit use of et al. in:|author=(help); Unknown parameter|month=ignored (help)CS1 maint: multiple names: authors list (link)
Bibliography
|
|
External links
- International Society of Genetic Genealogy - 2009 tree of haplogroup R
- Journal of Genetic Genealogy - We Are Not Our Ancestors: Evidence for Discontinuity between Prehistoric and Modern Europeans
- Atlas of the Human Journey
- World Haplogroups Maps
- Origins of Europeans
- Genetic Structure of Human Populations.
- Haplotype R1b
- Haplogroup R1b
| Sub-topics | |
|---|---|
| Genetic history by region | |
| Population genetics by group |
|
.jpg)