
Wiggers diagram: Difference between revisions
No edit summary |
No edit summary Tag: Reverted |
||
| Line 1: | Line 1: | ||
{{Short description|Teaching aid in cardiac physiology}} |
{{Short description|Teaching aid in cardiac physiology}} |
||
[[File:Wiggers Diagram 2.svg|thumb|290px|A Wiggers diagram modified from <ref name=":0">{{Cite journal |last=Mitchell |first=Jamie R. |last2=Wang |first2=Jiun, Jr |date=2014-06-01 |title=Expanding application of the Wiggers diagram to teach cardiovascular physiology |journal=Advances in Physiology Education |volume=38 |issue=2 |pages=170–175 |doi=10.1152/advan.00123.2013 |issn=1043-4046 |pmc=4056172 |pmid=24913453}}</ref>]] |
[[File:Wiggers Diagram 2.svg|thumb|290px|A Wiggers diagram modified from <ref name=":0">{{Cite journal |last=Mitchell |first=Jamie R. |last2=Wang |first2=Jiun, Jr |date=2014-06-01 |title=Expanding application of the Wiggers diagram to teach cardiovascular physiology |journal=Advances in Physiology Education |volume=38 |issue=2 |pages=170–175 |doi=10.1152/advan.00123.2013 |issn=1043-4046 |pmc=4056172 |pmid=24913453}}</ref>]] |
||
A '''Wiggers diagram''', named after its developer, [[Carl J. Wiggers|Carl Wiggers]], is a unique diagram that has been used in teaching [[cardiovascular physiology|cardiac physiology]] for more than a century. |
A '''Wiggers diagram''', named after its developer, [[Carl J. Wiggers|Carl Wiggers]], is a unique diagram that has been used in teaching [[cardiovascular physiology|cardiac physiology]] for more than a century. How Dr. Wiggers developed this diagram is an historical enigma. Wikipedia is rich with sources that show Dr. Wiggers visiting Dr. '''Otto Frank''' in 1912. It is well known Dr Wiggers departed in the Fall of 1912 to return to the USA. {{Cite book |last=Wiggers |first=Carl |title=Circulation in Health and Disease |publisher=Lea & Febiger |year=1915 |location=Philadelphia, PA}}</ref><ref name=":0"/> In the Wiggers diagram, the X-axis is used to plot time subdivided into the cardiac phases, while the Y-axis typically contains the following on a single grid: |
||
* [[Blood pressure]] |
* [[Blood pressure]] |
||
** [[Aortic]] pressure |
** [[Aortic]] pressure |
||
Revision as of 00:24, 19 September 2022

A Wiggers diagram, named after its developer, Carl Wiggers, is a unique diagram that has been used in teaching cardiac physiology for more than a century. How Dr. Wiggers developed this diagram is an historical enigma. Wikipedia is rich with sources that show Dr. Wiggers visiting Dr. Otto Frank in 1912. It is well known Dr Wiggers departed in the Fall of 1912 to return to the USA. Wiggers, Carl (1915). Circulation in Health and Disease. Philadelphia, PA: Lea & Febiger.</ref>[1] In the Wiggers diagram, the X-axis is used to plot time subdivided into the cardiac phases, while the Y-axis typically contains the following on a single grid:
- Blood pressure
- Aortic pressure
- Ventricular pressure
- Atrial pressure
- Ventricular volume
- Electrocardiogram
- Arterial flow (optional)
- Heart sounds (optional)
The Wiggers diagram clearly illustrates the coordinated variation of these values as the heart beats, assisting one in understanding the entire cardiac cycle.[1]
Events
| Phase | EKG | Heart sounds | Semilunar valves | Atrioventricular valves | |
| A | Atrial systole | P | S4* | closed | open |
| B | Ventricular systole – Isovolumetric/isovolumic contraction | QRS | S1 ("lub") | closed | closed |
| C1 | Ventricular systole – Ejection 1 | – | open | closed | |
| C2 | Ventricular systole – Ejection 2 | T | open | closed | |
| D | Ventricular diastole – Isovolumetric/isovolumic relaxation | – | S2 ("dub") | closed | closed |
| E1 | Ventricular diastole – Ventricular filling 1 | – | S3* | closed | open |
| E2 | Ventricular diastole – Ventricular filling 2 | – | closed | open |
Note that during isovolumetric/isovolumic contraction and relaxation, all the heart valves are closed; at no time are all the heart valves open.[1] *S3 and S4 heart sounds are associated with pathologies and are not routinely heard.
Additional images
-
 Ventricular systole
 -
 Cardiac diastole
 -
 ECG
ECG -
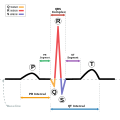 The EKG complex. P=P wave, PR=PR interval, QRS=QRS complex, QT=QT interval, ST=ST segment, T=T wave
 -
 Wiggers with jugular venous waveform


See also
References
- ^ a b c d Mitchell, Jamie R.; Wang, Jiun, Jr (2014-06-01). "Expanding application of the Wiggers diagram to teach cardiovascular physiology". Advances in Physiology Education. 38 (2): 170–175. doi:10.1152/advan.00123.2013. ISSN 1043-4046. PMC 4056172. PMID 24913453.
{{cite journal}}: CS1 maint: multiple names: authors list (link)
This cardiovascular system article is a stub. You can help Wikipedia by expanding it. |