From Wikipedia, the free encyclopedia
1925 Dutch general election|
|
| Turnout | 91.4% |
|---|
|
This lists parties that won seats. See the complete results below. |
General elections were held in the Netherlands on 1 July 1925.[1] The General League of Roman Catholic Caucuses remained the largest party in the House of Representatives, winning 30 of the 100 seats.[2]
Results
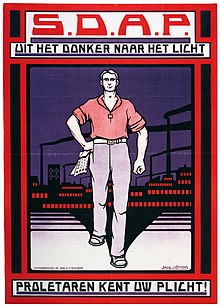 A 1925 SDAP election poster
| Party
|
Votes
|
%
|
Seats
|
+/–
|
| General League of Roman Catholic Caucuses |
883,333 |
28.6 |
30 |
–2
|
| Social Democratic Workers' Party |
706,689 |
22.9 |
24 |
+4
|
| Anti-Revolutionary Party |
377,426 |
12.2 |
13 |
–3
|
| Christian Historical Union |
305,587 |
9.9 |
11 |
0
|
| Liberal State Party |
269,564 |
8.7 |
9 |
–1
|
| Free-thinking Democratic League |
187,183 |
6.1 |
7 |
+2
|
| Farmers' League Left |
62,639 |
2.0 |
1 |
–1
|
| Reformed Political Party |
62,513 |
2.0 |
2 |
+1
|
| Communist Party Holland |
36,770 |
1.2 |
1 |
–1
|
| Roman Catholic People's Party |
36,571 |
1.2 |
1 |
New
|
| Hervormd Gereformeerde Staatspartij |
30,258 |
1.0 |
1 |
+1
|
| Union of Actualists |
127,329 |
4.1 |
0 |
New
|
| Austerity League |
0 |
0
|
| Christian Democratic Union |
0 |
0
|
| Democratic Party |
0 |
0
|
| Land Party |
0 |
0
|
| Agriculture Party |
0 |
New
|
| Middle Class Party |
0 |
New
|
| New National Party |
0 |
New
|
| Party for Pension Interests |
0 |
0
|
| Contributory State Pension |
0 |
New
|
| Protestant People's Party |
0 |
0
|
| Rapaille Partij |
0 |
0
|
| Rentetrekkers |
0 |
New
|
| Revolutionary Work Committee |
0 |
New
|
| Socialist Party |
0 |
0
|
| Sport Party |
0 |
New
|
| Patriotic Party |
0 |
New
|
| Free Thinkers |
0 |
New
|
| Free-thinkers Christian Party |
0 |
New
|
| Wild Party |
0 |
New
|
| Invalid/blank votes |
150,729 |
– |
– |
–
|
| Total |
3,236,591 |
100 |
100 |
0
|
| Registered voters/turnout |
3,543,058 |
91.4 |
– |
–
|
| Source: Nohlen & Stöver
|
| Popular Vote |
|---|
|
|
|
| RKSP |
|
28.63% |
| SDAP |
|
22.90% |
| ARP |
|
12.23% |
| CHU |
|
9.90% |
| VB |
|
8.74% |
| VDB |
|
6.07% |
| SGP |
|
2.03% |
| PB |
|
1.42% |
| CPH |
|
1.19% |
| RKVP |
|
1.19% |
| HGSP |
|
0.98% |
| NMP |
|
0.75% |
| Other |
|
3.98% |
|
References


![Azure, billetty Or a lion with a coronet Or armed and langued Gules holding in his dexter paw a sword Argent hilted Or and in the sinister paw seven arrows Argent pointed and bound together Or. [The seven arrows stand for the seven provinces of the Union of Utrecht.] The shield is crowned with the (Dutch) royal crown and supported by two lions Or armed and langued gules. They stand on a scroll Azure with the text (Or) "Je Maintiendrai" (French for "I will maintain".)](/wiki/File:State_coat_of_arms_of_the_Netherlands.svg)
