Texas's 33rd congressional district
| Texas's 33rd congressional district | |
|---|---|
 Texas's 33rd congressional district – since January 3, 2013. | |
| Representative | |
| Distribution |
|
| Population (2016) | 764,730[1] |
| Median household income | $42,229[1] |
| Ethnicity |
|
| Cook PVI | D+23[2] |
Texas's 33rd congressional district is a new district that was created as a result of the 2010 Census.[3] The first candidates ran in the 2012 House elections, and were seated for the 113th United States Congress.[4]`
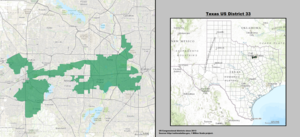
Texas's 33rd congressional district is composed of two counties in Texas—Dallas County and Tarrant County. In Dallas County, the district covers parts of Dallas, Irving, and Grand Prairie, and all of Cockrell Hill. In Tarrant County, the district includes parts of Arlington, Forest Hill, Fort Worth, Grand Prairie, Haltom City, Saginaw and Sansom Park, and all of Everman.
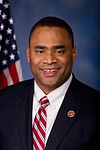
It is currently represented by Democrat Marc Veasey.
Election results from presidential races
| Year | Office | Result |
|---|---|---|
| 2012 | President | Obama 72–27% |
| 2016 | President | Clinton 73–24% |
List of member representing the district
| Member | Party | Years | Cong ress |
Electoral history | Counties represented |
|---|---|---|---|---|---|
| District created | January 3, 2013 | ||||
 Marc Veasey |
Democratic | January 3, 2013 – present |
113th 114th 115th 116th 117th 118th |
Elected in 2012. Re-elected in 2014. Re-elected in 2016. Re-elected in 2018. |
2013–present Parts of Dallas and Tarrant 
|
Election results
2012 election
Marc Veasey and Domingo García took the top two spots in the May 29, 2012, Democratic Primary. Veasey won the runoff on July 31 to determine who faces the Republican nominee, Chuck Bradley, in the general election.[5] Veasey won the general election, and Veasey won the general electionwas seated in the new district.
| Party | Candidate | Votes | % | |
|---|---|---|---|---|
| Democratic | Marc Veasey | 6,938 | 36.77 | |
| Democratic | Domingo Garcia | 4,715 | 24.98 | |
| Democratic | Kathleen Hicks | 2,372 | 12.57 | |
| Democratic | David Alameel | 2,064 | 10.93 | |
| Democratic | Manuel Valdez | 884 | 4.68 | |
| Democratic | Steve Salazar | 482 | 2.55 | |
| Democratic | Chrysta Castaneda | 395 | 2.09 | |
| Democratic | Jason E. Roberts | 342 | 1.81 | |
| Democratic | Carlos Quintanilla | 286 | 1.51 | |
| Democratic | Kyev P. Tatum Sr. | 201 | 1.06 | |
| Democratic | J. R. Molina | 189 | 1.00 | |
| Total votes | 18,868 | 100.00 | ||
| Party | Candidate | Votes | % | |
|---|---|---|---|---|
| Republican | Chuck Bradley | 3,706 | 63.78 | |
| Republican | Charles King | 2,104 | 36.21 | |
| Total votes | 5,810 | 100.00 | ||
| Party | Candidate | Votes | % | |
|---|---|---|---|---|
| Democratic | Marc Veasey | 10,766 | 52.72 | |
| Democratic | Domingo Garcia | 9,653 | 47.27 | |
| Total votes | 20,419 | 100.00 | ||
| Party | Candidate | Votes | % | ±% | |
|---|---|---|---|---|---|
| Democratic | Marc Veasey | 84,940 | 72.53% | ||
| Republican | Chuck Bradley | 30,152 | 25.74% | ||
| Green | Ed Lindsay | 2,006 | 1.71% | ||
| Majority | 54,788 | 46.79% | |||
| Turnout | 117,098 | ||||
2014 election
| Party | Candidate | Votes | % | |
|---|---|---|---|---|
| Democratic | Marc Veasey (Incumbent) | 13,292 | 73.48 | |
| Democratic | Tom Sanchez | 4,798 | 26.52 | |
| Party | Candidate | Votes | % | |
|---|---|---|---|---|
| Democratic | Marc Veasey (Incumbent) | 43,769 | 86.51 | |
| Libertarian | Jason Reeves | 6,823 | 13.49 | |
2016 election
| Party | Candidate | Votes | % | |
|---|---|---|---|---|
| Democratic | Marc Veasey (Incumbent) | 20,526 | 63.41 | |
| Democratic | Carlos Quintanilla | 11,846 | 36.59 | |
| Party | Candidate | Votes | % | |
|---|---|---|---|---|
| Republican | M. Mark Mitchell | 6,411 | 52.37 | |
| Republican | Bruce Chadwick | 5,831 | 47.63 | |
| Party | Candidate | Votes | % | |
|---|---|---|---|---|
| Democratic | Marc Veasey | 93,147 | 73.71 | |
| Republican | M. Mark Mitchell | 33,222 | 26.29 | |
| Total votes | 126,369 | 100 | ||
| Democratic hold | ||||
2018 election
| Party | Candidate | Votes | % | |
|---|---|---|---|---|
| Democratic | Marc Veasey (Incumbent) | 14,998 | 70.6 | |
| Party | Candidate | Votes | % | |
|---|---|---|---|---|
| Republican | Willie Billups | 5,254 | 100 | |
| Party | Candidate | Votes | % | |
|---|---|---|---|---|
| Democratic | Marc Veasey (Incumbent) | 90,805 | 76.2 | |
| Republican | Willie Billups | 26,120 | 21.9 | |
| Libertarian | Jason Reeves | 2,299 | 1.9 | |
| Total votes | 119,224 | 100 | ||
| Democratic hold | ||||
References
- ^ a b "My Congressional District".
- ^ "Partisan Voting Index – Districts of the 115th Congress" (PDF). The Cook Political Report. April 7, 2017. Retrieved April 7, 2017.
- ^ Blake, Aaron (December 21, 2010). "Census 2010 shows Red states gaining congressional districts". The Washington Post The Fix blog. Retrieved December 21, 2010.
- ^ Blake, Aaron (November 18, 2010). "Mapping the Future: GOP will draw map in Texas". The Washington Post The Fix blog. Retrieved November 18, 2010.
- ^ http://www.star-telegram.com/2012/06/29/4070194/veasey-garcia-debate-turns-ugly.html[dead link]
- ^ a b c "1992 - 2006 Election History". Office of the Secretary of State of Texas. Archived from the original on November 8, 2006. Retrieved September 22, 2013.
- ^ "2012 General Election: Election Night Returns: Unofficial Elections Results As Of: 11/9/2012 3:14:43 PM". Office of the Secretary of State of Texas. Archived from the original on December 5, 2012. Retrieved November 10, 2012.
- ^ "2018 Primary Election Official Results". Texas Secretary of State. Retrieved March 8, 2018.
- ^ http://elections.sos.state.tx.us/elchist325_state.htm
