Perth and North Perthshire (UK Parliament constituency)
56°23′42″N 3°26′06″W / 56.395°N 3.435°W
| Perth and North Perthshire | |
|---|---|
| County constituency for the House of Commons | |
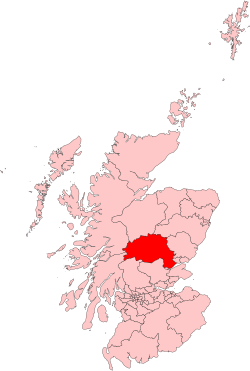
 Boundary of Perth and North Perthshire in Scotland | |
| Subdivisions of Scotland | Perth and Kinross |
| Major settlements | Blair Atholl, Dunkeld and Birnam, Invergowrie, Perth, Pitlochry |
| Current constituency | |
| Created | 2005 |
| Member of Parliament | Pete Wishart (SNP) |
| Created from | Perth (parts of), North Tayside (parts of) |
Perth and North Perthshire is a county constituency of the House of Commons of the Parliament of the United Kingdom. It elects one Member of Parliament (MP) by the first past the post system of election. The seat was created in 2005. The seat is statistically, in local percentage terms, the second-closest result of the 2017 contests nationwide.
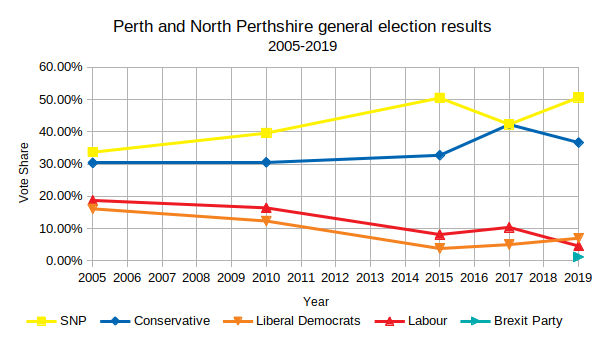
Campaigns in the seat have resulted in a minimum of 30% of votes at each election consistently for the same two parties' choice for candidate, and the next lower-placed party's having fluctuated between 8.1% and 18.7% of the vote since its relatively recent creation. The seat attracted a record seven candidates in 2015 and has seen as few as four, in 2017.
Boundaries
| Council areas grouped by the Fifth Periodical Review[1] |

|
| Clackmannanshire and Perth and Kinross |
As a result of the Fifth Periodical Review[1] of the Boundary Commission for Scotland, the constituency (seat) was created to cover northern parts of the Perth and Kinross council area, and first used in the 2005 general election. Ochil and South Perthshire was created, at the same time, to cover the rest of that council area and the Clackmannanshire council area.
Before the 2005 election, these combined council areas had been covered by Angus, Ochil, Perth and North Tayside seats. The Perth seat lay within the Perth and Kinross council area, North Tayside covered a northern portion of that council area and a northern portion of the Angus council area, Angus covered a small southeastern portion of the Perth and Kinross council area, a southern portion of its associated council area, and northern portions of the Dundee City council area, and Ochil covered another southeastern portion of the Perth and Kinross council area, the whole of the Clackmannanshire council area and a southeastern portion of the Stirling council area.
Constituency profile
The seat's voters stretch across the north of the Perth and Kinross local council area in Scotland. It is an affluent, predominantly rural seat with notable livestock, salmon, fishing, hospitality, tourism and fruit-growing sectors. In its south, around the River Tay is Perth and its adjacent villages. Perth includes a mix of affluent middle-class suburbs to the south-west and more deprived areas around its north.
Notwithstanding the possibility of breakthrough national and local campaigns and developments, campaigns to date have produced a close-run two-candidate contest as to the lion's share of the votes between the Conservative and the Scottish National Parties' candidates. During the main forerunner seat's existence (Perth and East Perthshire, created in 1950), it returned MPs loyal to the Unionist Party and the Conservative and Unionist Party after the parties amalgamated in 1965.
The seat was one of eleven in Scotland to elect an SNP MP to Parliament at the 1974 October general election. With a rearrangement (redistribution) of seats in 1979 the successor seat of North Tayside went on to return Conservative candidate Bill Walker to Parliament until he was defeated by John Swinney of the SNP at the 1997 UK general election - from that point onwards the seat elected successive SNP members as its MP. Conservatives narrowly missed out on gaining the seat at the 2005 UK general election: Douglas Taylor coming behind Pete Wishart by 1,521 votes. Wishart increased his majority such as with 9,641 votes clearance in 2015. The Conservative missed out on gaining the seat by 21 votes at the 2017 general election, the third-closest result in the nation after North East Fife and Kensington, but ahead of Kensington if ranked by percentage of the votes locally cast.[2][3]
Members of Parliament
| Election | Member | Party | |
|---|---|---|---|
| style="background-color: Template:Scottish National Party/meta/color" | | 2005 | Pete Wishart[4] | SNP |
Elections

Elections in the 2010s
| Party | Candidate | Votes | % | ±% | |
|---|---|---|---|---|---|
| SNP | Pete Wishart | 27,362 | 50.6 | +8.3 | |
| Conservative | Angus Forbes | 19,812 | 36.6 | −5.6 | |
| Liberal Democrats | Peter Barrett | 3,780 | 7.0 | +2.0 | |
| Labour | Angela Bretherton | 2,471 | 4.6 | −5.8 | |
| Brexit Party | Stuart Powell | 651 | 1.2 | New | |
| Majority | 7,550 | 14.0 | +13.96 | ||
| Turnout | 54,014 | 74.4 | +2.6 | ||
| SNP hold | Swing | +7.0 | |||
Perth and North Perthshire was the third most marginal result in the United Kingdom and second most marginal result in Scotland at the 2017 general election, with incumbent SNP MP Pete Wishart seeing his majority cut from 9,641 votes (17.8%) to just 21 votes (0.0%) ahead of the Conservatives, although he did receive the highest number of votes for any SNP candidate.[2]
| Party | Candidate | Votes | % | ±% | |
|---|---|---|---|---|---|
| SNP | Pete Wishart | 21,804 | 42.3 | −8.2 | |
| Conservative | Ian Duncan | 21,783 | 42.3 | +9.4 | |
| Labour | David Roemmele | 5,349 | 10.4 | +2.3 | |
| Liberal Democrats | Peter Barrett | 2,589 | 5.0 | +1.2 | |
| Majority | 21 | 0.04 | −17.76 | ||
| Turnout | 51,525 | 71.8 | −3.0 | ||
| SNP hold | Swing | -8.9 | |||
| Party | Candidate | Votes | % | ±% | |
|---|---|---|---|---|---|
| SNP | Pete Wishart | 27,379 | 50.5 | +10.9 | |
| Conservative | Alexander Stewart[10] | 17,738 | 32.7 | +2.2 | |
| Labour | Scott Nicholson | 4,413 | 8.1 | −8.3 | |
| Liberal Democrats | Peter Barrett | 2,059 | 3.8 | −8.5 | |
| Scottish Green | Louise Ramsay | 1,146 | 2.1 | New | |
| UKIP | John Myles | 1,110 | 2.0 | New | |
| Independent | Xander McDade | 355 | 0.7 | New | |
| Majority | 9,641 | 17.8 | +8.7 | ||
| Turnout | 54,200 | 74.8 | +7.9 | ||
| SNP hold | Swing | +4.3 | |||
| Party | Candidate | Votes | % | ±% | |
|---|---|---|---|---|---|
| SNP | Pete Wishart | 19,118 | 39.6 | +5.9 | |
| Conservative | Peter Lyburn | 14,739 | 30.5 | +0.2 | |
| Labour | Jamie Glackin | 7,923 | 16.4 | −2.3 | |
| Liberal Democrats | Peter Barrett | 5,954 | 12.3 | −3.8 | |
| Trust | Douglas Taylor | 534 | 1.1 | New | |
| Majority | 4,379 | 9.1 | +5.8 | ||
| Turnout | 48,268 | 66.9 | +2.1 | ||
| SNP hold | Swing | +2.9 | |||
Elections in the 2000s
| Party | Candidate | Votes | % | ±% | |
|---|---|---|---|---|---|
| SNP | Pete Wishart | 15,469 | 33.7 | −2.3 | |
| Conservative | Douglas Taylor | 13,948 | 30.4 | +5.4 | |
| Labour | Doug Maughan | 8,601 | 18.7 | −5.7 | |
| Liberal Democrats | Gordon Campbell | 7,403 | 16.1 | +4.0 | |
| Scottish Socialist | Philip Stott | 509 | 1.1 | −1.2 | |
| Majority | 1,521 | 3.3 | |||
| Turnout | 45,930 | 64.8 | N/A | ||
| SNP win (new seat) | |||||
Notes and references
- ^ a b "Fifth Periodical Review of UK Parliament constituencies Final Recommendations". Boundary Commission forScotland. Retrieved 12 March 2017.
- ^ a b Gallagher, Paul (2017-06-09). "General election 2017: The smallest majorities of the night". The Independent. Retrieved 2017-06-19.
- ^ Library, House of Commons (June 23, 2017). "GE2017: Marginal seats and turnout".
- ^ "Pete Wishart MP". parliament.uk. Retrieved 12 March 2017.
- ^ "Statement of Persons Nominated and Notice of Polll" (PDF). Perth and Kinross Council. Retrieved 2019-11-14.
- ^ "Perth & North Perthshire parliamentary constituency - Election 2019". Retrieved 2019-12-15.
- ^ "General Election: SNP reselects 54 MPs". www.scotsman.com.
- ^ "Election Data 2015". Electoral Calculus. Archived from the original on 17 October 2015. Retrieved 17 October 2015.
- ^ "UK Parliamentary General Election results". Perth & Kinross Council. Retrieved 12 March 2017.
- ^ Bonn, Melanie (16 December 2014). "Perth Conservative councillor announces he's running to be a Westminster MP". Daily Record. Retrieved 12 March 2017.
- ^ "Election Data 2010". Electoral Calculus. Archived from the original on 26 July 2013. Retrieved 17 October 2015.
- ^ "Election 2010 - Perth & Perthshire North". BBC News. Retrieved 12 March 2017.
- ^ "Election Data 2005". Electoral Calculus. Archived from the original on 15 October 2011. Retrieved 18 October 2015.
