Georgia's 13th congressional district
Appearance
33°38′56.12″N 84°43′45.51″W / 33.6489222°N 84.7293083°W
| Georgia's 13th congressional district | |
|---|---|
 Georgia's 13th congressional district - since January 3, 2013. | |
| Representative | |
| Population (2010) | 691,976[1] |
| Ethnicity | |
| Cook PVI | D+9[2] |
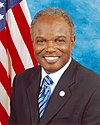
Georgia's 13th congressional district is a congressional district in the U.S. state of Georgia. The district is currently represented by Democrat David Scott, though the district's boundaries have been redrawn following the 2010 census, which granted an additional congressional seat to Georgia.[3] The first election using the new district boundaries (listed below) were the 2012 congressional elections.
The district is located in the southern and western portions of the Atlanta metropolitan area and includes the cities of Austell, Jonesboro, Mableton, Douglasville, Stockbridge, and Union City, as well as the southern fourth of Atlanta itself.[4][5]
Counties
- Clayton (Partial, see also 5th district)
- Cobb (Partial, see also 6th district and 11th district)
- Douglas
- Fayette (Partial, see also 3rd district)
- Fulton (Partial, see also 5th district, 6th district, and 11th district)
- Henry (Partial, see also 3rd district and 10th district)
List of representatives
| Congress | Years | Representative | Party | Constituency | Electoral History |
|---|---|---|---|---|---|
| 108th | January 3, 2003 – Present |  David Scott |
Democratic |  |
First elected in 2002. Re-elected in 2004. |
| 109th | |||||
| 110th |  |
Re-elected in 2006. Re-elected in 2008. Re-elected in 2010 | |||
| 111th | |||||
| 112th | |||||
| 113th | Douglas County and parts of Clayton, Cobb, Fayette, Fulton, and Henry counties. | Re-elected in 2012.. Re-elected in 2014. | |||
| 114th |
Election results
2002
| Party | Candidate | Votes | % | |
|---|---|---|---|---|
| Democratic | David Scott | 70,011 | 59.63 | |
| Republican | Clay Cox | 47,405 | 40.37 | |
| Total votes | 117,416 | 100.00 | ||
| Turnout | ||||
| Democratic hold | ||||
2004
| Party | Candidate | Votes | % | |
|---|---|---|---|---|
| Democratic | David Scott* | 170,657 | 100.00 | |
| Total votes | 170,657 | 100.00 | ||
| Turnout | ||||
| Democratic hold | ||||
2006
| Party | Candidate | Votes | % | |
|---|---|---|---|---|
| Democratic | David Scott* | 103,019 | 69.24 | |
| Republican | Deborah Honeycutt | 45,770 | 30.76 | |
| Total votes | 148,789 | 100.00 | ||
| Turnout | ||||
| Democratic hold | ||||
2008
| Party | Candidate | Votes | % | |
|---|---|---|---|---|
| Democratic | David Scott* | 205,914 | 69.05 | |
| Republican | Deborah Honeycutt | 92,309 | 30.95 | |
| Total votes | 298,223 | 100.00 | ||
| Turnout | ||||
| Democratic hold | ||||
2010
| Party | Candidate | Votes | % | |
|---|---|---|---|---|
| Democratic | David Scott* | 140,294 | 69.43 | |
| Republican | Mike Crane | 61,771 | 30.57 | |
| Total votes | 202,065 | 100.00 | ||
| Turnout | ||||
| Democratic hold | ||||
2012
| Party | Candidate | Votes | % | |
|---|---|---|---|---|
| Democratic | David Scott* | 201,988 | 71.74 | |
| Republican | S. Malik | 79,550 | 28.26 | |
| Total votes | 281,538 | 100.00 | ||
| Turnout | ||||
| Democratic hold | ||||
References
- ^ Statistical Analysis of 2012 Congressional maps, Georgia Legislature. Last accessed 2012-1-1
- ^ "Partisan Voting Index Districts of the 113th Congress: 2004 & 2008" (PDF). The Cook Political Report. 2012. Retrieved 2013-01-10.
- ^ Justice Department approves Georgia's political maps. Atlanta Journal-Constitution. Last accessed 2011-12-27
- ^ 2012 Congressional maps, Georgia Legislature. Last accessed 2012-1-1
- ^ 2012 Congressional maps - Metro Atlanta, Georgia Legislature. Last accessed 2012-1-1
- ^ http://results.enr.clarityelections.com/GA/42277/113204/en/summary.html
