
Brecht, Belgium
Brecht | |
|---|---|
 | |
 Flag  Coat of arms | |
Location of Brecht  | |
 Brecht Location in Belgium
Location of Brecht in the province of Antwerp  | |
| Coordinates: 51°21′N 04°38′E / 51.350°N 4.633°E | |
| Country | |
| Community | Flemish Community |
| Region | Flemish Region |
| Province | Antwerp |
| Arrondissement | Antwerp |
| Government | |
| • Mayor | Sven Deckers (N-VA) |
| • Governing party/ies | N-VA, CD&V-CDB |
| Area | |
| • Total | 91.46 km2 (35.31 sq mi) |
| Population (2020-01-01)[1] | |
| • Total | 29,454 |
| • Density | 320/km2 (830/sq mi) |
| Postal codes | 2960 |
| NIS code | 11009 |
| Area codes | 03 |
| Website | www.brecht.be |
Brecht (Dutch pronunciation: [brɛxt] ) is a municipality located in the Belgian province of Antwerp. The municipality comprises the towns of Brecht proper, Sint-Job-in-'t-Goor and Sint-Lenaarts. In 2021, Brecht had a total population of 29,809. The total area is 90.84 km2.[2]
Brecht is a fast-growing municipality in the north of the Antwerp province, near the Dutch border. Noorderkempen, a railway station on the HSL 4, opened on 15 June 2009.
Images
[edit]-
 Sint-Michielskerk in Brecht
 -
 Nature reserve Groot Schietveld
 -
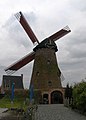 Windmill in Brecht


Notable people
[edit]- Jan van der Noot (1539–1595), writer and poet, born in Brecht
- Leonard Lessius (1554–1623), moral theologian, born in Brecht
- Walter Van Beirendonck (1957–), fashion designer and one of the Antwerp Six
- Jean Kockerols (1958–), Roman Catholic bishop
Climate
[edit]| Climate data for Brecht (1991–2020 normals) | |||||||||||||
|---|---|---|---|---|---|---|---|---|---|---|---|---|---|
| Month | Jan | Feb | Mar | Apr | May | Jun | Jul | Aug | Sep | Oct | Nov | Dec | Year |
| Mean daily maximum °C (°F) | 6.4 (43.5) |
7.4 (45.3) |
11.1 (52.0) |
15.4 (59.7) |
18.9 (66.0) |
21.6 (70.9) |
23.5 (74.3) |
23.4 (74.1) |
19.9 (67.8) |
15.2 (59.4) |
10.2 (50.4) |
6.8 (44.2) |
15.0 (59.0) |
| Daily mean °C (°F) | 3.6 (38.5) |
4.1 (39.4) |
6.8 (44.2) |
10.1 (50.2) |
13.9 (57.0) |
16.7 (62.1) |
18.7 (65.7) |
18.3 (64.9) |
15.1 (59.2) |
11.2 (52.2) |
7.1 (44.8) |
4.2 (39.6) |
10.8 (51.4) |
| Mean daily minimum °C (°F) | 0.9 (33.6) |
0.7 (33.3) |
2.6 (36.7) |
4.8 (40.6) |
8.8 (47.8) |
11.8 (53.2) |
13.8 (56.8) |
13.3 (55.9) |
10.4 (50.7) |
7.3 (45.1) |
4.0 (39.2) |
1.6 (34.9) |
6.7 (44.1) |
| Average precipitation mm (inches) | 81.3 (3.20) |
74.0 (2.91) |
65.1 (2.56) |
48.5 (1.91) |
67.0 (2.64) |
80.5 (3.17) |
87.9 (3.46) |
91.1 (3.59) |
79.7 (3.14) |
79.4 (3.13) |
91.1 (3.59) |
103.6 (4.08) |
949.4 (37.38) |
| Average precipitation days (≥ 1.0 mm) | 13.6 | 12.4 | 11.2 | 9.2 | 10.2 | 10.5 | 11.0 | 11.1 | 10.6 | 11.7 | 14.0 | 15.2 | 140.8 |
| Mean monthly sunshine hours | 61 | 78 | 134 | 190 | 219 | 217 | 222 | 208 | 162 | 116 | 67 | 51 | 1,725 |
| Source: Royal Meteorological Institute[3] | |||||||||||||
See also
[edit]References
[edit]- ^ "Bevolking per gemeente op 1 januari 2020". Statbel.
- ^ "Bevolking per statistische sector – Sector 11009". Statistics Belgium. Retrieved 9 May 2022.
- ^ "Luchttemperatuur en neerslag Referentieperiode: 1991–2020" (PDF) (in Dutch). Royal Meteorological Institute. Retrieved July 9, 2022.
External links
[edit]Wikimedia Commons has media related to Brecht, Belgium.
- (in Dutch) Official website
- (in Dutch) Tourism in Brecht
Places adjacent to Brecht, Belgium | |
|---|---|

| International | |
|---|---|
| National | |
| Geographic | |
This Antwerp Province location article is a stub. You can help Wikipedia by expanding it. |