
History of the United States public debt
This article needs to be updated. (July 2020) |


The Federal Government has over 6:1 debt to revenue ratio as of Q3 2022

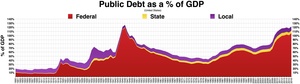
The history of the United States public debt began with federal government debt incurred during the American Revolutionary War by the first U.S treasurer, Michael Hillegas, after the country's formation in 1776. The United States has continuously experienced fluctuating public debt, except for about a year during 1835–1836. To facilitate comparisons over time, public debt is often expressed as a ratio to gross domestic product (GDP). Historically, the United States public debt as a share of GDP has increased during wars and recessions, and subsequently declined.
The United States public debt as a percentage of GDP reached its peak during Harry Truman's first presidential term, amidst and after World War II. It rapidly declined in the post-World War II period, reaching a low in 1973 under President Richard Nixon. Since then, debt as a share of GDP has consistently risen, with exceptions during the terms of Presidents Jimmy Carter and Bill Clinton. Public debt surged during the 1980s, as Ronald Reagan cut tax rates and increased military spending, while it decreased in the 1990s due to reduced military spending, increased taxes, and the economic boom.
Public debt sharply rose following the 2007–08 financial crisis, driven by significant tax revenue declines and spending increases.
During the COVID-19 pandemic, US public debt dramatically increased due to emergency measures aimed at sustaining the economy amidst widespread economic retraction across various industries, alongside high unemployment rates.[2]
Early history[edit]

1790s[edit]
Except for about a year during 1835–1836, the United States has continuously had a fluctuating public debt since its Constitution went into effect on March 4, 1789. During the American Revolution, the Continental Congress, under the Articles of Confederation, amassed huge war debts, but lacked the power to repay these obligations through taxation or duties on imports.[3][4]
On the founding of the United States, the financial affairs of the new federation were in disarray, exacerbated by an economic crisis in urban commercial centers.[5] In 1790, Secretary of the Treasury Alexander Hamilton pushed for Congress to pass a financial plan, called the First Report on the Public Credit,[6] a controversial part of which involved the federal government assuming state debts incurred during the Revolutionary War.[7] Northern states had accumulated a huge amount of debt during the war, amounting to $21.5 million, and wanted the federal government to assume their burden. The Southern states, which had lower or no debts, whose citizens would effectively pay a portion of this debt if the federal government assumed it, were disinclined to accept the proposal. Some states, including Virginia, had already paid off almost half of their debts, and felt that their taxpayers should not be assessed again to bail out the less provident, and further argued that the plan was beyond the constitutional power of the new government. James Madison, then a representative from Virginia, led a group of legislators from the South in blocking the provision and prevent the plan from gaining approval. Jefferson supported Madison.[8] The plan was finally adopted as part of the Compromise of 1790, as the Funding Act of 1790. The compromise meant that the state debts were all picked up by the federal Treasury, and the permanent national capital would be located in the South, along the Virginia-Maryland border in what became the District of Columbia.
The assumption issue[edit]
Historian Max M. Edling has explained how assumption worked. It was the critical issue; the location of the capital was a bargaining ploy. Hamilton proposed that the federal Treasury take over and pay off all the debt that states had incurred to pay for the American Revolution. The Treasury would issue bonds that rich people would buy, thereby giving the rich a tangible stake in the success of the national government. Hamilton proposed to pay off the new bonds with revenue from a new tariff on imports. Jefferson originally approved the scheme, but Madison had turned him around by arguing that federal control of debt would consolidate too much power in the national government. Edling points out that after its passage in 1790, the assumption was accepted. Madison did try to pay speculators below 100%, but they were paid the face value of the state debts they held regardless of how little they paid for them. When Jefferson became president he continued the system. The credit of the U.S. was solidly established at home and abroad, and Hamilton was successful in signing up many of the bondholders in his new Federalist Party. Good credit allowed Jefferson's Treasury Secretary Albert Gallatin to borrow in Europe to finance the Louisiana Purchase in 1803, as well as to borrow to finance the War of 1812.[9]
The Southern states extracted a major concession from Hamilton in the recalculation of their debt under the fiscal plan.[10] For example, in the case of Virginia, a zero-sum arrangement was contrived, in which Virginia paid $3.4 million to the federal government, and received exactly that amount in federal compensation.[11] The revision of Virginia's debt, coupled with Potomac residence issue, ultimately netted it over $13 million.[12] Another result of federal assumption of state debts was to give the federal government much more power by placing the country's most serious financial obligation in the hands of the federal government rather than the state governments. The federal government was able to avoid competing in interest with the States.
The debts of the federal government on January 1, 1791 amounted to $75,463,476.52, of which about $40 million was domestic debt, $12 million was foreign debt, and $18.3 million were state debts assumed by the federal government, of the $21.5 million that had been authorized.[13]
1790s to 1834[edit]
To reduce the debt, from 1796 to 1811 there were 14 budget surpluses and 2 deficits. There was a sharp increase in the debt as a result of the War of 1812. In the 20 years following that war, there were 18 surpluses.[citation needed]
Payment of US national debt[edit]
On January 8, 1835, president Andrew Jackson paid off the entire national debt, the only time in U.S. history that has been accomplished.[14][15] However, this and other factors, such as the government giving surplus money to state banks, soon led to the Panic of 1837, in which the government had to resume borrowing money.[14]
1836 to 1910[edit]
In 1836 debt began again (the debt on January 1, 1836 was $37,000).[16][17]
Another sharp increase in the debt occurred as a result of the Civil War. The debt was just $65 million in 1860, but passed $1 billion in 1863 and reached $2.7 billion by the end of the war. During the following 47 years, there were 36 surpluses and 11 deficits. During this period 55% of the national debt was paid off.
World War I and Great Depression[edit]
Debt increased again during World War I (1914–1918), reaching $25.5 billion at its conclusion. Approximately $17 billion in debt was raised through the selling of Liberty Bonds to the general public to finance the U.S.'s military effort. The war was followed by 11 consecutive surpluses that saw the debt reduced by 36% by the end of the 1920s.[18]
Warren G. Harding was elected president in 1920 and believed the federal government should be fiscally managed in a way similar to private sector businesses. He had campaigned in 1920 on the slogan, "Less government in business and more business in government."[19] Under Harding, federal spending declined from $6.3 billion in 1920 to $5 billion in 1921 and $3.3 billion in 1922. Over the course of the 1920s, under the leadership of Calvin Coolidge, the national debt was reduced by one third.[20] The decrease was even greater when the growth in GDP and inflation is taken into account.
Debt held by the public was $15.05 billion (~$219 billion in 2023) or 16.5% of GDP in 1930. When Franklin D. Roosevelt took office in 1933, the public debt was almost $20 billion, 20 (~$374 billion in 2023)% of GDP. Decreased tax revenues and spending on social programs during the Great Depression increased the debt and by 1936, the public debt had increased to $33.7 billion (~$582 billion in 2023), approximately 40% of GDP.[21] During its first term, the Roosevelt administration ran large annual deficits of between 2 and 5% of GDP. By 1939, the debt held by the public had increased to $39.65 billion (~$682 billion in 2023) or 43% of GDP. The buildup and involvement in World War II during the presidencies of F.D. Roosevelt and Harry S. Truman led to the largest increase in public debt. Public debt rose over 100% of GDP to pay for the mobilization before and during the war. Public debt was $251.43 billion or 112% of GDP at the conclusion of the war in 1945 and was $260 billion in 1950.
After World War II[edit]

The public debt as a percentage of GDP fell rapidly after the end of World War II under the presidency of Harry S. Truman, as the U.S. and the rest of the world experienced a post-war economic expansion. Unlike previous wars, the Korean War (1950–53) was largely financed by taxation and did not lead to an increase in the public debt.[22]
Growth rates in Western countries began to slow in the late-1960s. Beginning in the mid-1970s and afterwards, U.S. national debt began to increase faster than GDP.[23][24]
The public debt relative to GDP reached a post-World War II low of 24.6% in 1974.[18][25] In that year, the Congressional Budget and Impoundment Control Act of 1974 reformed the budget process to allow Congress to challenge the president's budget more easily, and, as a consequence, deficits became increasingly difficult to control.[26] National debt held by the public increased from its postwar low of 24.6% of GDP in 1974 to 26.2% in 1980.[27]
Debt held by the public relative to GDP rose rapidly again in the 1980s. President Ronald Reagan's economic policies lowered tax rates (Reagan slashed the top income tax rate from 70% to 28%, although bills passed in 1982 and 1984 later partially reversed those tax cuts.)[26][28] and increased military spending, while congressional Democrats blocked cuts to social programs.[24][26][28] As a result, debt as a share of GDP increased from 26.2% in 1980 to 40.9% in 1988,[27] and it continued to rise during the presidency of George H. W. Bush, reaching 48.3% of GDP in 1992.[18][29]

Debt held by the public reached a high of 49.5% of GDP at the beginning of President Clinton's first term. However, it fell to 34.5% of GDP by the end of Clinton's presidency due in part to decreased military spending, increased taxes (in 1990, 1993 and 1997), and increased tax revenue resulting from the 1990s boom.[18][25][30][31][32] The budget controls instituted in the 1990s successfully restrained fiscal action by the Congress and the President and together with economic growth contributed to the budget surpluses at the end of the decade.[33] The surpluses led to a decline in the public debt from about 43% of GDP in 1998 to about 33% by 2001.[33]
In the early 21st century, debt held by the public relative to GDP rose again due in part to the Bush tax cuts and increased military spending caused by the wars in the Middle East and a new entitlement Medicare D program. During the presidency of George W. Bush, debt held by the public increased from $3.339 trillion in September 2001 to $6.369 trillion by the end of 2008.[34][35] In the aftermath of the global financial crisis of 2007–08 and related significant revenue declines and spending increases, debt held by the public increased to $11.917 trillion by the end of July 2013, under the presidency of Barack Obama.[34][36]
2011 credit rating downgrade[edit]
On August 5, 2011, the United States debt-ceiling crisis of 2011, the credit rating agency Standard & Poor's downgraded the rating of the federal government from AAA to AA+. It was the first time the U.S. had been downgraded since it was originally given a AAA rating on its debt by Moody's in 1917.[37] BBC News reported that Standard & Poor's had "lost confidence" in the ability of the U.S. government to make decisions.[38]
Changes in debt by political affiliation[edit]

The President proposes a national budget to Congress, which has final say over the document but rarely appropriates more than what the President requests.[39]
Economic historian J. Bradford DeLong, observed a contrast not so much between Republicans and Democrats but between Democrats and "old-style Republicans (Eisenhower and Nixon)" on one hand (decreasing debt) and "new-style Republicans" on the other (increasing debt).[40][41] David Stockman, former director of the Office of Management and Budget, blamed the "ideological tax-cutters" of the Reagan administration for the increase of national debt during the 1980s.[42] Former Treasury official Bruce Bartlett attributed the increase in the national debt since the 1980s to the policy of "starve the beast".[43][44] While noting that George H. W. Bush's budget deal in 1990 was one of the reasons for improvement of the fiscal situation in 1990s, Bartlett was highly critical of George W. Bush for creating budget deficits by reducing tax rates and increasing spending in the early 2000s.[45][46]
Causes of recent changes in debt[edit]
Public debt is the cumulative result of budget deficits; that is, government spending exceeding revenues.
2001 vs. 2009[edit]

According to the Congressional Budget Office, the United States last had a budget surplus during fiscal year 2001, though the national debt still increased.[47] From fiscal years 2001 to 2009, spending increased by 6.5% of gross domestic product (from 18.2% to 24.7%) while taxes declined by 4.7% of GDP (from 19.5% to 14.8%). Spending increases (expressed as percentage of GDP) were in the following areas: Medicare and Medicaid (1.7%), defense (1.6%), income security such as unemployment benefits and food stamps (1.4%), Social Security (0.6%) and all other categories (1.2%). Revenue reductions were individual income taxes (−3.3%), payroll taxes (−0.5%), corporate income taxes (−0.5%) and other (−0.4%).
The 2009 spending level was the highest relative to GDP in 40 years, while the tax receipts were the lowest relative to GDP in 40 years. The next highest spending year was 1985 (22.8%), while the next lowest tax year was 2004 (16.1%).[48]
2001 vs. 2011[edit]

In June 2012, the Congressional Budget Office summarized the cause of change between its January 2001 estimate of a $5.6 trillion cumulative surplus between 2002 and 2011 and the actual $6.1 trillion cumulative deficit that occurred, an unfavorable "turnaround" or debt increase of $11.7 trillion. Tax rate cuts and slower-than-expected growth reduced revenues by $6.1 trillion and spending was $5.6 trillion higher. Of this total, the CBO attributes 72% to legislated tax rate cuts and spending increases and 27% to economic and technical factors. Of the latter, 56% occurred from 2009 to 2011.[49][50]
The difference between the projected and actual debt in 2011, the budget office said, could be attributed largely to:
- $3.5 trillion – Economic changes (including lower than expected tax revenues and higher safety net spending due to recession)
- $1.6 trillion – Bush Tax Cuts (EGTRRA and JGTRRA), primarily tax rate cuts but also some smaller spending increases
- $1.5 trillion – Increased non-defense discretionary spending
- $1.4 trillion – Wars in Afghanistan and Iraq
- $1.4 trillion – Incremental interest due to higher debt balances
- $0.9 trillion – Obama stimulus and tax cuts (ARRA and Tax Act of 2010)[50]
The U.S. budget situation has deteriorated significantly since 2001, when the CBO forecast average annual surpluses of approximately $850 billion from 2009 to 2012. The average deficit forecast in each of those years as of June 2009 was approximately $1,215 billion (~$1.68 trillion in 2023). The New York Times analyzed this roughly $2 trillion "swing", separating the causes into four major categories along with their share:
- Recessions or the business cycle (37%);
- Policies enacted by President Bush (33%);
- Policies enacted by President Bush and supported or extended by President Obama (20%); and
- New policies from President Obama (10%).
Several other articles and experts explained the causes of change in the debt position.[51][52][53]
2008 vs. 2009[edit]
In October 2009, the Congressional Budget Office (CBO) gave the reasons for the higher budget deficit in 2009 ($1,410 billion, i.e. $1.41 trillion) over that of 2008 ($460 billion). The major changes included: declines in tax receipt of $320 billion due to the effects of the recession and another $100 billion due to tax rate cuts in the stimulus bill (the American Recovery and Reinvestment Act or ARRA); $245 billion for the Troubled Asset Relief Program (TARP) and other bailout efforts; $100 billion in additional spending for ARRA; and another $185 billion due to increases in primary budget categories such as Medicare, Medicaid, unemployment insurance, Social Security, and Defense – including the war effort in Afghanistan and Iraq. This was the highest budget deficit relative to GDP (9.9%) since 1945.[54] The national debt increased by $1.9 trillion during FY2009, versus the $1.0 trillion increase during 2008.[55]
The Obama Administration also made four significant accounting changes to more accurately report total federal government spending. The four changes were:
- Account for the wars in Iraq and Afghanistan ("overseas military contingencies") in the budget, rather than through supplemental appropriations
- Assume the Alternative Minimum Tax is indexed for inflation;
- Account for the full costs of Medicare reimbursements
- Anticipate inevitable expenditures for natural disaster relief
Obama administration officials predicted that these changes will make the debt over ten years look $2.7 trillion larger than it would otherwise appear.[56]
Historical debt levels[edit]
Gross federal debt[edit]
This table lists the U.S. federal debt as a percentage of gross domestic product, or GDP, each year since World War II.[57] The gross federal debt shown below reached 102.7% of GDP at the end of 2012, the most recent figure available; it was the highest percentage since 1945 and the first yearly percentage figure to go over 100% since then. (The gross federal debt in the table includes intra-government debt – that is, money owed by one branch of the federal government to another. When this latter amount is subtracted, the remaining quantity is known as the public debt.)
| Congressional session | Years | President | President's party | Debt-to-GDP ratio at start of period | Debt-to-GDP ratio at end of period | Change in debt (in billions of dollars) | Change in debt-to-GDP ratio (in percentage points) |
|---|---|---|---|---|---|---|---|
| 77–78 | 1941–1945 | Roosevelt | Democratic | 100% | 117.5% | +203 | +67.1 |
| 79–80 | 1945–1949 | Roosevelt, Truman | Democratic | 117.5% | 93.1% | -8 | -24.4 |
| 81–82 | 1949–1953 | Truman | Democratic | 93.1% | 71.4% | +13 | -21.7 |
| 83–84 | 1953–1957 | Eisenhower | Republican | 71.4% | 60.4% | +6 | -11.0 |
| 85–86 | 1957–1961 | Eisenhower | Republican | 60.4% | 55.2% | +20 | -5.2 |
| 87–88 | 1961–1965 | Kennedy, Johnson | Democratic | 55.2% | 46.9% | +30 | -8.3 |
| 89–90 | 1965–1969 | Johnson | Democratic | 46.9% | 38.6% | +43 | -8.3 |
| 91–92 | 1969–1973 | Nixon | Republican | 38.6% | 35.6% | +101 | -3.0 |
| 93–94 | 1973–1977 | Nixon, Ford | Republican | 35.6% | 35.8% | +177 | +0.2 |
| 95–96 | 1977–1981 | Carter | Democratic | 35.8% | 32.5% | +288 | -3.3 |
| 97–98 | 1981–1985 | Reagan | Republican | 32.5% | 43.8% | +823 | +11.3 |
| 99–100 | 1985–1989 | Reagan | Republican | 43.8% | 53.1% | +1,050 | +9.3 |
| 101–102 | 1989–1993 | Bush Sr. | Republican | 53.1% | 66.1% | +1,483 | +13.0 |
| 103–104 | 1993–1997 | Clinton | Democratic | 66.1% | 65.4% | +1,018 | -0.7 |
| 105–106 | 1997–2001 | Clinton | Democratic | 65.4% | 56.4% | +401 | -9.0 |
| 107–108 | 2001–2005 | Bush | Republican | 56.4% | 63.5% | +2,135 | +7.1 |
| 109–110 | 2005–2009 | Bush | Republican | 63.5% | 84.2% | +3,971 | +20.7 |
| 111–112 | 2009–2013 | Obama | Democratic | 84.2% | 102.7% | +6,061 | +18.5 |
(Source: CBO Historical Budget Page and Whitehouse FY 2012 Budget – Table 7.1 Federal Debt at the End of Year PDF, Excel, Senate.gov)
Notes:
- Some of the debt included in this chart for each presidential administration may include debt added under the next presidential administration.[58]
- For net jobs changes over the corresponding periods, see: Jobs created during U.S. presidential terms.
Publicly held debt[edit]

Publicly held debt is the gross debt minus intra-governmental obligations (such as the money that the government owes to the two Social Security Trust Funds, the Old-Age, Survivors, and Disability Insurance program, and the Social Security Disability Insurance program).[59]
Federal spending, federal debt and GDP[edit]
The table below shows annual federal spending, gross federal debt and gross domestic product for specific fiscal years.[60] The government fiscal year runs from October 1 of the previous calendar year to September 30 of the year shown.
| Fiscal year | Federal spending | Federal debt | Gross domestic product | Inflation adjuster[61] | ||||||
|---|---|---|---|---|---|---|---|---|---|---|
| Billions[62] | Adjusted[63] | Change | Billions[64] | Adjusted[65] | Change | Billions[66] | Adjusted[67] | Change | ||
| 1977 | $409 | $1,040 | $705 | $1,795 | $1,974 | $5,019 | 0.39 | |||
| 1978 | $459 | $1,093 | 5.1% | $776 | $1,850 | 3.1% | $2,217 | $5,285 | 5.3% | 0.42 |
| 1979 | $504 | $1,107 | 1.3% | $829 | $1,821 | −1.5% | $2,501 | $5,494 | 4.0% | 0.46 |
| 1980 | $591 | $1,175 | 6.1% | $909 | $1,808 | −0.8% | $2,727 | $5,422 | −1.3% | 0.50 |
| 1981 | $678 | $1,219 | 3.8% | $994 | $1,787 | −1.1% | $3,055 | $5,492 | 1.3% | 0.56 |
| 1982 | $746 | $1,252 | 2.6% | $1,137 | $1,908 | 6.8% | $3,228 | $5,417 | −1.4% | 0.60 |
| 1983 | $808 | $1,294 | 3.4% | $1,371 | $2,195 | 15.0% | $3,441 | $5,510 | 1.7% | 0.62 |
| 1984 | $852 | $1,300 | 0.4% | $1,564 | $2,386 | 8.7% | $3,840 | $5,858 | 6.3% | 0.66 |
| 1985 | $946 | $1,396 | 7.4% | $1,817 | $2,680 | 12.3% | $4,142 | $6,108 | 4.3% | 0.68 |
| 1986 | $990 | $1,426 | 2.1% | $2,120 | $3,052 | 13.9% | $4,412 | $6,352 | 4.0% | 0.69 |
| 1987 | $1,004 | $1,406 | −1.4% | $2,345 | $3,283 | 7.6% | $4,647 | $6,506 | 2.4% | 0.71 |
| 1988 | $1,065 | $1,447 | 2.9% | $2,601 | $3,534 | 7.7% | $5,009 | $6,806 | 4.6% | 0.74 |
| 1989 | $1,144 | $1,499 | 3.6% | $2,867 | $3,757 | 6.3% | $5,401 | $7,077 | 4.0% | 0.76 |
| 1990 | $1,253 | $1,590 | 6.1% | $3,206 | $4,067 | 8.3% | $5,735 | $7,277 | 2.8% | 0.79 |
| 1991 | $1,324 | $1,610 | 1.3% | $3,598 | $4,374 | 7.5% | $5,935 | $7,215 | −0.8% | 0.82 |
| 1992 | $1,382 | $1,624 | 0.9% | $4,001 | $4,703 | 7.5% | $6,240 | $7,334 | 1.7% | 0.85 |
| 1993 | $1,410 | $1,615 | −0.5% | $4,351 | $4,987 | 6.0% | $6,576 | $7,536 | 2.8% | 0.87 |
| 1994 | $1,462 | $1,642 | 1.7% | $4,643 | $5,216 | 4.6% | $6,961 | $7,820 | 3.8% | 0.89 |
| 1995 | $1,516 | $1,662 | 1.2% | $4,920 | $5,395 | 3.4% | $7,326 | $8,033 | 2.7% | 0.91 |
| 1996 | $1,561 | $1,673 | 0.7% | $5,181 | $5,554 | 3.0% | $7,694 | $8,248 | 2.7% | 0.93 |
| 1997 | $1,601 | $1,684 | 0.7% | $5,369 | $5,647 | 1.7% | $8,182 | $8,606 | 4.3% | 0.95 |
| 1998 | $1,653 | $1,721 | 2.2% | $5,478 | $5,704 | 1.0% | $8,628 | $8,985 | 4.4% | 0.96 |
| 1999 | $1,702 | $1,746 | 1.5% | $5,605 | $5,750 | 0.8% | $9,125 | $9,361 | 4.2% | 0.97 |
| 2000 | $1,789 | $1,789 | 2.5% | $5,628 | $5,628 | −2.1% | $9,710 | $9,710 | 3.7% | 1.00 |
| 2001 | $1,863 | $1,821 | 1.8% | $5,769 | $5,638 | 0.2% | $10,058 | $9,829 | 1.2% | 1.02 |
| 2002 | $2,011 | $1,929 | 6.0% | $6,198 | $5,945 | 5.5% | $10,377 | $9,954 | 1.3% | 1.04 |
| 2003 | $2,160 | $2,018 | 4.6% | $6,760 | $6,316 | 6.2% | $10,809 | $10,099 | 1.4% | 1.07 |
| 2004 | $2,293 | $2,082 | 3.2% | $7,354 | $6,677 | 5.7% | $11,500 | $10,441 | 3.4% | 1.10 |
| 2005 | $2,472 | $2,165 | 4.0% | $7,905 | $6,923 | 3.7% | $12,238 | $10,717 | 2.6% | 1.14 |
| 2006 | $2,655 | $2,249 | 3.9% | $8,451 | $7,158 | 3.4% | $13,016 | $11,024 | 2.9% | 1.18 |
| 2007 | $2,730 | $2,263 | 0.6% | $8,951 | $7,419 | 3.6% | $13,668 | $11,329 | 2.8% | 1.21 |
| 2008 | $2,931 | $2,366 | 4.6% | $9,654 | $7,793 | 5.0% | $14,312 | $11,553 | 0% | 1.24 |
| 2009* | $3,107 | $2,452 | 3.6% | $10,413 | $8,218 | 5.5% | $14,097 | $11,529 | 2.6% | 1.27 |
| 2010* | $3,091 | $2,392 | −2.4% | $11,875 | $9,247 | 12.5% | $14,508 | $11,297 | −2.0% | 1.29 |
Note: The values for the years 2009, and 2010 represent estimates from the source material.
See also[edit]
- First Report on the Public Credit
- United States federal budget
- Starve the beast (policy)
- United States public debt
- United States fiscal cliff
- 2011 U.S. debt ceiling crisis
- Government budget by country
- I.O.U.S.A., documentary film by Patrick Creadon
- Modern Monetary Theory
- Unemployment in the United States
- List of U.S. state budgets
- Continuing resolution
- Appropriations bill (United States)
- Deficit reduction in the United States
Notes[edit]
- ^ "The 2020 Long-Term Budget Outlook | Congressional Budget Office". 21 September 2020.
- ^ "The 2020 Long-Term Budget Outlook | Congressional Budget Office". 21 September 2020.
- ^ Staloff, Darren. 2005. Hamilton, Adams, Jefferson: The Politics of Enlightenment and the American Founding. Hill and Wang, New York. ISBN 0-8090-7784-1. p. 69.
- ^ Miller, John C. 1960. The Federalists: 1789–1801. Harper & Row, New York. ISBN 9781577660316. p. 37.
- ^ Hofstadter, Richard. 1948. The American Political Tradition and the Men Who Made It. New York: A. A. Knopf. p. 125.
- ^ First Report of the Public Credit, issued on January 9, 1790.
- ^ Stelzer, Irwin (January 10, 2011). "Who Is the Euro Zone's Alexander Hamilton?". Wall Street Journal. Agenda. Retrieved January 10, 2011.
- ^ Ellis, Joseph J. (2002). Founding Brothers: The Revolutionary Generation. Vintage. pp. 48–52. ISBN 0-375-70524-4.
- ^ Max M. Edling, "'So immense a power in the affairs of war': Alexander Hamilton and the restoration of public credit." William and Mary Quarterly 64#2 (2007): 287–326. in JSTOR
- ^ Staloff, 2005, pp. 96–97
- ^ Ellis, 2000, p. 73
- ^ Staloff, 2005, pp. 96, 313; Ellis, 2000, pp. 73–74
- ^ Trescott, Paul (1955). "Federal-State Financial Relations, 1790–1860". The Journal of Economic History. 15 (3): 227–45. doi:10.1017/S0022050700057685. JSTOR 2114655. S2CID 153625533.
- ^ a b Smith, Robert (April 15, 2011). "When the U.S. paid off the entire national debt (and why it didn't last)". Planet Money. NPR. Retrieved January 15, 2014.
- ^ "Our History". Bureau of the Public Debt. November 18, 2013. Archived from the original on March 6, 2016. Retrieved February 21, 2016.
- ^ "Bureau of the Public Debt: The 19th Century". Archived from the original on October 9, 2014. Retrieved July 15, 2012.
- ^ Sharockman, Aaron (January 11, 2010). "PolitiFact: Fla. senator says Jan. 8, 1835, is the only day U.S. has been debt free". Retrieved July 15, 2011.
- ^ a b c d "Historical Data on the Federal Debt". Congressional Budget Office. August 5, 2010. Retrieved August 25, 2012.
- ^ "Warren G. Harding US President – 1921–23". Archived from the original on September 27, 2011. Retrieved January 25, 2011.
- ^ Thomas E. Woods, Jr. (October 8, 2009). "Depression of 1920". Archived from the original on October 13, 2009. Retrieved May 13, 2010.
- ^ Davidson, Paul (April 25, 2010). "Making dollars and sense of the U.S. government debt" (PDF). Retrieved December 15, 2015.
- ^ Austin, D. Andrew (April 29, 2008). "CRS Report for Congress" (PDF).
- ^ Heinberg, Richard (August 2011). The End of Growth. New Society Publishers. ISBN 978-0-86571-695-7.
- ^ a b Cooper, Michael; Story, Louise (27 July 2011). "Q. and A. on the U.S. Debt Ceiling". The New York Times. Retrieved 13 March 2017.
- ^ a b "Federal Debt Held by the Public as a Share of GDP (1797–2010)" (PDF). Government Accountability Office. Retrieved April 16, 2012.
- ^ a b c Dennis S. Ippolito. Why Budgets Matter: Budget Policy and American Politics. Penn State Press, 2004. ISBN 978-0-271-02260-4. pp. 185–86
- ^ a b "Congressional Budget Office – Historical Data on the Federal Debt". cbo.gov. 2010. Retrieved January 3, 2012.
- ^ a b Sahadi, Jeanne (September 12, 2010). "Taxes: What people forget about Reagan". CNN Money. Retrieved 2011-08-30.
- ^ "Congressional Budget Office – Historical Data on the Federal Debt". cbo.gov. 2010. Retrieved January 3, 2012.
- ^ FactCheck.org : The Budget and Deficit Under Clinton
- ^ Kessler, Glenn (January 24, 2012). "Fact checking the NBC Florida debate". The Washington Post.
- ^ Kessler, Glenn (July 1, 2011). "Barbara Boxer's blatant rewriting of history". The Washington Post.
- ^ a b Federal Debt: Answers to Frequently Asked Questions: An Update – U.S. Government Accountability Office
- ^ a b United States Department of the Treasury, Bureau of the Public Debt (December 2010). "The debt to the penny and who holds it". TreasuryDirect. Retrieved August 26, 2012.
- ^ "CBO Historical Tables – 1970 to 2010" (PDF). Retrieved May 18, 2011.
- ^ Democracy in America (July 27, 2011). "There never was a surplus". The Economist. Retrieved January 1, 2012.
- ^ "S&P, in historical move, downgrades U.S. credit rating". Xinhua. August 6, 2011. Archived from the original on March 15, 2012. Retrieved August 8, 2011.
- ^ "No credible plan to cut US debt". BBC. August 6, 2011. Retrieved August 8, 2011.
- ^ Fisher, Louis (Nov–Dec 1990). "Federal Budget Doldrums: The Vacuum in Presidential Leadership". Public Administration Review. 50 (6): 693–700. doi:10.2307/976984. JSTOR 976984.
- ^ Brad DeLong (November 20, 2009). "Comparing Debt-to-GDP Ratios with Presidential Terms". Seeking Alpha. Retrieved 2010-08-09.
contrast between the Democrats and the old-style Republicans (Eisenhower and Nixon) on the one hand and the new-style Republicans on the other is quite striking.
- ^ Brad DeLong (May 1, 2008). "Short-Term Costs of Long-Run Fiscal Stupidity – Grasping Reality with Both Hands". Delong.typepad.com. Retrieved 2010-08-09.
- ^ Stockman, David (July 31, 2010). "Four Deformations of the Apocalypse". New York Times. Retrieved 2010-08-09.
- ^ Bartlett, Bruce (May 7, 2011). "Tax Cuts And 'Starving The Beast'". Forbes.com. Retrieved October 22, 2011.
- ^ Bartlett, Bruce (November 26, 2010). "Starve the Beast: Just Bull, not Good Economics". The Fiscal Times. Retrieved 2011-10-22.
- ^ Bartlett, Bruce (April 9, 2009). "We Need A Party of Fiscal Responsibility". Forbes.com. Retrieved 2012-03-14.
- ^ Bartlett, Bruce (June 25, 2010). "A Budget Deal That Did Reduce the Deficit". The Fiscal Times. Retrieved 2012-03-14.
- ^ "Debt to the Penny | U.S. Treasury Fiscal Data". fiscaldata.treasury.gov. Retrieved 2022-09-01.
- ^ "The Budget and Economic Outlook: Fiscal Years 2010 to 2020" (PDF). Congressional Budget Office. January 26, 2010.
- ^ Bartlett, Bruce (June 12, 2012). "The Fiscal Legacy of George W. Bush". The New York Times.
- ^ a b "Changes in CBO's Baseline Projections Since 2001". Congressional Budget Office. June 7, 2012.
- ^ Leonhardt, David (June 9, 2009). "Americas Sea of Red Ink Was Years in the Making". The New York Times. Retrieved May 18, 2011.
- ^ Charlie Rose Show (November 3, 2009). "Peter Orszag Interview". Archived from the original on January 11, 2012. Retrieved May 18, 2011.
- ^ "The Great Debt Shift" (PDF). Pew Charitable Trusts. April 2011. Archived from the original (PDF) on May 5, 2011. Retrieved May 18, 2011.
- ^ "CBO Monthly Budget Review-October 2009" (PDF). October 7, 2009. Retrieved May 18, 2011.
- ^ "Bureau of the Public Debt/Treasury Direct-Debt changes from September 30, 2008 to September 30, 2009". Treasurydirect.gov. Retrieved May 18, 2011.
- ^ Calmes, Jackie (February 20, 2009). "Obama Bans Gimmicks, and Deficit Will Rise". The New York Times. Retrieved May 26, 2010.
- ^ Budget FY2007
- ^ For example, the $862 Billion stimulus of 2009 was passed by Congress under the Obama Administration, but is included in the 2009 debt totals attributed in the chart to George W. Bush.
- ^ Frontline – Ten Trillion and Counting: Defining the Debt
- ^ Budget FY 2009
- ^ Budget FY2009. Addendum: Composite Deflator, p. 26. Divide current dollars by this number to produce value in (constant) FY2000 dollars.
- ^ Budget FY2009. Outlays in current dollars, p. 26.
- ^ Budget FY2009. Outlays in current dollars, p. 26, divided by inflation adjuster.
- ^ Budget FY 2009. Gross Federal Debt in current dollars, p. 127.
- ^ Budget FY 2009. Gross Federal Debt in current dollars, p. 127, divided by inflation adjuster.
- ^ Budget FY2009. GDP (gross domestic product) in current dollars, p. 194.
- ^ Budget FY2009. GDP (gross domestic product) in current dollars, p. 194, divided by inflation adjuster.
References[edit]
- Budget of the United States Government, Fiscal Year 2007.
- Budget of the United States Government, Fiscal Year 2009.
- Budget of the United States Government, Fiscal Year 2012.
External links[edit]
- United States National Debt Tracker, including interactive historical graphs and relationship to GDP.
- Stephen Bloch. "U.S. Federal Deficits and Presidents". home.adelphi.edu. Retrieved August 9, 2010.
- Brad DeLong (November 20, 2009). "Comparing Debt-to-GDP Ratios with Presidential Terms". Seeking Alpha. Retrieved 2010-08-09.
- Brad DeLong (May 1, 2008). "Short-Term Costs of Long-Run Fiscal Stupidity – Grasping Reality with Both Hands". Delong.typepad.com. Retrieved 2010-08-09.
- Scott Willeke (March 2, 2010). "United States Deficit & Debt During Presidents from 1969–2019". Blog.scott.willeke.com. Archived from the original on May 29, 2010. Retrieved 2010-08-09.
- Steve Stoft. "U.S. National Debt Graph: What the Press Won't Tell You". Zfacts.com. Retrieved 2010-08-09.
- Leonhardt, David (15 April 2018). "Democrats are the real fiscal conservatives". The New York Times. Retrieved May 12, 2018.