Ninglang Yi Autonomous County
Ninglang County | |
|---|---|
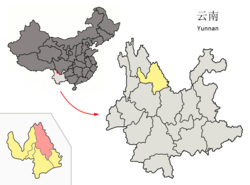
 Location of Ninglang County (pink) and Lijiang prefecture (yellow) within Yunnan province of China | |
| Country | China |
| Province | Yunnan |
| Prefecture | Lijiang City |
| Area | |
| • Total | 6,206 km2 (2,396 sq mi) |
| Population | |
| • Total | 230,000 |
| • Density | 37/km2 (96/sq mi) |
| Postal code | 674300 |
| Area code | 0888 |
| Climate | Cwb |
| Website | http://www.ljs.gov.cn/ |
Ninglang Yi Autonomous County (Chinese: 宁蒗彝族自治县; pinyin: Nínglàng Yízú Zìzhìxiàn; Yi: ꆀꆿꆈꌠꊨꏦꏱꅉꑤ nip lat nuo su zyt jie jux dde xiep) is located in Lijiang City Prefecture, Yunnan, China.
Climate
| Climate data for Ninglang (1981−2010) | |||||||||||||
|---|---|---|---|---|---|---|---|---|---|---|---|---|---|
| Month | Jan | Feb | Mar | Apr | May | Jun | Jul | Aug | Sep | Oct | Nov | Dec | Year |
| Record high °C (°F) | 24.6 (76.3) |
26.7 (80.1) |
27.8 (82.0) |
30.0 (86.0) |
31.4 (88.5) |
30.8 (87.4) |
32.5 (90.5) |
30.6 (87.1) |
29.9 (85.8) |
27.0 (80.6) |
25.3 (77.5) |
23.8 (74.8) |
32.5 (90.5) |
| Mean daily maximum °C (°F) | 15.5 (59.9) |
17.3 (63.1) |
20.2 (68.4) |
22.8 (73.0) |
24.7 (76.5) |
25.2 (77.4) |
24.6 (76.3) |
24.6 (76.3) |
23.2 (73.8) |
21.5 (70.7) |
18.0 (64.4) |
15.6 (60.1) |
21.1 (70.0) |
| Daily mean °C (°F) | 4.1 (39.4) |
6.5 (43.7) |
9.9 (49.8) |
13.3 (55.9) |
17.2 (63.0) |
19.4 (66.9) |
19.1 (66.4) |
18.5 (65.3) |
16.7 (62.1) |
13.4 (56.1) |
8.3 (46.9) |
4.5 (40.1) |
12.6 (54.6) |
| Mean daily minimum °C (°F) | −4.9 (23.2) |
−2.9 (26.8) |
0.7 (33.3) |
4.6 (40.3) |
10.3 (50.5) |
14.7 (58.5) |
15.5 (59.9) |
14.7 (58.5) |
13.0 (55.4) |
8.1 (46.6) |
1.5 (34.7) |
−3.4 (25.9) |
6.0 (42.8) |
| Record low °C (°F) | −9.7 (14.5) |
−9.2 (15.4) |
−6.6 (20.1) |
−2.5 (27.5) |
2.7 (36.9) |
8.5 (47.3) |
8.9 (48.0) |
8.7 (47.7) |
2.2 (36.0) |
−0.9 (30.4) |
−5.7 (21.7) |
−8.4 (16.9) |
−9.7 (14.5) |
| Average precipitation mm (inches) | 4.4 (0.17) |
4.2 (0.17) |
9.4 (0.37) |
18.3 (0.72) |
55.7 (2.19) |
164.1 (6.46) |
241.8 (9.52) |
213.5 (8.41) |
150.4 (5.92) |
58.1 (2.29) |
13.0 (0.51) |
3.2 (0.13) |
936.1 (36.86) |
| Average relative humidity (%) | 60 | 54 | 52 | 56 | 62 | 74 | 82 | 83 | 83 | 79 | 74 | 68 | 69 |
| Source: China Meteorological Data Service Center | |||||||||||||
External links
27°17′02″N 100°51′36″E / 27.28389°N 100.86000°E
