
Fuel economy in aircraft

Aircraft must consume fuel to supply the energy needed to move the vehicles and their passengers. Fuel economy is a measure of how much fuel an aircraft needs to operate, and can be expressed in several ways, for example by the liters of fuel consumed per passenger per kilometer. Aerodynamic drag, which exerts a force on the aircraft in the opposite direction from the velocity, is a principal determinant of energy consumption in aircraft because they operate at such high speeds.
Factors in aircraft fuel economy
.jpg)
Each model of aircraft has a maximum range speed for a given total load (fuel plus payload), which is the speed at which it is most fuel efficient.[1] Flying slower or faster than this optimum speed increases fuel consumption per mile flown. There is an optimum speed for efficiency because the component of drag resulting from airframe skin friction against the air increases at a square function of air speed, but the drag resulting from generating lift decreases with air speed. (These are technically called parasitic drag and induced drag, respectively.)[1] The desirability of a low maximum range speed to reduce environmental and climate impacts is at odds in aircraft design with the benefit from the revenue generated by making the design speed higher thereby increasing the passenger miles flown per day.[2]
Aircraft weight is also a factor in fuel economy, because more lift-generating drag (induced drag) results as weight increases. If the airframe weight is reduced, engines that are smaller and lighter can be used, and for a given range the fuel capacity can be reduced. Thus some weight savings can be compounded for an increase in fuel efficiency. A rule-of-thumb being that a 1% weight reduction corresponds to around a 0.75% reduction in fuel consumption.[3]
Flight altitude affects engine efficiency. Jet-engine efficiency increases with altitude up to the tropopause, the temperature minimum of the atmosphere; at lower temperatures, the engine efficiency is higher.[1] Jet engine efficiency is also increased at high speeds, but above about Mach 0.85 the aerodynamic drag on the airframe overwhelms this effect.
Above that speed, shockwaves begin to form that greatly increase drag. For supersonic flight (Mach 1.0 or higher), fuel consumption is increased tremendously.
Changes in commercial aircraft fuel economy since the 1950s

Modern jet aircraft have twice the fuel efficiency of the earliest jet airliners.[4] Late 1950s piston airliners like the Lockheed L-1049 Super Constellation and DC-7 were 1% to 28% more energy intensive than 1990s jet airliners which cruise 40 to 80% faster.[2] The early jet airliners were designed at a time when air crew labor costs were higher relative to fuel costs than today. Despite the high fuel consumption, because fuel was inexpensive in that era the higher speed resulted in favorable economical returns since crew costs and amortization of capital investment in the aircraft could be spread over more seat miles flown per day.[5]
Today's turboprop airliners have better fuel efficiency than current jet airliners, in part because of their lower cruising speed and propellers that are more efficient than those of the 1950s-era piston-powered airlines.[6] Among major airlines, those with turboprop equipped regional carrier subsidiaries typically rank high in overall fleet fuel efficiency. For example, although Alaska Airlines scored at the top of a 2011-2012 fuel efficiency ranking, if its regional carrier—turbo-prop equipped Horizon Air—were dropped from the consideration, the airline's ranking would be lower.[6]
Jet aircraft efficiency
.jpg)
Jet aircraft efficiency is improving: Between 1960 and 2000 there was a 55% overall fuel efficiency gain (if one were to consider the Boeing 707 as the base case).[2] Most of the improvements in efficiency were gained in the first decade when jet craft first came into widespread commercial use. Between 1971 and 1998 the fleet-average annual improvement per available seat-kilometre was estimated at 2.4%. Nonetheless, from the 1960s to the present total fleet emissions of the greenhouse gas carbon dioxide have outpaced efficiency gains, due to growth in the air travel market.[8]
Concorde the supersonic transport managed about 17 passenger-miles to the Imperial gallon, which is 16.7 L/100 km per passenger; similar to a business jet, but much worse than a subsonic turbofan aircraft. Airbus states a fuel rate consumption of their A380 at less than 3 L/100 km per passenger (78 passenger-miles per US gallon),[9] however this is for an unspecified number and configuration of seats. The maximum configuration is 850 economy passengers, but with a typical 525-seat multi-class configuration the fuel consumption is "comparable to that of a B747-400 ER and even about 15% worse than a B777-300ER on a passenger-mile basis."[10]
Weight effect
The 84t maximum payload of a modern Airbus A380 represents 14.6% of its 575t maximum take-off weight. There remains considerable room for future improvements in fuel efficiency. The weight of an aircraft can be reduced by using light-weight materials such as titanium, carbon fiber and other composite plastics. Expensive materials may be used, if the reduction of mass justifies the price of materials through improved fuel efficiency. The improvements achieved in fuel efficiency by mass reduction, reduce the amount of fuel an aircraft must carry. This further reduces the mass of the aircraft, and therefore provides further gains in fuel efficiency. For example, the Airbus A380 design includes multiple light-weight materials. The Boeing 787 Dreamliner was the first major commercial airplane to have a composite fuselage, composite wings, and use composites in most other airframe components.[11]
Very long non-stop flights suffer from the weight penalty of the large quantity of fuel required, limiting the number of available seats to compensate. For such flights, the critical fiscal factor is the quantity of fuel burnt per seat-nautical mile.[12] For these reasons the world's longest commercial flights were cancelled circa 2013. An example is Singapore Air's former New York to Singapore flight, which could carry only 100 passengers (all business class) on the 10,300 mile flight. According to an industry analyst, "It [was] pretty much a fuel tanker in the air."[13]
Aerodynamics

Airbus has showcased wingtip devices (sharklets or winglets) that can achieve 3.5 percent reduction in fuel consumption.[14][15] There are wingtip devices on the Airbus A380. Further developed Minix winglets have been said to offer 6 percent reduction in fuel consumption.[16] Winglets at the tip of an aircraft wing, can be retrofitted to any airplane, and smooths out the wing-tip vortex, reducing the aircraft's wing drag.[16]
NASA and Boeing are conducting tests on a 500 lb (230 kg) "blended wing" aircraft. This design provides greater fuel efficiency, since the whole craft produces lift, not just the wings.[17] The blended wing body (BWB) concept offers advantages in structural, aerodynamic and operating efficiencies over today's more conventional fuselage-and-wing designs. These features translate into greater range, fuel economy, reliability and life cycle savings, as well as lower manufacturing costs.[18][19] NASA has created a cruise efficient STOL (CESTOL) concept.
Fraunhofer Institute for Manufacturing Engineering and Applied Materials Research (IFAM) have researched a shark skin imitating paint that would reduce drag through a riblet effect.[20] Aircraft is a major potential application for new technologies such as aluminium metal foam and nanotechnology such as the shark skin imitating paint.
Multiple concepts are projected to reduce fuel consumption:[21]
- the Airbus/Rolls-Royce E-Thrust is an hybrid electric with a gas turbine engine and electric ducted fans with energy storage for peak power for takeoff and climb while for the descent the engine is shut down and the fans windmills to recharge the batteries;
- Empirical Systems Aerospace (ESAero) develop the 150-seat ECO-150 concept for turboelectric distributed propulsion with two turboshaft engines mounted on the wing and driving generators powering ducted fans embedded in the inboard wing sections, effectively increasing the bypass ratio and propulsive efficiency for 20-30% fuel savings over the Boeing 737 NG, while providing some powered lift;
- NASA’s single-aisle turbo-electric aircraft with an aft boundary layer propulsor (STARC-ABL) is a conventional tube and wing 737-sized airliner with an aft-mounted electric fan ingesting the fuselage boundary layer hybrid-electric propulsion;
- The Boeing blended wing body (BWB) with a wide fuselage mated to a high-aspect-ratio wings is more aerodynamically efficient because the entire aircraft contributes to the lift and because it has less surface area, producing less drag and offering weight savings due to lower wing loading, and noise is shielded by locating the engines on the aft upper surface;
- Developed with the U.S. Air Force Research Laboratory and refined with NASA, the Lockheed Martin Hybrid Wing Body (HWB) combines a blended forward fuselage and wing with a conventional aft fuselage and T-tail for compatibility with existing infrastructure and airdrop; the engines in overwing nacelles on struts over the trailing edge enable higher-bypass-ratio engines with 5% less drag, provide acoustic shielding and increases lift without a thrust or drag penalty at low speed;
- Airbus-backed, German Bauhaus-Luftfahrt designed the Propulsive Fuselage concept reducing drag with a fan in the tail ingesting air flowing over the fuselage via an annular inlet and re-energizes the wake, driven with a gearbox or as a turbo-electric configuration;
- Conceived by the Massachusetts Institute of Technology for NASA, Aurora Flight Sciences develop the double-bubble D8, a 180-seat aircraft with a wide lifting fuselage, twin-aisle cabin to replace A320 and B737 narrowbodies, and boundary-layer ingestion with engines in the tail driving distortion-tolerant fans for a 49% fuel-burn reduction over the B737NG;
- The Boeing Truss-Braced wing (TBW) concept was developed for the NASA-funded Subsonic Ultra Green Aircraft Research program with an aspect ratio of 19.5 compared to 11 for the Boeing 787: the strut relieves some bending moment and a braced wing can be lighter than a cantilevered wing or longer for the same weight, having better lift-to-drag ratio by lowering the induced drag and thinner, facilitating natural laminar flow and reducing wave drag at transonic speeds;
- Dzyne Technologies reduces the thickness of the blended wing body for a 110-130-seat super-regional, a configuration usually too thick for a narrowbody replacement and better suited for large aircraft, by placing the landing gear outward and storing baggage in the wing roots, enabling 20% fuel savings;
- the French research agency ONERA designed two concepts for a 180-seat airliner Versitalie Aircraft (NOVA) including turbofans with higher bypass ratios and fan diameter: a gull wing with increased dihedral inboard to accommodate larger geared turbofans under without lengthening the gear and the other with engines embedded in the tail ingesting the low-energy fuselage boundary layer flow and reenergize the wake to reduce drag;
- with Cranfield University, Rolls-Royce developed the Distributed Open Rotor (DORA) with high-aspect-ratio wing and V-tail to minimize drag, and turbogenerators on the wing driving electric propellers along the inboard leading edge with open rotor high propulsive efficiency and increasing the effective bypass ratio.
Fuel consumption factors
.jpg)
To save fuel, Simon Weselby presented the following measures while flying, in his example of an A330 flying 2,500 nautical miles (4,600 km) like Bangkok-Tokyo:[22]
- direct routing: 40 km (25 mi) less distance saves 190 kg (420 lb) fuel
- vertical flight profile optimization: fly 600 m (2,000 ft) below optimum altitude, 600 kg (1,300 lb) more fuel consumed
- cruising speed: 0.01 mach above optimum, 800 kg (1,800 lb) more fuel consumed
- aircraft weight: 1,000 kg (2,200 lb) more fuel on board, 150 kg (330 lb) more fuel consumed. 100 litres (22 imp gal; 26 US gal) of unused potable water, 15 kg (33 lb) more fuel consumed.
Also operational procedures can save fuel:[22]
- 10 minutes less APU use, 35 kg (77 lb) fuel saved
- reduced flap approach, 15 kg (33 lb) fuel saved
- reduced thrust reversal, 30 kg (66 lb) fuel saved
Maintenance saves fuel as well:[22]
- no engine wash schedule: 100 kg (220 lb) more fuel consumed
- slat rigging, 5 mm (0.20 in) gap, 50 kg (110 lb) more fuel consumed
- spoiler rigging, 10 mm (0.39 in) gap, 40 kg (88 lb) more fuel consumed
- damaged door seal, 15 kg (33 lb) more fuel consumed
Propellers versus jets

Propfans are a more fuel efficient technology than jets or turboprops, but turboprops have an optimum speed below about 450 mph (700 km/h).[23] This speed is less than used with jets by major airlines today. However, the decrease in speed reduces drag. With the current [needs update] high price for jet fuel and the emphasis on engine/airframe efficiency to reduce emissions, there is renewed interest in the propfan concept for jetliners that might come into service beyond the Boeing 787 and Airbus A350XWB. For instance, Airbus has patented aircraft designs with twin rear-mounted counter-rotating propfans.[24] NASA has conducted an Advanced Turboprop Project (ATP), where they researched a variable pitch propfan that produced less noise and achieved high speeds.
For private aircraft in general aviation, the current record is 37 km/kg fuel or 3.7 L/100 km in a Monnett Sonerai.[25]
Related to fuel efficiency is the impact of aviation emissions on climate.
Range
For very long haul flights, the airplane is heavier to transport additional fuel, leading to a higher fuel consumption. Above a certain distance, it becomes more fuel efficient to make a halfway stop to refuel even if it leads to an additional less efficient descent and climb. For example, for a Boeing 777-300 the tipping point is at 3,000 nautical miles (5,600 km) : it is more fuel efficient to make a non-stop flight below this distance and to make a stop above.[26]

Airline fuel efficiency
.jpg)
Fuel economy in air transport comes from aircraft fuel efficiency combined with airlines efficiency : seating configuration, passenger load factor and air cargo. For instance, over the transatlantic route, the most active intercontinental market, in 2014 the average fuel consumption was 32 pax-km per L - 3.13 litres per 100 kilometres (75 mpg‑US) per passenger. The most fuel efficient airline was Norwegian Air Shuttle with 40 pax-km/L - 2.5 litres per 100 kilometres (94 mpg‑US) per passenger, thanks to its fuel efficient Boeing 787-8, a high 86% passenger load factor and a high density of 1.18 seat/m² due to a low 11% premium seating. On the other side, the least efficient was British Airways at 27 pax-km/L - 3.7 litres per 100 kilometres (64 mpg‑US) per passenger, using fuel inefficient Boeing 747-400s with a low density of 0.79 seat/m² due to a high 24% premium seating, in spite of a high 83% load factor.[27]
Research projects such as Boeing's ecoDemonstrator program have sought to identify ways of improving the fuel economy of commercial aircraft operations. The U.S. government has encouraged such research through grant programs, including the FAA's Continuous Lower Energy, Emissions and Noise (CLEEN) program, and NASA's Environmentally Responsible Aviation (ERA) Project.[citation needed]
Example values
300 nautical miles (560 km)
| model | first flight | seats | Fuel burn | Fuel per seat |
|---|---|---|---|---|
| ATR 42-500 | 1995 | 48 | 1.26 kg/km (4.5 lb/mi) | 3.07 L/100 km (77 mpg‑US)[28] |
| ATR 72-500 | 1997 | 70 | 1.42 kg/km (5.0 lb/mi) | 2.47 L/100 km (95 mpg‑US)[28] |
| Beechcraft 1900D (226nm) | 1982 | 19 | 1.00 kg/km (3.56 lb/mi) | 6.48 L/100 km (36.3 mpg‑US)[29] |
| Bombardier Dash 8 Q400 | 1998 | 78 | 2.16 kg/km (7.7 lb/mi) | 3.38 L/100 km (70 mpg‑US)[30] |
| Dornier 228 | 1981 | 19 | 0.94 kg/km (3.3 lb/mi) | 6.06 L/100 km (38.8 mpg‑US)[31] |
| Dornier 328 | 1991 | 30 | 1.10 kg/km (3.91 lb/mi) | 4.51 L/100 km (52.2 mpg‑US)[32] |
| Embraer Brasilia | 1983 | 30 | 0.92 kg/km (3.3 lb/mi) | 3.82 L/100 km (61.6 mpg‑US)[33] |
| Pilatus PC-12 (500 nm) | 1991 | 9 | 0.41 kg/km (1.5 lb/mi) | 5.66 L/100 km (41.6 mpg‑US)[34] |
| Saab 340 | 1983 | 32 | 1.1 kg/km (3.9 lb/mi) | 4.29 L/100 km (54.8 mpg‑US)[35]
|
| Saab 2000 | 1992 | 50 | 1.75 kg/km (6.2 lb/mi) | 4.39 L/100 km (53.6 mpg‑US)[36] |
500–660 nautical miles (930–1,220 km)
| model | first flight | seats | sector | Fuel burn | Fuel efficiency per seat |
|---|---|---|---|---|---|
| Airbus A319neo | 2015 | 144 | 600 nmi (1,100 km) | 2.93 kg/km (10.4 lb/mi) | 2.04 L/100 km (115 mpg‑US)[37] |
| Airbus A319neo | 2015 | 124 | 660 nmi (1,220 km) | 2.85 kg/km (10.1 lb/mi) | 2.82 L/100 km (83.5 mpg‑US)[38] |
| Airbus A320neo | 2015 | 154 | 660 nmi (1,220 km) | 2.82 kg/km (10 lb/mi) | 2.25 L/100 km (104.7 mpg‑US)[38] |
| Airbus A321neo | 2015 | 192 | 660 nmi (1,220 km) | 3.35 kg/km (11.9 lb/mi) | 2.19 L/100 km (107.4 mpg‑US)[38] |
| Boeing 737-300 | 1984 | 126 | 507 nmi (939 km) | 3.55 kg/km (12.6 lb/mi) | 3.46 L/100 km (68 mpg‑US)[39] |
| Boeing 737-600 | 1998 | 110 | 500 nmi (930 km) | 3.16 kg/km (11.2 lb/mi) | 3.5 L/100 km (67 mpg‑US)[40] |
| Boeing 737-700 | 1997 | 126 | 500 nmi (930 km) | 3.21 kg/km (11.4 lb/mi) | 3.11 L/100 km (76 mpg‑US)[40] |
| Boeing 737 MAX 7 | 2017 | 128 | 660 nmi (1,220 km) | 2.90 kg/km (10.3 lb/mi) | 2.77 L/100 km (84.8 mpg‑US)[38] |
| Boeing 737 MAX 7 | 2017 | 144 | 600 nmi (1,100 km) | 2.94 kg/km (10.4 lb/mi) | 2.04 L/100 km (115 mpg‑US)[37] |
| Boeing 737-800 | 1997 | 162 | 500 nmi (930 km) | 3.59 kg/km (12.7 lb/mi) | 2.7 L/100 km (87 mpg‑US)[40] |
| Boeing 737 MAX 8 | 2017 | 166 | 660 nmi (1,220 km) | 3.07 kg/km (10.9 lb/mi) | 2.28 L/100 km (103.2 mpg‑US)[38] |
| Boeing 737-900ER | 2006 | 180 | 500 nmi (930 km) | 3.83 kg/km (13.6 lb/mi) | 2.59 L/100 km (91 mpg‑US)[40] |
| Boeing 737 MAX 9 | 2017 | 180 | 660 nmi (1,220 km) | 3.35 kg/km (11.9 lb/mi) | 2.3 L/100 km (103 mpg‑US)[38] |
| Boeing 757-200 | 1982 | 200 | 500 nmi (930 km) | 4.68 kg/km (16.61 lb/mi) | 2.91 L/100 km (80.7 mpg‑US)[41] |
| Boeing 757-300 | 1998 | 243 | 500 nmi (930 km) | 5.19 kg/km (18.41 lb/mi) | 2.66 L/100 km (88.4 mpg‑US)[41] |
| Bombardier CRJ1000 | 2009 | 100 | 500 nmi (930 km) | 2.73 kg/km (9.7 lb/mi) | 3.33 L/100 km (71 mpg‑US) [42] |
| Bombardier CSeries 100 | 2013 | 115 | 600 nmi (1,100 km) | 2.46 kg/km (8.7 lb/mi) | 2.14 L/100 km (110 mpg‑US)[37] |
| Bombardier CSeries 300 | 2015 | 140 | 600 nmi (1,100 km) | 2.68 kg/km (9.5 lb/mi) | 1.92 L/100 km (123 mpg‑US)[37] |
| Bombardier Dash 8 Q400 | 1998 | 82 | 600 nmi (1,100 km) | 1.83 kg/km (6.5 lb/mi) | 2.72 L/100 km (86 mpg‑US)[43] |
| Embraer E-Jet E2-175 | 2020 | 88 | 600 nmi (1,100 km) | 2.11 kg/km (7.5 lb/mi) | 2.4 L/100 km (98 mpg‑US)[37] |
| Embraer E-Jet E2-190 | 2018 | 106 | 600 nmi (1,100 km) | 2.45 kg/km (8.7 lb/mi) | 2.32 L/100 km (101 mpg‑US)[37] |
| Embraer E-Jet E2-195 | 2019 | 132 | 600 nmi (1,100 km) | 2.67 kg/km (9.5 lb/mi) | 2.03 L/100 km (116 mpg‑US)[37] |
| Embraer E-Jet-190 | 2002 | 98 | 500 nmi (930 km) | 2.98 kg/km (10.6 lb/mi) | 3.81 L/100 km (61.7 mpg‑US)[44] |
| Saab 340 | 1983 | 31 | 500 nmi (930 km) | 0.95 kg/km (3.4 lb/mi) | 3.83 L/100 km (61.4 mpg‑US)[35] |
| Saab 2000 | 1992 | 50 | 500 nmi (930 km) | 1.54 kg/km (5.5 lb/mi) | 3.85 L/100 km (61.1 mpg‑US)[36] |
| Sukhoi SSJ100 | 2008 | 98 | 500 nmi (930 km) | 2.81 kg/km (10.0 lb/mi) | 3.59 L/100 km (65.5 mpg‑US)[44] |
1,000 nautical miles (1,900 km)
| model | first flight | seats | Fuel Burn | Fuel efficiency per seat |
|---|---|---|---|---|
| Airbus A319 | 1995 | 124 | 2.99 kg/km (10.6 lb/mi) | 2.95 L/100 km (80 mpg‑US)[45] |
| Airbus A319Neo | 2015 | 136 | 2.46 kg/km (8.73 lb/mi) | 1.93 L/100 km (122 mpg‑US)[7] |
| Airbus A320 | 1987 | 150 | 3.18 kg/km (11.3 lb/mi) | 2.61 L/100 km (90 mpg‑US)[45] |
| Airbus A321-200 | 1996 | 180 | 3.66 kg/km (13 lb/mi) | 2.5 L/100 km (94 mpg‑US)[45] |
| Airbus A330-200 | 1997 | 293 | 5.66 kg/km (20.09 lb/mi) | 2.37 L/100 km (99 mpg‑US)[45] |
| Boeing 737-600 | 1998 | 110 | 2.78 kg/km (9.9 lb/mi) | 3.08 L/100 km (76 mpg‑US)[40] |
| Boeing 737-700 | 1997 | 126 | 2.82 kg/km (10.0 lb/mi) | 2.73 L/100 km (86 mpg‑US)[40] |
| Boeing 737-700 | 1997 | 128 | 2.83 kg/km (10.05 lb/mi) | 2.71 L/100 km (87 mpg‑US)[45] |
| Boeing 737 MAX-7 | 2017 | 140 | 2.55 kg/km (9.04 lb/mi) | 1.94 L/100 km (121 mpg‑US)[7] |
| Boeing 737-800 | 1997 | 162 | 3.17 kg/km (11.2 lb/mi) | 2.38 L/100 km (99 mpg‑US)[40] |
| Boeing 737-800 | 1997 | 160 | 3.50 kg/km (12.41 lb/mi) | 2.68 L/100 km (88 mpg‑US)[45] |
| Boeing 737-800W | 1997 | 162 | 3.18 kg/km (11.3 lb/mi) | 2.39 L/100 km (98 mpg‑US)[46] |
| Boeing 737 MAX-8 | 2017 | 162 | 2.71 kg/km (9.6 lb/mi) | 2.04 L/100 km (115 mpg‑US)[46] |
| Boeing 737-900ER | 2006 | 180 | 3.42 kg/km (12.1 lb/mi) | 2.32 L/100 km (101 mpg‑US)[40] |
| Boeing 737-900ERW | 2006 | 180 | 3.42 kg/km (12.1 lb/mi) | 2.31 L/100 km (102 mpg‑US)[46] |
| Boeing 737 MAX-9 | 2017 | 180 | 2.91 kg/km (10.3 lb/mi) | 1.97 L/100 km (119 mpg‑US)[46] |
| Boeing 757-200 | 1982 | 190 | 4.67 kg/km (16.57 lb/mi) | 3.02 L/100 km (78 mpg‑US)[45] |
| Boeing 757-200 | 1982 | 200 | 4.16 kg/km (14.76 lb/mi) | 2.59 L/100 km (90.8 mpg‑US)[41] |
| Boeing 757-300 | 1998 | 243 | 4.68 kg/km (16.62 lb/mi) | 2.4 L/100 km (98 mpg‑US)[41] |
| Bombardier CS300 | 2015 | 135 | 2.34 kg/km (8.3 lb/mi) | 1.85 L/100 km (127 mpg‑US)[7] |
| Quest Kodiak | 2004 | 9 | 0.71 kg/km (2.52 lb/mi) | 6.28 L/100 km (37.5 mpg‑US)[47] |
2,160–3,000 nautical miles (4,000–5,560 km)
3,000 nautical miles (5,600 km) is typically transatlantic, e.g. New York JFK - London-Heathrow [48]
| model | first flight | seats | sector | Fuel burn | Fuel per seat |
|---|---|---|---|---|---|
| Airbus A320 | 1987 | 150 | 2,151 nmi (3,984 km) | 2.91 kg/km (10.3 lb/mi) | 2.43 L/100 km (97 mpg‑US)[49] |
| Airbus A321NeoLR | 2016 | 154 | 3,400 nmi (6,300 km) | 2.99 kg/km (10.6 lb/mi) | 2.41 L/100 km (98 mpg‑US)[50] |
| Airbus A330-200 | 1997 | 241 | 3,000 nmi (5,600 km) | 6.03 kg/km (21.4 lb/mi) | 3.11 L/100 km (76 mpg‑US)[51] |
| Airbus A330-300 | 1992 | 262 | 3,000 nmi (5,600 km) | 6.28 kg/km (22.3 lb/mi) | 2.98 L/100 km (79 mpg‑US)[51] |
| Airbus A330neo-900 | 2016 | 310 | 3,350 nmi (6,200 km) | 6.03 kg/km (21.4 lb/mi) | 2.42 L/100 km (97 mpg‑US)[52] |
| Airbus A340-300 | 1992 | 262 | 3,000 nmi (5,600 km) | 6.85 kg/km (24.3 lb/mi) | 3.25 L/100 km (72 mpg‑US)[51] |
| Boeing 737 MAX-8 | 2017 | 168 | 3,400 nmi (6,300 km) | 2.86 kg/km (10.1 lb/mi) | 2.13 L/100 km (110 mpg‑US)[53] |
| Boeing 737 MAX-9 | 2017 | 144 | 3,400 nmi (6,300 km) | 2.91 kg/km (10.3 lb/mi) | 2.51 L/100 km (94 mpg‑US)[50] |
| Boeing 747-400 | 1988 | 416 | 2,151 nmi (3,984 km) | 10.77 kg/km (38.2 lb/mi) | 3.24 L/100 km (73 mpg‑US)[49] |
| Boeing 747-8 | 2011 | 467 | 3,000 nmi (5,600 km) | 9.9 kg/km (35 lb/mi) | 2.59 L/100 km (91 mpg‑US)[54] |
| Boeing 757-200W | 1981 | 158 | 3,400 nmi (6,300 km) | 3.79 kg/km (13.4 lb/mi) | 2.99 L/100 km (79 mpg‑US)[50] |
| Boeing 767-200ER | 1984 | 181 | 3,000 nmi (5,600 km) | 4.83 kg/km (17.1 lb/mi) | 3.32 L/100 km (71 mpg‑US)[55] |
| Boeing 767-200ER | 1984 | 193 | 3,400 nmi (6,300 km) | 5.01 kg/km (17.8 lb/mi) | 3.23 L/100 km (73 mpg‑US)[50] |
| Boeing 767-200ER | 1984 | 224 | 3,000 nmi (5,600 km) | 4.93 kg/km (17.5 lb/mi) | 2.74 L/100 km (86 mpg‑US)[55] |
| Boeing 767-300ER | 1988 | 218 | 2,151 nmi (3,984 km) | 5.38 kg/km (19.1 lb/mi) | 3.09 L/100 km (76 mpg‑US)[49] |
| Boeing 767-300ER | 1988 | 218 | 3,000 nmi (5,600 km) | 5.39 kg/km (19.1 lb/mi) | 3.07 L/100 km (77 mpg‑US)[55] |
| Boeing 767-300ER | 1988 | 269 | 3,000 nmi (5,600 km) | 5.51 kg/km (19.5 lb/mi) | 2.55 L/100 km (92 mpg‑US)[55] |
| Boeing 767-400ER | 1999 | 245 | 3,000 nmi (5,600 km) | 5.78 kg/km (20.5 lb/mi) | 2.93 L/100 km (80 mpg‑US)[55] |
| Boeing 767-400ER | 1999 | 304 | 3,000 nmi (5,600 km) | 5.93 kg/km (21.0 lb/mi) | 2.42 L/100 km (97 mpg‑US)[55] |
| Boeing 767-400ER | 1999 | 304 | 3,265 nmi (6,047 km) | 6.00 kg/km (21.3 lb/mi) | 2.43 L/100 km (96.9 mpg‑US)[39] |
| Boeing 777-200 | 1994 | 305 | 3,000 nmi (5,600 km) | 6.83 kg/km (24.2 lb/mi) | 2.73 L/100 km (86 mpg‑US)[56] |
| Boeing 777-200ER | 1996 | 301 | 3,000 nmi (5,600 km) | 6.99 kg/km (24.8 lb/mi) | 2.89 L/100 km (81 mpg‑US)[51] |
| Boeing 777-300 | 1997 | 368 | 3,000 nmi (5,600 km) | 7.88 kg/km (28.0 lb/mi) | 2.61 L/100 km (90 mpg‑US)[56] |
| Boeing 787-8 | 2009 | 291 | 3,400 nmi (6,300 km) | 5.26 kg/km (18.7 lb/mi) | 2.26 L/100 km (104 mpg‑US)[53] |
| Boeing 787-8 | 2009 | 238 | 3,400 nmi (6,300 km) | 5.11 kg/km (18.1 lb/mi) | 2.67 L/100 km (88 mpg‑US)[50] |
| Boeing 787-9 | 2013 | 304 | 3,350 nmi (6,200 km) | 5.8 kg/km (21 lb/mi) | 2.37 L/100 km (99 mpg‑US)[52] |
5,000–7,600 nautical miles (9,300–14,100 km)
6,000 nautical miles (11,000 km) is typically transpacific, e.g. Hong kong international - San Francisco Intl[57]
| model | first flight | seats | sector | Fuel burn | Fuel per seat |
|---|---|---|---|---|---|
| Airbus A330-200 | 1997 | 241 | 6,000 nmi (11,000 km) | 6.48 kg/km (23.0 lb/mi) | 3.32 L/100 km (71 mpg‑US)[51] |
| Airbus A330neo-800 | 2017 | 248 | 4,650 nmi (8,610 km) | 5.52 kg/km (19.6 lb/mi) | 2.75 L/100 km (86 mpg‑US)[58] |
| Airbus A330neo-900 | 2017 | 300 | 4,650 nmi (8,610 km) | 6.02 kg/km (21.4 lb/mi) | 2.48 L/100 km (95 mpg‑US)[58] |
| Airbus A340-300 | 1992 | 262 | 6,000 nmi (11,000 km) | 7.41 kg/km (26.3 lb/mi) | 3.49 L/100 km (67.4 mpg‑US)[51] |
| Airbus A350-900 | 2013 | 315 | 4,972 nmi (9,208 km) | 6.11 kg/km (21.7 lb/mi) | 2.39 L/100 km (98 mpg‑US)[52] |
| Airbus A350-900 | 2013 | 315 | 6,542 nmi (12,116 km) | 7.07 kg/km (25.1 lb/mi) | 2.86 L/100 km (82 mpg‑US)[59] |
| Airbus A380 | 2005 | 525 | 7,200 nmi (13,300 km) | 13.78 kg/km (48.9 lb/mi) | 3.27 L/100 km (72 mpg‑US)[60] |
| Airbus A380 | 2005 | 544 | 6,000 nmi (11,000 km) | 13.78 kg/km (48.9 lb/mi) | 3.16 L/100 km (74 mpg‑US)[61] |
| Boeing 747-400 | 1988 | 416 | 6,000 nmi (11,000 km) | 11.11 kg/km (39.4 lb/mi) | 3.26 L/100 km (72 mpg‑US)[62] |
| Boeing 747-8 | 2011 | 467 | 6,000 nmi (11,000 km) | 10.54 kg/km (37.4 lb/mi) | 2.75 L/100 km (86 mpg‑US)[54] |
| Boeing 747-8 | 2011 | 405 | 7,200 nmi (13,300 km) | 10.9 kg/km (39 lb/mi) | 3.35 L/100 km (70 mpg‑US)[60] |
| Boeing 777-200ER | 1996 | 301 | 6,000 nmi (11,000 km) | 7.51 kg/km (26.6 lb/mi) | 3.08 L/100 km (76 mpg‑US)[51] |
| Boeing 777-200ER | 1996 | 301 | 6,000 nmi (11,000 km) | 7.44 kg/km (26.4 lb/mi) | 3.01 L/100 km (78 mpg‑US)[56] |
| Boeing 777-200LR | 2005 | 291 | 4,972 nmi (9,208 km) | 7.66 kg/km (27.2 lb/mi) | 3.25 L/100 km (72 mpg‑US)[52] |
| Boeing 777-300ER | 2003 | 365 | 6,000 nmi (11,000 km) | 8.49 kg/km (30.1 lb/mi) | 2.84 L/100 km (83 mpg‑US)[56] |
| Boeing 777-300ER | 2003 | 344 | 7,200 nmi (13,300 km) | 8.58 kg/km (30.4 lb/mi) | 3.11 L/100 km (76 mpg‑US)[60] |
| Boeing 777-9X | 2020 | 395 | 7,200 nmi (13,300 km) | 9.04 kg/km (32.1 lb/mi) | 2.85 L/100 km (83 mpg‑US)[60] |
| Boeing 787-8 | 2011 | 243 | 4,650 nmi (8,610 km) | 5.45 kg/km (19.3 lb/mi) | 2.77 L/100 km (85 mpg‑US)[58] |
| Boeing 787-9 | 2013 | 294 | 4,650 nmi (8,610 km) | 5.93 kg/km (21.0 lb/mi) | 2.49 L/100 km (94 mpg‑US)[58] |
| Boeing 787-9 | 2013 | 304 | 4,972 nmi (9,208 km) | 5.7 kg/km (20 lb/mi) | 2.31 L/100 km (102 mpg‑US)[52] |
| Boeing 787-9 | 2013 | 291 | 6,542 nmi (12,116 km) | 7.18 kg/km (25.5 lb/mi) | 3.14 L/100 km (75 mpg‑US)[59] |
For comparison, a Volvo Buses 9700 averages 0.41 litres per 100 kilometres (570 mpg‑US) per seat for 63 seats.[63] In highway travel an average auto has the potential for 1.61 litres per 100 kilometres (146 mpg‑US)[64] per seat (assuming 4 seats) and for a 5-seat 2014 Toyota Prius, 0.98 litres per 100 kilometres (240 mpg‑US).[65] While this shows the capabilities of the vehicles, the load factors (percentage of seats occupied) may differ between personal use (commonly just the driver in the car) and societal averages for long-distance auto use, and among those of particular airlines.
See also
- Energy efficiency in transportation
- James Albright (February 27, 2016). "Getting the Most Miles from Your Jet-A". Business & Commercial Aviation. Aviation Week.
References
- ^ a b "Drag". Skybrary. Retrieved June 8, 2014.
- ^ a b c Peeters, P. M.; Middel, J.; Hoolhorst, A. (2005). "Fuel efficiency of commercial aircraft: An overview of historical and future trends" (PDF). National Aerospace Laboratory. Retrieved July 6, 2014.
- ^ Barney L. Capehart (2007). Encyclopedia of Energy Engineering and Technology. Vol. 1. CRC Press. ISBN 978-0-8493-3653-9.
- ^ "Efficiency Trends for New Commercial Jet Aircraft, 1960 to 2008" (PDF). The International Council on Clean Transportation. November 2009.
- ^ Brian M. Yutko and R. John Hansman (May 2011). "Approaches to Representing Aircraft Fuel Efficiency. Performance for the Purpose of a Commercial Aircraft" (PDF). MIT International Center for Air Transportation.
- ^ a b Irene Kwan (June 3, 2014). "Back to the Future: Return of the Turboprop?". The International Council on Clean Transport.
- ^ a b c d "CS300 first flight Wednesday, direct challenge to 737-7 and A319neo". Leeham News. February 25, 2015.
- ^ Peeters, Kutzner & Cohen (2016). Are technology myths stalling aviation climate policy?. At 4-5.
- ^ "The A380: The future of flying". Airbus. Archived from the original on December 14, 2007. Retrieved 2008-03-22.
{{cite web}}: Unknown parameter|deadurl=ignored (|url-status=suggested) (help) - ^ Inflight Luxury: Who Really Pays?, Irene Kwan, ICCT. 30 May 2014.
- ^ Marsh, George (April 8, 2014). "Composites flying high (Part 1)". Materials Today. Retrieved May 23, 2015.
- ^ Park Y., O'Kelly M.E. (2014). Fuel burn rates of commercial passenger aircraft: variations by seat configuration and stage distance. Jrnl. Transp. Geog., 41:pp.137-147.
- ^ Why the Longest Nonstop Flights Are Ending, Bloomberg Bus., 31 Oct. 2013.
- ^ "'Shark fin' wings give airline chiefs something to smile about". NZ Herald News. November 17, 2009. Retrieved September 29, 2012.
- ^ "A320 plane shark fins small winglets successfully completed the first flight test". Ylcrafts.com. Retrieved September 29, 2012.
- ^ a b "Minix wing tip device promises 6% gain in fuel efficiency for airliners". Gizmag.com. Retrieved September 29, 2012.
- ^ Hank Green (October 8, 2007). "Fuel Efficient Plane Prototype Hits Skies". Ecogeek. Retrieved July 6, 2014.
- ^ Tom Koehler (October 27, 2006). "Boeing to Begin Ground Testing of X-48B Blended Wing Body Concept" (Press release). Boeing. Retrieved April 10, 2012.
- ^ Philip Lorenz III (July 3, 2007). "AEDC testing brings unique blended wing aircraft closer to flight". Arnold Air Force Base. Archived from the original on July 14, 2014. Retrieved April 10, 2012.
{{cite web}}: Unknown parameter|deadurl=ignored (|url-status=suggested) (help) - ^ Mahony, Melissa (May 25, 2010). "A sharkskin coating for ships, planes and blades". SmartPlanet. Retrieved September 29, 2012.
- ^ Graham Warwick (January 27, 2017). "When Will These Civil Aircraft Concepts Fly?". Aviation Week & Space Technology.
- ^ a b c "Fuel Burn vs. Maintenance Costs" (PDF). IATA maintenance cost conference. Airbus. October 2012.
- ^ Spakovszky, Zoltan (2009). "Unified Propulsion Lecture 1". Unified Engineering Lecture Notes. MIT. Retrieved April 3, 2009.
- ^ US application 2009020643, Airbus & Christophe Cros, "Aircraft having reduced environmental impact", published 2009-01-22
- ^ "FAI Record ID #15066 - Aeroplane Efficiency, C-1b (Landplanes: take off weight 500 to 1000 kg) " Fédération Aéronautique Internationale Record date 8 June 2008. Accessed: 4 October 2015.
- ^ Antonio Filippone (2012). Advanced Aircraft Flight Performance. Cambridge University Press. p. 454. ISBN 9781139789660.
- ^ Irene Kwan and Daniel Rutherford (November 2015). "Transatlantic airline fuel efficiency ranking, 2014" (PDF). International Council on Clean Transportation.
- ^ a b "Fuel saving" (PDF). ATR. January 2011.
- ^ "Beechcraft 1900D: Fuel, Emissions & Cost Savings Operational Analysis" (PDF). Specific Range Solutions Ltd. February 21, 2012.
- ^ Mark Brouwer, Siddharth Srinivasan. "Proud to fly a Turboprop: Q400 vs ATR72". The Flying Engineer.
- ^ "Dornier 228 Advanced Commuter Brochure". RUAG.
- ^ "Dornier 328 corporate shuttle" (PDF). Aviation Week Business & Commercial Aviation. March 1996.
- ^ "120 Brasilia Sales Brochure". Embraer. p. 8.
- ^ "PC-12 NG Just The Facts" (PDF). Pilatus. October 20, 2015.
- ^ a b "Saab 340A data sheet" (PDF). Saab Aircraft Leasing. 2009.
- ^ a b "Saab 2000 data sheet" (PDF). Saab Aircraft Leasing. 2009.
- ^ a b c d e f g "Embraer continues and refines its strategy at the low-end of 100-149 seat sector". Leeham News. January 13, 2014.
- ^ a b c d e f "ANALYSIS: A320neo vs. 737 MAX: Airbus is Leading (Slightly) – Part II". Airways News. February 5, 2016.
- ^ a b Scott McCartney (August 12, 2010). "A Prius With Wings vs. a Guzzler in the Clouds". Wall Street Journal.
- ^ a b c d e f g h "737 performance summary" (PDF). Boeing. 2007.
- ^ a b c d "757 performance summary" (PDF). Boeing. 2007.
- ^ "Bombardier CRJ1000 Fuel Consumption". Sun Airlines. August 20, 2013.
- ^ "Q400 Fuel efficiency manual" (PDF). Bombardier. 2014.
- ^ a b "Sukhoi SSJ100, Embraer ERJ190, Airbus A319 Operational and Economic Comparison". Sukhoi. March 2013.
- ^ a b c d e f g "Analysing the options for 757 replacement" (PDF). Aircraft Commerce. August 2005.
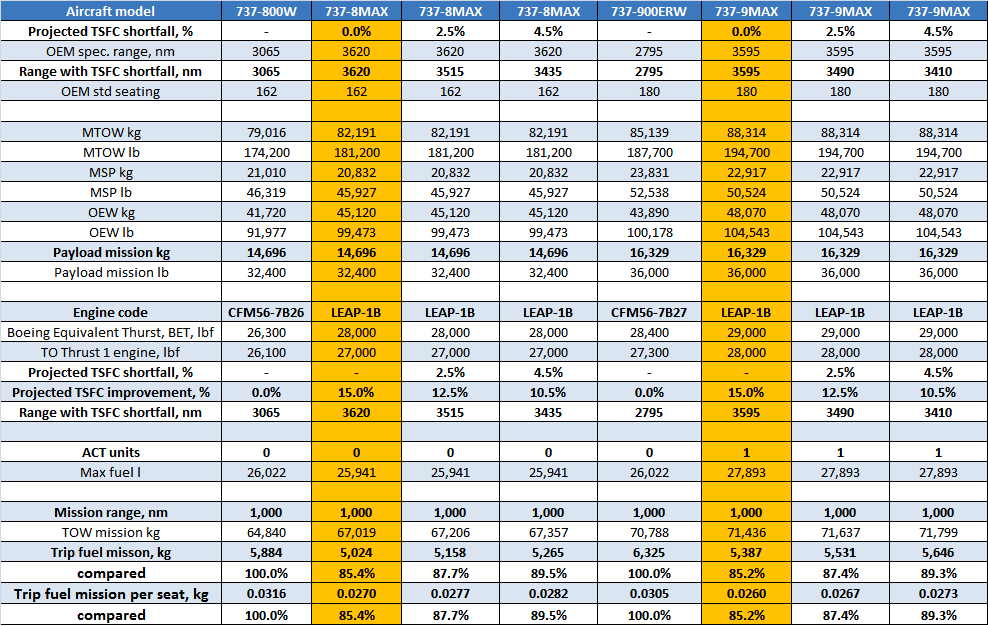
- ^ a b c d "Boeing 737 MAX: performance with reported engine SFC shortfall". Leeham News. April 15, 2015.
- ^ "Kodiak Brochure" (PDF). Quest Aircraft. April 2014.
- ^ "Distance from JFK to LHR". great circle mapper.
- ^ a b c Template:Cite article
- ^ a b c d e Bjorn Fehrm (February 25, 2015). "Redefining the 757 replacement: Requirement for the 225/5000 Sector". Leeham News.
- ^ a b c d e f g "Boeing: 777 way much better than A330". Aspire aviation. December 8, 2010.
- ^ a b c d e Vinay Bhaskara (November 25, 2014). "UPDATED ANALYSIS: Delta Order for A350; A330neo Hinged on Pricing, Availability". Airways News.
- ^ a b "737 MAX 8 could be enabler for some LCC Long Haul". Leeham News. December 8, 2014.
- ^ a b "747-8 performance summary" (PDF). Boeing. 2010.
- ^ a b c d e f "767 performance summary" (PDF). Boeing. 2006. Archived from the original (PDF) on April 15, 2015.
{{cite web}}: Unknown parameter|dead-url=ignored (|url-status=suggested) (help) - ^ a b c d "777 performance summary" (PDF). Boeing. 2009. Archived from the original (PDF) on January 4, 2014.
{{cite web}}: Unknown parameter|dead-url=ignored (|url-status=suggested) (help) - ^ "Distance from HKG to SFO". great circle mapper.
- ^ a b c d "ANALYSIS: The Boeing 787-8 and Airbus A330-800neo are Far From Dead". Airways News. March 17, 2016.
- ^ a b "Airbus A350 : is the Xtra making the difference ?". Aspire Aviation. June 8, 2015.
- ^ a b c d "Updating the A380: the prospect of a neo version and what's involved". leeham news. February 3, 2014.
- ^ "What Might an Engine Improvement and Sharklets Provide?". Air Insight. July 4, 2016.
- ^ "747 performance summary" (PDF). Boeing. 2010.
- ^ Edward Jobson (September 12, 2013). "Coach fuel consumption". volvo buses.
- ^ DEFRA (2008). 2008 Guidelines to Defra’s GHG Conversion Factors: Methodology Paper for Transport Emission Factors
- ^ "2014 Toyota Prius fuel economy". United States Environmental Protection Agency.