
Talk:Accumulated cyclone energy: Difference between revisions
→Original research?: new section |
|||
| Line 286: | Line 286: | ||
Forgive me if this concern has been raised elsewhere (I have a feeling it has) but doesn't the calculation of ACEs by [[WP:TROP]] participants fall foul of [[WP:OR|No original research]]? Given the 'source' for ACEs is a talkpage, I can't help but think we're not supposed to do that. I know the original data comes from the NHC, but I would assume that if the ACEs were published by the NHC themselves we would use that as a source and not the respective season's talk page. Can anyone shed some light on this matter? Thanks, [[User:Sarsaparilla39|Sarsaparilla39]] ([[User talk:Sarsaparilla39|talk]]) 12:26, 8 August 2009 (UTC) |
Forgive me if this concern has been raised elsewhere (I have a feeling it has) but doesn't the calculation of ACEs by [[WP:TROP]] participants fall foul of [[WP:OR|No original research]]? Given the 'source' for ACEs is a talkpage, I can't help but think we're not supposed to do that. I know the original data comes from the NHC, but I would assume that if the ACEs were published by the NHC themselves we would use that as a source and not the respective season's talk page. Can anyone shed some light on this matter? Thanks, [[User:Sarsaparilla39|Sarsaparilla39]] ([[User talk:Sarsaparilla39|talk]]) 12:26, 8 August 2009 (UTC) |
||
:Both the data and the equations are provided by the NHC. All we do is put the numbers into the equation, is hardly research. If a source says X=2Y and Y=4, then you can say X=8, per [[WP:CALC]]. [[User:Plasticup|<b><font color="#0080FF">Plasticup</font></b>]] [[User_Talk:Plasticup |<font color="#2A8E82"><sup><small>T</small></sup></font>]]/[[Special:Contributions/Plasticup|<font color="#2A8E82"><small>C</small></font>]] 16:11, 30 September 2010 (UTC) |
|||
Revision as of 16:11, 30 September 2010
Kerry Emanual
I know Kerry Emanual has found a strong correlation between potential destructiveness of hurricanes based on the total dissipation of power, integrated over the lifetime of the cyclone and sea surface temperatures. (Other studies have found no correlation between storm frequency and SSTs.) Did this use ACE? If so, I suggest it would be good to add this to the article. crandles 14:37, 29 August 2005 (UTC)pussy
- No he didn't, he created his own Power dissipation index crandles 13:54, 2 October 2005 (UTC)
Wait until November 30!
I think adding the year 2005 to this list is way too early. Let's wait until the season as actually over! Awolf002 14:11, 13 October 2005 (UTC)
- I see no harm in it as long as it is designated as active in some way. --Holderca1 13:24, 19 October 2005 (UTC)
It's enough that the 2005 number is stated in the text just before the table. It will sure change, with Wilma churning. Awolf002 13:52, 19 October 2005 (UTC)
- I'm restoring it, since it is a straight addition of published information from NOAA. There is absolutely nothing wrong with having a table that is going to be updated over time. Stirling Newberry - Bopnews 01:33, 20 October 2005 (UTC)
I guess, I'm outvoted 2:1 :-) Still, updating this number and table nearly each day for the next few weeks sounds totally unneccessary. It's only the "final" number that counts. Awolf002 18:25, 20 October 2005 (UTC)
- On the contrary, the number in progress indicates how active this season has been against other seasons. Just as the TS/H/MH count is an indicator of how active the season has been to date. Stirling Newberry 04:55, 21 October 2005 (UTC)
- I wouldn't say you would have to do that, just update it whenever NOAA updates their page. I believe they update their page whenever a storm dissipates. --Holderca1 03:09, 21 October 2005 (UTC)
Is this possible?
Can a season be both near normal and hyperactive? Say there are several long-lasting Cape Verde storms but few other tropical storms, and the ACE goes above 153 with a high number of major hurricanes (say 9/8/7)? CrazyC83 02:49, 27 October 2005 (UTC)
- Doesn't 153 9/8/7 meets sufficient criteria for above normal? I don't see why it would be impossible to have something like 140 9/5/4 classed as near normal (9<10 and 5<6). If the 4 were all strong Cat 4 or 5 could it be hyperactive? (140<153 but the strong cat 4 and cat 5 could push it into hyperactive territory I think. (1958 was hyperactive with only 121.)) crandles 16:10, 27 October 2005 (UTC)
- It seems 1951 and 1958 weren't hyperactive and this has been corrected in the article. crandles 15:36, 8 December 2005 (UTC)
Split
I think List of Atlantic hurricane seasons by ACE should be split off from the general article on the concept of Accumulated Cyclone Energy. Jdorje 21:04, 31 October 2005 (UTC)
- I don't think that's really nessisary yet, we have limited information about the concept of ACE and that is best kept in a summery format. -- Hurricane Eric - my dropsonde - archive 04:20, 4 November 2005 (UTC)
- I agree. I think we want Pacific ACE information added to the graph (in different colours) and perhaps also a table to be put next to the Atlantic one. Lets add to this before considering a split. crandles 12:34, 4 November 2005 (UTC)
- I removed the {{split}} tag, as there has been no further debate on the split-issue since early november 2005, and it appears that at least some were in favor of keeping everything in one article. Bjelleklang - talk 11:46, 16 January 2006 (UTC)
Data for NW Pacific
Gathering data:
| Year | Official? | Estimate |
|---|---|---|
| 2004 | 464 | |
| 2003 | 322 | |
| 2002 | 372 | |
| 2001 | 308 | |
| 2000 | 254 | |
| 1999 | 114 | |
| 1998 | 157 | |
| 1997 | 605 | |
| 1996 | 427 |
crandles 13:27, 4 November 2005 (UTC)
- Are we still gathering data? I've entered estimates for 1996-2001, as calculated from the JTWC (although this may violate WP:NOR as a new analysis of published data). Note that my numbers are typically 1-6% higher than official numbers I've seen for other years or basins (not sure why), but this can provide a rough estimate until official numbers are found. --Spiffy sperry 21:52, 9 December 2005 (UTC)
- I brought up that issue some time ago at the No Original Research page. See here. Miss Madeline | Talk to Madeline 00:13, 12 January 2006 (UTC)
2004 ACE
Is the 2004 ACE 225.023 as stated below the table or is it 224.892 as per [1]? crandles 18:51, 29 November 2005 (UTC)
- Does it matter? The uncertainty of the measurment is quite large. First the storm wind speed on which it is based is usually to +/-5 knots or even ten, and this is squared. This means that the uncertainties are probably at least 5% in each measurement, especially for powerful storms that contribute most. Also the storms are only quoted to 3 sig figs so anything in the last two decimal places is really statistically spurious. Finally there is the error in adding all the powerful storms together. All in all this debate is, pardon the pun, a storm in a teacup. Furthermore there is absolutely no justification in qutoing the total season ACE to more than one decimal place under any circumstance. 81.174.244.201 20:49, 30 November 2005 (UTC)
Largest ACE storm?
I would like to know what is the largest ACE ever for a single storm? The largest I know of is Hurricane Ivan of 2004 which had 70.0, but probably larger ones like Mitch or Galveston had higher ACE ratings. Does anyone have information about these storms? --Mark J 21:55, 30 November 2005 (UTC)
- Someone put in [2] Highest ACE hurricane = 1899 (73.5, Hurricane San Ciriaco) This seems quite plausible as that is also the longest duration hurricane and duration does seem important to getting a high ACE. crandles 17:06, 1 December 2005 (UTC)
- By my calculations (which are by no means official, and could be ±0.5
are at least ±1), Ivan (2004) is the largest since 1944, and Mitch is about 33rd24thplace at 35.941.0. Mitch was at hurricane strength for only about 5.5 days, while Ivan was at hurricane strength for about 11.5 days.
- By my calculations (which are by no means official, and could be ±0.5
- Counting the incomplete and less reliable records before 1944, Galveston (1900), which was at hurricane strength for about 3.5 days, had an ACE of 22.8
25.0. In addition to Hurricane San Ciriaco (1899)(which I had at 77.2), the other highest storm in my calculations is a 1926 Category 4 at 67.670.8, which would put it close to, if not greater than, Ivan. Both of these storms lasted over three weeks, with hurricane strength about 16 days. --Spiffy sperry 18:02, 1 December 2005 (UTC) -- calcs edited on 21:50, 25 January 2006 (UTC)
- Counting the incomplete and less reliable records before 1944, Galveston (1900), which was at hurricane strength for about 3.5 days, had an ACE of 22.8
ACE Calculation methodology
I assume the calculation is (max. speed)^2 because as the top speed gets larger the hurricanes also increase in size and thus overall power. The problem I see with this is that it doesn't differentiate between storms of the same max speed but widely differing extents. For example Camille had higher windspeeds than Katrina, but since it was a more compact storm a smaller part of the coastline felt its highest speeds compared to the much larger Katrina. Wouldn't a better measure of a storm's power be
Vmax * Rts
where Vmax is the maximum speed and Rts the radial extent of tropical storm force winds.
- The calculation is (max speed)^2 because Kinetic energy equals mass times (velocity)^2. The hurricane DOES NOT neccesairly increase in size. ACE is a pretty worthless calculation IMHO because it does not take the radius of the storm into account. 08:19, 7 December 2005 (UTC)
- P.S. But it is better than nothing. TimL 08:19, 7 December 2005 (UTC)
- Yes this is a known problem with ACE. A measure of radius would improve the calculation of what it is trying to measure. The trouble is past records simply are not good enough to introduce such a measure well. If you just do it for recent years, what is the point unless you have something to compare to? While this certainly introduces errors in the calculation, when you have large numbers of measurments (over 150? 6 hourly measurements in a season or should it be on 10 storms a season?) is the ratio of small storms for the windspeed compared to those that are large for their windspeed likely to change much? I doubt it changes that dramatically provided you are comparing a season's ACE to another season's ACE. If you are comparing storm ACEs' then it is a much bigger problem. I think Kerry Emanuel had another look at this for his Power dissipation index (uses wind speed cubed) but again concluded that there were inadequate records of storm radii for this to be used. crandles 15:25, 7 December 2005 (UTC)
New Graph showing ACE per storm
I am not criticising, just wondering why the new graph shows ACE per storm rather than number of storms (or something else). I am just not sure what it is trying to show. I am thinking that I would like to see what is the biggest contribution to ACE; is it number of storms, duration of storms, or stength of storms. However I am not quite sure how I would show that. (Results of multiple regression analysis maybe? If I wanted to do this, I don't even know where there is data on the number of 6 hourly storm advisories in each season could be found.) crandles 15:45, 7 December 2005 (UTC)
- It is much less of a problem if you look at a 10year ACE average. I made a pic here. If anyone wants to include something to show the effect of AMO on ACE that may be useful and I think it can be used as I am happy to give it a free use licence. I probably should acknowledge that the data comes from NHC. I would like to contrast that pic to Kerry Emanuel's graphs from his recent paper but am not sure when I will get around to this or whether it would be worth including. crandles 16:02, 7 December 2005 (UTC)
Todo
- Non-mathematical explanation of what it means.
- Better intro (without any math).
In the article's current form only the introduction gives information on the "theory", and the rest is all historical data. Jdorje 05:59, 15 January 2006 (UTC)
Historical ACE data
ACE enthusiasts may find these little tables interesting. I modified my track-map generator to count up the ACE values of storms. From there it is an easy matter to output them straight into wiki format. Sorting them will take a little more work but should follow shortly. Jdorje 00:22, 20 January 2006 (UTC)
This gives some interesting results. First of all, note that the WPac, NIndian, and South come from JTWC advisories and may not be entirely accurate. The canonical example is Typhoon Nancy of the 1961 Pacific typhoon season which is credited with 215mph sustained winds. With that caveat, the highest-ACE storms of all time (those with > 70 ACE) are:
| Name | Year | Basin | ACE |
|---|---|---|---|
| Typhoon Nancy | 1961 | WPac | 77.3 |
| 1899 Hurricane San Ciriaco | 1899 | Atlantic | 73.6 |
| Hurricane John | 1994 | EPac | 70.6 |
| Hurricane Ivan | 2004 | Atlantic | 70.4 |
| Typhoon Paka | 1997 | EPac / WPac | 70.2 |
- Does anybody have the total ACE for Hurricane/Typhoon Ioke?
- Thanks! Thanks so much, I had been trying to do amateur calculations for weeks. Now I'll go and put ACE tables like the one in 2005 into all the hurricane seasons. Thanks again, these tables are brilliant. --Mark J 13:41, 21 January 2006 (UTC)
- Before you do that we need to determine if my calculations are right. For 2004, they do not match what is given by the NHC. Why? Jdorje 17:01, 21 January 2006 (UTC)
- In other words any ACE tables need to have a source, and this list is not an adequate source. For instance you've already changed the 2004 season page, but the source the page gives now lists different data than the page has. So it needs to be changed back. Jdorje 17:03, 21 January 2006 (UTC)
- According to everything I've read, only tropical systems count toward ACE. However even when I change that, the numbers don't come out right and nicole gets 1.365. Is it possible that NHC page is based on the forecast data rather than on the best-track? Jdorje 18:29, 22 January 2006 (UTC)
- Well, my only conclusion is that they are wrong and I am right ;-). BTW, while you're adding tables, make sure there are no wikilinks inside the section headings. Jdorje 18:35, 22 January 2006 (UTC)
- This document from the WMO says that subtropical time counts. --Ajm81 20:12, 15 February 2006 (UTC)
- Great. Three weeks after I finally get my calculations in line with the table in this article, our friend decides to add subtropical (ST) values. By my calculations, no less than 22 seasons (out of 56) would have a higher ACE if we consistently include ST data. These 22 seasons would increase by an average of 4.5. Indeed, NCDC's 2004 table, mentioned above [3], has a value for ST Nicole, but its value for tropical storm Otto is 1.05 instead of 1.94, which leads me to believe that ST data was not counted for Otto. Furthermore, the ACE description below the table states "all periods in which the tropical cyclone is a tropical storm or greater intensity." (empasis added) Wiki says ST is only part tropical, and part extratropical, so does it fully meet the first criteria of being a tropical cyclone? (BTW, it's counter-intuitive based on the name, but ST can be up to 65-70 kt, which overlaps with the hurricane category. Also, the ST category doesn't seem show up until 1968, and including ST storms in the tropical cylcone naming sequence began in 2002.) --Spiffy sperry 03:38, 16 February 2006 (UTC)
- As stated before, that link only uses advisory times. Note that Frances' best track does not match up, but the advisory totals do. As for the wiki, it could be wrong. I'd check the linked paper but the site seems to be clogged right now. If the WMO and NHC count subtropical time, shouldn't we? --Ajm81 04:59, 16 February 2006 (UTC)
- I don't have a good answer. Do you agree that if we include ST, then the previous season totals need to be updated and would in part vary considerably from this NOAA ref? For instance, the biggest differences include 1984 (up from 71 to 84) and 1968 (up from 35 to 45). All of the recent years, 2000-2004, see increases as well. (BTW, I use best track.) --Spiffy sperry 22:16, 22 February 2006 (UTC)
I've continued this discussion elsewhere since it was brought up there as well, but I'll repeat myself here. I contacted someone at the NCDC (National Climatic Data Center) and received a detailed explanation. In short, the official ACE index definition (which itself arose from something slightly different) does not include "subtropical" or "extratropical" observations, but NCDC includes it in some of their calculations anyway in order to compare data globally, due to questionable reliability of data in the Atlantic and other basins. Future updates from NCDC may indicate something to this effect. The question for us is what purpose do we have in tabulating ACE values? Whatever we decide, we need to update the 2005 articles to meet the official definition (and to be consistent with our pre-2005 data), or update 1950-2004 to facilitate global comparisons (assuming we will eventually have detailed data for more than just the Atlantic) --Spiffy sperry 19:12, 25 April 2006 (UTC)
Is it possible to also calculate Power Dissipation Index (uses wind speed cubed instead of wind speed squared)? crandles 14:42, 22 January 2006 (UTC)
- Where is it defined? Jdorje 18:31, 22 January 2006 (UTC)
- Sorry I missed that question. It is defined in this paper; equation 2 on the first page. crandles 19:59, 27 January 2006 (UTC)
- Wow, that's an extraordinarily useful value. Unfortunately there is no way to calculate it from the best-track data, since this data does not include the size of the hurricane. Jdorje 17:14, 31 January 2006 (UTC)

- Uh, yes. However the second formula gives a value not nearly as useful...also, the first formula looks wrong to me...what's the 'r' doing in there right after the V^3? Jdorje 02:50, 1 February 2006 (UTC)
- Yes, but that is quite false. For instance, Katrina had (say) 120mph winds across a 100-mile radius...compared to Camille with 190mph winds across a 10-mile radius. Katrina's PDI should be 25 times higher, but in the "approximation" it is 4 times lower. His point that historical data is not available for storm sizes (prior to about 1995) is a good one, however. Jdorje 04:33, 1 February 2006 (UTC)
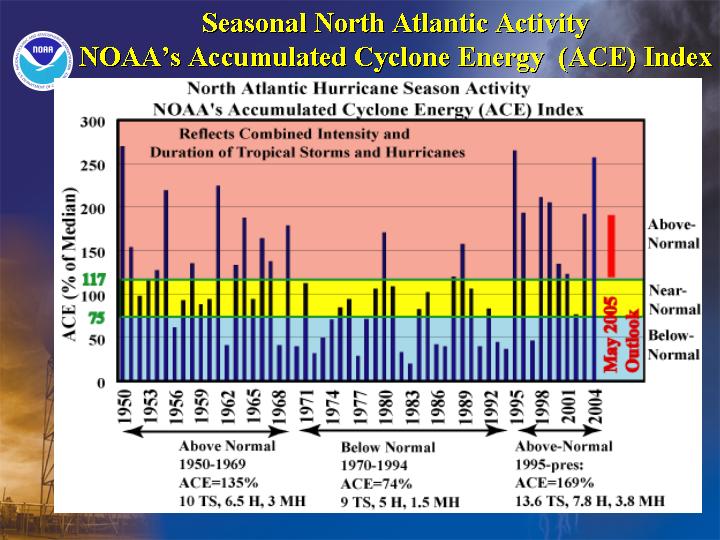
The calculations for the east Pacific leave a little to be desired... not to say that you didn't do a good job through hard work... When adding up the totals for all storms in the 1997 season, I get a value in excess of 270, which would place it above 1992. And yet this graph clearly shows that the 1997 season has an ACE below 200. Indeed, when I do the calculations without Paka and Oliwa (their ACE in the CPAC is insignificant), I still get a result above 160... even though the graph seems to show it just below 150. The graph appears to indicate that the threshold for Above Normal is 130, yet the background information gives it as 150. In addition, when I add the raw totals for the 1992 season together, I get a value above 290. Yet the graph shows it barely poking above 250. When I subtract ACE "earned" in the Centtral Pacific from that season (The storms with CPac ACE are Ekeka, Hali, Frank, Javier, Iniki, and Roslyn), I get an unrounded value of 257.855, which appears to agree much better with the graph in question. I therefore conclude that east Pacific ACE only includes the east Pacific proper (east of 140W). But this is probably original research, so I can't include it in articles. I therefore suggest excising ACE from all East Pacific season articles. Miss Madeline | Talk to Madeline 19:52, 27 January 2006 (UTC)
- So long as it's all verifiable, I don't see any reason that the reasoning applied previously about NOR doesn't still apply. Just need to calculate the correct numbers. This might be a case of WP:IAR. --AySz88^-^ 13:05, 28 January 2006 (UTC)
That's really interesting, Jdorje. I wonder what the ACE for Cyclone Catarina was, it doesn't really have a best track. -- §HurricaneERIC§ archive 14:08, 31 January 2006 (UTC)
- Hink found a best-track estimate that some professor had made up. My track program can't read it but we could calculate the info by hand. Jdorje 17:15, 31 January 2006 (UTC)
1992 ACE
I have updated the ACE value for 1992 from 75 to 82. The former number agrees with the table here, but that page includes a link to a bar graph here that obviously shows a value greater than 75 and appears to agree with my calculations. (Plus, the table in the first link includes other numbers that wiki doesn't agree with, like 7 named storms for 1992. [See discussion on this below.]) Also, this should be fixed when the graph on this wiki page is updated for the final 2005 value. --Spiffy sperry 22:25, 25 January 2006 (UTC)
- I've undone the "correction" noted above. The best track data I use for my calculations snuck in 4 data points outside the 6-hour intervals for Andrew (1992), resulting in an extra 6.7525. These were the only ones out of 37,703 lines of data. Not surprisingly, the data come from the same source as the bar graph noted above, which I used to validate my incorrect notion. Sorry. --Spiffy sperry 15:50, 17 August 2006 (UTC)
Tropical storm column
- This also fits in with the discussion above on subtropical storms, but I've figured out nearly all of the differences I noted in parenthesis above. The table in the first link above has a total for all storms, including subtropicals, but wiki's ACE table does not include storms that remained subtropical. So the total for the following years are different by up to 4: 1969, 1972-1976, 1978-1979, 1981-1982, 1984, 1992, 1997, 2000, 2004-2005. Note that with the newly discovered (and unnamed) suptropical storm from Oct. 2005, the total number of storms is 28 (as listed on many of the 2005 season pages), but the total number of tropical storms is 27 (as listed in the ACE table). I notice that no one has yet tried to change the 2005 season, and I just reverted an earlier change to the 2004 season. --Spiffy sperry 16:12, 12 April 2006 (UTC)
2005
When will the 2005 figures cease to be "provisional"? -- §HurricaneERIC§ archive 14:10, 31 January 2006 (UTC)
- When these reports are finished. There are currently 13 reports yet to be released, including big ones Emily, Rita, and Katrina. The final reports often cause adjustments in the numbers. For instance, compare with wiki's current stats with this reference, which was a little off as of Jan. 6. --Spiffy sperry 15:53, 31 January 2006 (UTC)
Helping
I can help out with calculating the ACEs for any season article for both the Atlantic and the Pacific. I've noticed only the recent season articles have those ACEs, so I can help with the rest of the articles. I would really like to help out. Anyone??? RaNdOm26 08:04, 16 August 2006 (UTC)
- Hi, welcome to Wikipedia! (I haven't seen you around these pages yet.) You don't need to ask anyone for permission to help - Wikipedia:be bold in updating pages! Since the total-season ACEs are already calculated in the table in the ACE article, you don't have to recalculate, and you can add in the data if you were like.
- If you were talking about listing the ACE of each individual storm in each season article: I'm also pretty sure that every storm's ACE has been calculated somewhere - even if it hasn't, there are definately programs or programmers out there that'll parse the data and calculate the data quickly. I'll let someone else decide whether it'd be worth it.
- Of course, you should still ask first if you're not certain about anything or if you want feedback on an idea. Hope that helps, and happy editing! —AySz88\^-^ 18:18, 16 August 2006 (UTC)
- Thank you, thank you so much for replying!!! Very much appreciated.
- One question, could I use the "Historical ACE data" info in the middle of this page to use for listing the ACE of each storm in the season articles??? I am assuming all the stats are correct, but if they are incorrect, please mention so. RaNdOm26 09:04, 17 August 2006 (UTC)
- For what it's worth, my calculations agree exactly with those stats 87% of the time (to 3 sig figs). Take out pre-1886 figures, and it's 99%.
The biggest difference is unnamed #3 (1915) - the table has 46.05 while I calculate 8.435. Plus, the table has 6 storms for 1911, while I only see 4. Finally,The 2005 numbers may not reflect all of the latest TCR's, but the 2005 stats page is already in good shape. --Spiffy sperry 16:01, 17 August 2006 (UTC) (update: I'm finding more errors in my data. Thanks AOML, et al! 16:35, 17 August 2006 (UTC))
- For what it's worth, my calculations agree exactly with those stats 87% of the time (to 3 sig figs). Take out pre-1886 figures, and it's 99%.
Average ACE by date in season
At /Norm by date is a table showing the average ACE, and average number of tropical storms etc., up to each date within the Atlantic season.--Keith Edkins ( Talk ) 17:19, 13 September 2006 (UTC)
Unit
Currently, the article states
- The unit of ACE is 104 kt2, and for use as an index the unit is assumed.
While this is what the sources say, I must point out that they are being sloppy with units. According to the article,
- The ACE is calculated by summing the squares of the estimated maximum sustained velocity of every active tropical storm (wind speed 35 knots or higher), at six-hour intervals.
The process being described here is clearly numerical integration. Consider an equivalent calculation:
- The XXX is calculated by summing the velocity of the car at one-minute intervals.
It is clear that XXX would then be an approximation to the distance travelled, and that its unit would not be "miles per hour" (for example, a car moving at a constant speed of 60 miles per hour for an hour would not have an XXX of 3,600 miles per hour), but "minutes times miles per hour" (the XXX would be 3,600 minutes×miles per hour, or 60 miles after simplification).
In the case of ACE, it is not distance travelled that's approximated, but the quantity , where the integral is over the time a cyclone is a tropical storm. The SI unit would thus be , though a unit of kt2h or even kt2(6h) would be easier to work with.


I'm not quite sure how to proceed. The easiest would be to just relativise the claim that the unit is kt2 and make ACE, for purposes of our discussion, merely a number without any unit. I'd just add a note on this, but do not want to violate WP:OR.
This might be a bit of a minor issue; however, sloppiness when using physical (or mathematical) units is a real problem, and the treatment of units here is sloppy.
RandomP 16:08, 19 September 2006 (UTC)
- It made more sense to me if I thought of it this way: the cyclone's rate of energy use is being measured every 6 hours, because it appears to be assumed that the cyclone replenishes a proportion of its energy every some interval of time. This would be more like and the unit would be really be energy per mass - a velocity squared. I hope that makes sense? —AySz88\^-^ 04:57, 22 September 2006 (UTC)

- Interesting, I hadn't thought of it that way. However, I do not see how it would change the unit. Of course you could introduce arbitrary constants to change the unit — but if that's what's happening, it needs to happen explicitly; furthermore, introducing a new constant whose value is six hours seems a bit redundant, since we've already got other constants only a factor of 4, or 6, respectively, away from that ...
- RandomP 12:23, 22 September 2006 (UTC)
- has units of nm2/hr3. Then approximate the integral using the rectangle method and a delta-x of 6 hours, to get units of nm2/hr2, or kt2. The 6 hours isn't an arbitrary constant, it's just the resolution of the data available.
- As for the k (above) that's eventually tossed out at the end, I think this ends up with only a unit of kg if you derive the equation all the way from rotational energy (using assumptions which are something like that r and m don't vary with time, and v varies linearly with r, etc. - sorry for the rather blurry description; I once derived the equation all the way but I can't remember which assumptions I used...). The missing mass unit is reasonable since you wouldn't want to pretend that the formula took mass into account. So the name of the quantity isn't quite right - it's accumulated energy per mass, not just "energy" - but the unit appears still correct. —AySz88\^-^ 16:22, 22 September 2006 (UTC)

- Oh, sorry. I misread. No, is simply not what's being measured. At all.
- 6 hours is the resolution of the data; you suggested to give it some storm-related relevance as well (as I originally understood it, you essentially stated that the movement of a storm after six hours had passed was all "new" energy, with the old one having been used up).
- Sorry, I still don't quite see how your argument would work. What's being measured is the average square-speed of the storm: assuming there's a relatively constant mass of the storm (your k), that translates to energy-time available for destruction. A weird unit, certainly, but it does make sense.
- Of course you can use another constant to get this back down to an energy estimate, but that constant is very unlikely to be anywhere near 6 hours.
- RandomP 16:54, 22 September 2006 (UTC)


- But I'm not saying that. You did, and it appeared to me to be an unlikely coincidence, so I disagreed with it. (and no, that doesn't look like an approximation of to me). RandomP 17:18, 22 September 2006 (UTC)
- You folks commenting here are correct and the sources are wrong. The units on NOAA's formulation of the ACE hurricane index are knots-squared times six hours.
- As RandomP has correctly noted, the ACE hurricane index is a numerical integral. It is calculated by taking the sum of the maximum wind speed in knots, and squaring it, for six-hour intervals during the tropical storm's lifetime. That sum only has meaning when you know that the time interval is 6 hours. If I took WRF output of Hurricane Katrina at one-hour intervals, squared the sum of the maximum wind speed in knots, would I get a comparable ACE index? No, because I have used 1-hour intervals instead of 6 hours. My total would be 6 times NOAA's formulation.
- The unit "knots-squared-six-hours" is mighty clumsy and confusing! A well-formulated index should enlighten, not obscure what's going on. It's unfortunate that NOAA's formulation of the ACE index has come into usage without being vetted by a standards committee. Model output and direct wind measurements will not be forever tied to six-hour intervals.
- In a web publication on hurricane metrics I have expressed the ACE index in knots-squared-days. Although "days" is not an MKS unit, at least it's a standard length of time. Any knowledgeable person should be able to take hurricane wind measurements at any time interval and adjust their calculated ACE to days; the wind speed measurement should be multiplied by the number of days for which it applies (probably a fraction less than 1.0). To convert from NOAA's formulation to "knots-squared-days", simply divide by 4. Days are a reasonable measure of a tropical cyclone's lifetime, and of course floating-point numbers should be used for days so that hours and minutes can be accommodated.
- This is all explained in the web article. I also showed how to decompose the ACE index into intensity, number, and duration of storms. Various researchers have been exploring the changing nature and interaction of those hurricane characteristics.
CarlDrews (talk) 15:32, 28 November 2007 (UTC)
2006 EPac figure
Why does this list give it as 139.7 when the article says it's only 108? I've changed it back. --Mark J 12:14, 14 October 2006 (UTC)
Title case
Accumulated cyclone energy v.s. Accumulated Cyclone Energy? Sort of like the SSHS/SShs debate... – Chacor 14:47, 20 August 2007 (UTC)
Atlantic Hurricane seasons
Can this measurement be extended towards other basins? I was reading through Hurricane Ioke and noticed its use there. KyuuA4 22:04, 6 November 2007 (UTC)
Original research?
Forgive me if this concern has been raised elsewhere (I have a feeling it has) but doesn't the calculation of ACEs by WP:TROP participants fall foul of No original research? Given the 'source' for ACEs is a talkpage, I can't help but think we're not supposed to do that. I know the original data comes from the NHC, but I would assume that if the ACEs were published by the NHC themselves we would use that as a source and not the respective season's talk page. Can anyone shed some light on this matter? Thanks, Sarsaparilla39 (talk) 12:26, 8 August 2009 (UTC)