1964 United States presidential election in South Carolina
| ||||||||||||||||||||||||||
| ||||||||||||||||||||||||||
 County Results
| ||||||||||||||||||||||||||
| ||||||||||||||||||||||||||
| Elections in South Carolina |
|---|
 |
The 1964 United States presidential election in South Carolina took place on November 3, 1964, as part of the 1964 United States presidential election. South Carolina voters chose 8[2] representatives, or electors, to the Electoral College, who voted for president and vice president.
Background
For six decades up to 1950 South Carolina was a one-party state dominated by the Democratic Party. The Republican Party had been moribund due to the disfranchisement of blacks and the complete absence of other support bases as the Palmetto State completely lacked upland or German refugee whites opposed to secession.[3] Between 1900 and 1948, no Republican presidential candidate ever obtained more than seven percent of the total presidential vote[4] – a vote which in 1924 reached as low as 6.6 percent of the total voting-age population[5] (or approximately 15 percent of the voting-age white population).
Following Harry S. Truman’s To Secure These Rights in 1947, the following year South Carolina’s small electorate overwhelmingly rejected him in favour of state Governor Strom Thurmond, who won 71 percent of the state’s limited electorate and every county except poor white industrial Anderson and Spartanburg.[6] During the 1950s, the state’s wealthier and more urbanized whites became extremely disenchanted with the national Democratic Party and to a lesser extent with the federal administration of Republican Dwight D. Eisenhower.[7] However, aided by the state’s abolition of its poll tax in 1950, the poor white upcountry provided enough support to national Democrats Adlai Stevenson II and John F. Kennedy to, aided by substantial majorities amongst the small but increasing number of blacks able to vote, keep the state in Democratic hands.
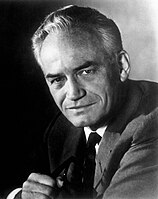
During the 1950s, wealthy textile mill owners in the upcountry developed a grassroots state Republican Party dedicated to the tenets of the John Birch Society. This group nominated the most conservative delegation at the party’s 1960 convention.[8] These wealthy businessmen would merge with hardline segregationists to draft Barry Goldwater for the Republican nomination in 1960 and join forces therein by the time of the next presidential election.[8] When Goldwater secured the nomination for 1964 and voted against the Civil Rights Act, he courted Thurmond – now South Carolina’s junior senator – to change parties.[9] Thurmond did this, and immediately linked his party switch to the Goldwater presidential campaign,[10] which toured the state in September.[11]
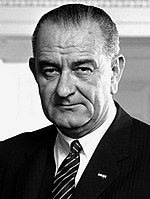
The Democratic Party, for its part, had struggled bitterly over whether to select electors pledged to incumbent President Lyndon Johnson due to his support for civil rights and desegregation; however, like Georgia, Louisiana and Mississippi, South Carolina chose Democratic electors pledged to LBJ.[12] President Johnson did not campaign in the state, being hopeful that a black registration increased by more than Kennedy’s 1960 margin[13] and support from economically liberal Senator Olin Johnston would help him win without campaigning.[14]
Polls
Early polls in the Palmetto State gave a substantial lead to Goldwater, but by the end of October the state was viewed as similarly close to the 1952 and 1960 races where the Democrats won by under ten thousand votes.[15][16]
Vote
As it turned out, and analogously to Mississippi, early polls were the most accurate and Goldwater carried South Carolina by a comfortable margin, taking 58.89 percent of the vote to Johnson’s 41.10 percent.[17][18] The swing away from Johnson was general except in a few areas of substantial black voter registration increases, and Goldwater‘s lowcountry dominance easily offset Johnson’s narrow edge amongst the poor whites of the upcountry who, despite their hostility to Johnson’s civil rights measures, saw Goldwater as a Dixiecrat-style conservative committed to privatization of services poor whites viewed essential.[19] After narrow losses in 1952 and 1960, Goldwater became the first Republican presidential candidate to carry South Carolina since Rutherford B. Hayes in 1876.
With 58.89 percent of the popular vote, South Carolina would prove to be Goldwater's third strongest state in the 1964 election after Mississippi and Alabama.[20] The state has voted Republican in every subsequent election except 1976.
Results
| Party | Candidate | Votes | % | |
|---|---|---|---|---|
| Republican | Barry Goldwater | 309,048 | 58.89% | |
| Democratic | Lyndon B. Johnson (inc.) | 215,700 | 41.10% | |
| Write-in | — | 8 | 0.01% | |
| Total votes | 524,756 | 100% | ||
Results by county
| County | Barry Morris Goldwater Republican |
Lyndon Baines Johnson Democratic |
Margin | Total votes cast | |||
|---|---|---|---|---|---|---|---|
| # | % | # | % | # | % | ||
| Abbeville | 1,448 | 35.00% | 2,689 | 65.00% | -1,241 | -30.00% | 4,137 |
| Aiken | 17,467 | 69.62% | 7,622 | 30.38% | 9,845 | 39.24% | 25,089 |
| Allendale | 1,740 | 69.27% | 772 | 30.73% | 968 | 38.54% | 2,512 |
| Anderson | 8,398 | 41.85% | 11,670 | 58.15% | -3,272 | -16.30% | 20,068 |
| Bamberg | 2,366 | 62.51% | 1,419 | 37.49% | 947 | 25.02% | 3,785 |
| Barnwell | 3,670 | 72.64% | 1,382 | 27.36% | 2,288 | 45.28% | 5,052 |
| Beaufort | 3,432 | 55.54% | 2,747 | 44.46% | 685 | 11.08% | 6,179 |
| Berkeley | 6,100 | 63.30% | 3,537 | 36.70% | 2,563 | 26.60% | 9,637 |
| Calhoun | 1,591 | 72.22% | 612 | 27.78% | 979 | 44.44% | 2,203 |
| Charleston | 32,509 | 69.06% | 14,564 | 30.94% | 17,945 | 38.12% | 47,073 |
| Cherokee | 3,627 | 46.00% | 4,258 | 54.00% | -631 | -8.00% | 7,885 |
| Chester | 2,915 | 42.89% | 3,882 | 57.11% | -967 | -14.22% | 6,797 |
| Chesterfield | 2,449 | 34.58% | 4,634 | 65.42% | -2,185 | -30.84% | 7,083 |
| Clarendon | 2,960 | 78.06% | 832 | 21.94% | 2,128 | 56.12% | 3,792 |
| Colleton | 4,637 | 69.33% | 2,051 | 30.67% | 2,586 | 38.66% | 6,688 |
| Darlington | 6,717 | 57.28% | 5,010 | 42.72% | 1,707 | 14.56% | 11,727 |
| Dillon | 2,742 | 49.72% | 2,773 | 50.28% | -31 | -0.56% | 5,515 |
| Dorchester | 5,109 | 76.11% | 1,604 | 23.89% | 3,505 | 52.22% | 6,713 |
| Edgefield | 2,489 | 75.13% | 824 | 24.87% | 1,665 | 50.26% | 3,313 |
| Fairfield | 1,997 | 43.18% | 2,628 | 56.82% | -631 | -13.64% | 4,625 |
| Florence | 10,346 | 59.11% | 7,157 | 40.89% | 3,189 | 18.22% | 17,503 |
| Georgetown | 4,705 | 57.89% | 3,423 | 42.11% | 1,282 | 15.78% | 8,128 |
| Greenville | 29,358 | 62.96% | 17,275 | 37.04% | 12,083 | 25.92% | 46,633 |
| Greenwood | 5,653 | 50.78% | 5,479 | 49.22% | 174 | 1.56% | 11,132 |
| Hampton | 2,259 | 61.09% | 1,439 | 38.91% | 820 | 22.18% | 3,698 |
| Horry | 8,293 | 60.37% | 5,444 | 39.63% | 2,849 | 20.74% | 13,737 |
| Jasper | 1,593 | 61.39% | 1,002 | 38.61% | 591 | 22.78% | 2,595 |
| Kershaw | 5,617 | 63.94% | 3,168 | 36.06% | 2,449 | 27.88% | 8,785 |
| Lancaster | 4,742 | 48.83% | 4,970 | 51.17% | -228 | -2.34% | 9,712 |
| Laurens | 5,081 | 53.79% | 4,365 | 46.21% | 716 | 7.58% | 9,446 |
| Lee | 2,489 | 68.29% | 1,156 | 31.71% | 1,333 | 36.58% | 3,645 |
| Lexington | 12,041 | 71.47% | 4,807 | 28.53% | 7,234 | 42.94% | 16,848 |
| Marion | 3,197 | 60.98% | 2,046 | 39.02% | 1,151 | 21.96% | 5,243 |
| Marlboro | 1,864 | 43.49% | 2,422 | 56.51% | -558 | -13.02% | 4,286 |
| McCormick | 939 | 65.34% | 498 | 34.66% | 441 | 30.68% | 1,437 |
| Newberry | 5,571 | 63.35% | 3,222 | 36.64% | 2,349 | 26.71% | 8,794[a] |
| Oconee | 2,712 | 32.79% | 5,560 | 67.21% | -2,848 | -34.42% | 8,272 |
| Orangeburg | 10,456 | 65.09% | 5,607 | 34.91% | 4,849 | 30.18% | 16,063 |
| Pickens | 5,882 | 62.63% | 3,506 | 37.33% | 2,376 | 25.30% | 9,391[b] |
| Richland | 27,306 | 60.35% | 17,939 | 39.65% | 9,367 | 20.70% | 45,245 |
| Saluda | 2,524 | 64.17% | 1,409 | 35.83% | 1,115 | 28.34% | 3,933 |
| Spartanburg | 18,411 | 47.89% | 20,034 | 52.11% | -1,623 | -4.22% | 38,445 |
| Sumter | 7,729 | 67.19% | 3,775 | 32.81% | 3,954 | 34.38% | 11,504 |
| Union | 3,815 | 49.50% | 3,892 | 50.50% | -77 | -1.00% | 7,707 |
| Williamsburg | 4,810 | 68.15% | 2,248 | 31.85% | 2,562 | 36.30% | 7,058 |
| York | 7,292 | 46.62% | 8,346 | 53.36% | -1,054 | -6.74% | 15,642[c] |
| Totals | 309,048 | 58.89% | 215,699 | 41.10% | 93,349 | 17.79% | 524,755 |
Notes
References
- ^ "United States Presidential election of 1964 - Encyclopædia Britannica". Retrieved May 27, 2017.
- ^ "1964 Election for the Forty-Fifth Term (1965-69)". Retrieved May 27, 2017.
- ^ Phillips, Kevin P.; The Emerging Republican Majority, pp. 208, 210 ISBN 9780691163246
- ^ Mickey, Robert; Paths Out of Dixie: The Democratization of Authoritarian Enclaves in America's Deep South, 1944-1972, p. 440 ISBN 0691149631
- ^ Mickey; Paths Out of Dixie, p. 27
- ^ Frederikson, Kari; The Dixiecrat Revolt and the End of the Solid South, 1932-1968, p. 185 ISBN 9780807875445
- ^ Graham, Cole Blease and Moore, William V.; South Carolina Politics and Government, pp. 79, 81 ISBN 9780803270435
- ^ a b Mickey, Paths out of Dixie, p. 234
- ^ Donaldson, Robert H.; Liberalism's Last Hurrah: The Presidential Campaign of 1964, p. 255 ISBN 9780765611192
- ^ Heersink, Boris and Jenkins, Jeffery A.; Republican Party Politics and the American South, 1865-1968, p. 182 ISBN 1108850820
- ^ Associated Press; The World in 1964: History as We Lived It. The Word and Picture Chronicle of a Year We Lived, of Its Events, Large and Small, Humorous and Pathetic, of a Period of Time and the People who Occupied It; a Book for the Present and Future (1965), p. 167
- ^ Congressional Quarterly, Incorporated; CQ Congressional Quarterly Weekly Report, vol. 25 (1967), p. 1121
- ^ Johnson, Robert David; All the Way with LBJ: The 1964 Presidential Election, p. 168 ISBN 0521737524
- ^ Johnson; All the Way with LBJ, p. 224
- ^ ‘State By state Rundown Shows Johnson Way Out in Front’
- ^ Johnson; All the Way with LBJ, p. 275
- ^ "1964 Presidential General Election Results – South Carolina". Retrieved May 27, 2017.
- ^ "The American Presidency Project – Election of 1964". Retrieved May 27, 2017.
- ^ Phillips; The Emerging Republican Majority, pp. 263-265
- ^ "1964 Presidential Election Statistics". Dave Leip’s Atlas of U.S. Presidential Elections. Retrieved 2018-03-05.


