
List of parliamentary constituencies in Derbyshire
The ceremonial county of Derbyshire (which includes the unitary authority of Derby) is divided into 11 Parliamentary constituencies: three Borough constituencies and eight County constituencies.
Constituencies


From 2010
From the 2010 United Kingdom general election onwards, Derbyshire has been divided into 11 constituencies rather than the former 10. This involved the abolishment of West Derbyshire (UK Parliament constituency), the creation of Derbyshire Dales (UK Parliament constituency) and the re-introduction of Mid Derbyshire (UK Parliament constituency)
| Former Name | 2005 boundaries |
|---|---|
 |
| Current Name | 2010 boundaries |
|---|---|
 |
Proposed boundary changes
The Boundary Commission for England submitted their final proposals in respect of the Sixth Periodic Review of Westminster Constituencies (the 2018 review) in September 2018. Although the proposals were immediately laid before Parliament they were not brought forward by the Government for approval. Accordingly, they did not come into effect for the 2019 election which took place on 12 December 2019, and which was contested using the constituency boundaries in place since 2010.
Under the terms of the Parliamentary Voting System and Constituencies Act 2011, the Sixth Review was based on reducing the total number of MPs from 650 to 600 and a strict electoral parity requirement that the electorate of all constituencies should be within a range of 5% either side of the electoral quota.
On 24 March 2020, the Minister of State for the Cabinet Office, Chloe Smith, issued a written statement to Parliament setting out the Government's thinking with regard to parliamentary boundaries.[3] Subsequently, the Parliamentary Constituencies Act 2020[4] was passed into law on 14 December 2020. This formally removed the duty to implement the 2018 review and set out the framework for future boundary reviews. The Act provided that the number of constituencies should remain at the current level of 650, rather than being reduced to 600, while retaining the requirement that the electorate should be no more than +/- 5% from the electoral quota.
The Act specified that the next review should be completed no later than 1 July 2023 and the Boundary Commission formally launched the 2023 Review on 5 January 2021.[5] See 2023 Periodic Review of Westminster constituencies for further details.
Results history
Primary data source: House of Commons research briefing - General election results from 1918 to 2019[6]
2019
The number of votes cast for each political party who fielded candidates in constituencies comprising Derbyshire in the 2019 general election were as follows:
| Party | Votes | % | Change from 2017 | Seats | Change from 2017 |
|---|---|---|---|---|---|
| Conservative | 277,723 | 52.3% | 9 | ||
| Labour | 184,295 | 34.7% | 2 | ||
| Liberal Democrats | 38,253 | 7.2% | 0 | 0 | |
| Green | 13,658 | 2.6% | 0 | 0 | |
| Brexit | 14,487 | 2.7% | new | 0 | 0 |
| Others | 2,711 | 0.5% | 0 | 0 | |
| Total | 531,127 | 100.0 | 11 |
Percentage votes
| Election year | 1974
(Feb) |
1974
(Oct) |
1979 | 1983 | 1987 | 1992 | 1997 | 2001 | 2005 | 2010 | 2015 | 2017 | 2019 |
|---|---|---|---|---|---|---|---|---|---|---|---|---|---|
| Conservative | 37.5 | 33.9 | 40.9 | 41.5 | 43.2 | 41.5 | 29.5 | 31.1 | 30.1 | 36.5 | 39.4 | 48.7 | 52.3 |
| Labour | 47.6 | 48.4 | 45.6 | 34.9 | 36.2 | 43.4 | 53.6 | 50.0 | 43.9 | 34.5 | 36.5 | 44.5 | 34.7 |
| Liberal Democrat1 | 14.8 | 17.5 | 13.0 | 22.6 | 20.5 | 14.7 | 13.8 | 17.5 | 21.4 | 21.6 | 5.6 | 3.8 | 7.2 |
| Green Party | - | - | - | * | * | * | * | * | 0.6 | 2.8 | 1.2 | 2.6 | |
| UKIP | - | - | - | - | - | - | * | * | * | 3.2 | 15.4 | 1.6 | * |
| Brexit Party | - | - | - | - | - | - | - | - | - | - | - | - | 2.7 |
| Other | - | 0.2 | 0.5 | 1.0 | 0.1 | 0.4 | 3.1 | 1.4 | 4.6 | 3.7 | 0.2 | 0.2 | 0.5 |
11974 &1979 - Liberal Party; 1983 & 1987 - SDP-Liberal Alliance
* Included in Other
Seats
| Election year | 1974
(Feb) |
1974
(Oct) |
1979 | 1983 | 1987 | 1992 | 1997 | 2001 | 2005 | 2010 | 2015 | 2017 | 2019 |
|---|---|---|---|---|---|---|---|---|---|---|---|---|---|
| Conservative | 3 | 3 | 4 | 6 | 6 | 6 | 1 | 1 | 1 | 6 | 7 | 6 | 9 |
| Labour | 7 | 7 | 6 | 4 | 4 | 4 | 9 | 8 | 8 | 5 | 4 | 5 | 2 |
| Liberal Democrat1 | 0 | 0 | 0 | 0 | 0 | 0 | 0 | 1 | 1 | 0 | 0 | 0 | 0 |
| Total | 10 | 10 | 10 | 10 | 10 | 10 | 10 | 10 | 10 | 11 | 11 | 11 | 11 |
11974 &1979 - Liberal Party; 1983 & 1987 - SDP-Liberal Alliance
Maps
-
 1974 Feb
 -
1974 Oct
-
 1979
1979 -
 1983
1983 -
1987
-
1992
-
 1997
1997 -
 2001
2001 -
2005
-
 2010
2010 -
 2015
2015 -
 2017
2017 -
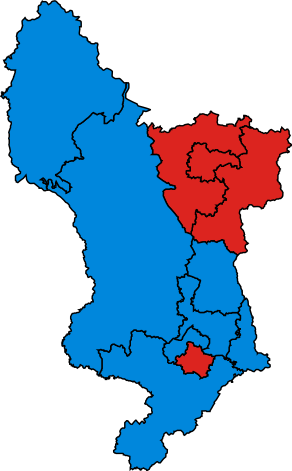
 2019
2019


Historical representation by party
A cell marked → (with a different colour background to the preceding cell) indicates that the previous MP continued to sit under a new party name.
1885 to 1918
Conservative Labour Liberal Liberal-Labour Liberal Unionist
1918 to 1950
Coalition Liberal (1918-22) / National Liberal (1922-23) Conservative Independent Labour Labour Liberal National Labour
1950 to 1983
1983 to present
Conservative Independent Labour Liberal Democrats
See also
Notes
References
- ^ Baker, Carl; Uberoi, Elise; Cracknell, Richard (2020-01-28). "General Election 2019: full results and analysis".
{{cite journal}}: Cite journal requires|journal=(help) - ^ a b c "Constituencies A-Z - Election 2019". BBC News. Retrieved 2020-04-22.
- ^ "Update: Strengthening Democracy:Written statement - HCWS183". UK Parliament. Retrieved 2020-04-20.
- ^ "Parliamentary Constituencies Act 2020".
{{cite web}}: CS1 maint: url-status (link) - ^ "2023 Review launched | Boundary Commission for England". Retrieved 2021-01-08.
- ^ Watson, Christopher; Uberoi, Elise; Loft, Philip (2020-04-17). "General election results from 1918 to 2019".
{{cite journal}}: Cite journal requires|journal=(help)