
Kingvale, California
Kingvale, California | |
|---|---|
| Country | |
| State | |
| County | Nevada, Placer |
| Area | |
| • Total | 0.971 sq mi (2.512 km2) |
| • Land | 0.962 sq mi (2.490 km2) |
| • Water | 0.009 sq mi (0.022 km2) 0.88% |
| Elevation | 6,118 ft (1,865 m) |
| Population (2010) | |
| • Total | 143 |
| • Density | 150/sq mi (57/km2) |
| Time zone | UTC-8 (Pacific (PST)) |
| • Summer (DST) | UTC-7 (PDT) |
Kingvale is a census-designated place (CDP)[2] in Placer County and Nevada County, California, United States.[3] The CDP straddles the border of the two counties, with Nevada County to the north and Placer County to the south. It is located near Soda Springs,[4] 5.5 mi (8.9 km) west of Donner Pass. Kingvale was listed on an official map as of 1955.[5] The population was 143 at the 2010 census.
Geography
According to the United States Census Bureau, the CDP covers an area of 1.0 square miles (2.5 km²), 99.12% of it land, and 0.88% of it water.
Climate
Kingvale has a warm-summer Mediterranean climate (Köppen climate classification Csb) that is characterized by warm (but not hot) dry summers, and mild to chilly rainy and/or snowy winters.
| Climate data for Kingvale, California | |||||||||||||
|---|---|---|---|---|---|---|---|---|---|---|---|---|---|
| Month | Jan | Feb | Mar | Apr | May | Jun | Jul | Aug | Sep | Oct | Nov | Dec | Year |
| Record high °F (°C) | 70 (21) |
75 (24) |
83 (28) |
89 (32) |
96 (36) |
103 (39) |
104 (40) |
105 (41) |
101 (38) |
91 (33) |
77 (25) |
70 (21) |
105 (41) |
| Mean daily maximum °F (°C) | 45 (7) |
51 (11) |
56 (13) |
64 (18) |
73 (23) |
82 (28) |
91 (33) |
89 (32) |
81 (27) |
70 (21) |
55 (13) |
46 (8) |
67 (20) |
| Daily mean °F (°C) | 32 (0) |
38 (3) |
41 (5) |
48 (9) |
56 (13) |
63 (17) |
70 (21) |
68 (20) |
61 (16) |
51 (11) |
40 (4) |
33 (1) |
50 (10) |
| Mean daily minimum °F (°C) | 19 (−7) |
23 (−5) |
26 (−3) |
31 (−1) |
38 (3) |
44 (7) |
49 (9) |
47 (8) |
40 (4) |
32 (0) |
25 (−4) |
20 (−7) |
33 (0) |
| Record low °F (°C) | −16 (−27) |
−16 (−27) |
-0 (−18) |
13 (−11) |
18 (−8) |
25 (−4) |
33 (1) |
24 (−4) |
20 (−7) |
8 (−13) |
1 (−17) |
−16 (−27) |
−16 (−27) |
| Average precipitation inches (mm) | 1.00 (25) |
0.90 (23) |
0.70 (18) |
0.40 (10) |
0.70 (18) |
0.40 (10) |
0.30 (7.6) |
0.20 (5.1) |
0.30 (7.6) |
0.40 (10) |
0.80 (20) |
1.00 (25) |
0.59 (15) |
| Average snowfall inches (cm) | 5.99 (15.2) |
5.00 (12.7) |
4.02 (10.2) |
0.98 (2.5) |
0.98 (2.5) |
0 (0) |
0 (0) |
0 (0) |
0 (0) |
0 (0) |
2.01 (5.1) |
4.02 (10.2) |
23 (58.4) |
| Source: http://www.myforecast.com/bin/climate.m?city=516782&metric=false | |||||||||||||
Demographics
The 2010 United States Census[6] reported that Kingvale had a population of 143. The population density was 147.4 people per square mile (56.9/km²). The racial makeup of Kingvale was 135 (94.4%) White, 1 (0.7%) African American, 1 (0.7%) Native American, 0 (0.0%) Asian, 1 (0.7%) Pacific Islander, 2 (1.4%) from other races, and 3 (2.1%) from two or more races. Hispanic or Latino of any race were 6 persons (4.2%).
The Census reported that 143 people (100% of the population) lived in households, 0 (0%) lived in non-institutionalized group quarters, and 0 (0%) were institutionalized.
There were 69 households, out of which 11 (15.9%) had children under the age of 18 living in them, 31 (44.9%) were opposite-sex married couples living together, 2 (2.9%) had a female householder with no husband present, 5 (7.2%) had a male householder with no wife present. There were 11 (15.9%) unmarried opposite-sex partnerships, and 2 (2.9%) same-sex married couples or partnerships. 22 households (31.9%) were made up of individuals and 5 (7.2%) had someone living alone who was 65 years of age or older. The average household size was 2.07. There were 38 families (55.1% of all households); the average family size was 2.37.
The population was spread out with 19 people (13.3%) under the age of 18, 4 people (2.8%) aged 18 to 24, 43 people (30.1%) aged 25 to 44, 63 people (44.1%) aged 45 to 64, and 14 people (9.8%) who were 65 years of age or older. The median age was 46.9 years. For every 100 females there were 127.0 males. For every 100 females age 18 and over, there were 134.0 males.
There were 340 housing units at an average density of 350.5 per square mile (135.3/km²), of which 57 (82.6%) were owner-occupied, and 12 (17.4%) were occupied by renters. The homeowner vacancy rate was 9.5%; the rental vacancy rate was 0%. 115 people (80.4% of the population) lived in owner-occupied housing units and 28 people (19.6%) lived in rental housing units.
As of the 2010 U.S. Census, 143 people resided in the CDP with 2 living on the Placer County side and 141 residing on the Nevada County side. Breaking the Hispanic and Latino population out, the racial makeup of the Placer County side of the CDP was 2 (100%) White. None of the population was Hispanic or Latino. The racial makeup of the Nevada County side was 138 (97.9%) White, 1 (0.7%) African American, 1 (0.7%) Pacific Islander, and 3 (2.1%) were of two or more races. 6 persons (4.3%) were Hispanic or Latino of any race.[7]
Notes
- ^ U.S. Census
- ^ U.S. Geological Survey Geographic Names Information System: Kingvale, California
- ^ U.S. Census Bureau
- ^ "NEVADA COUNTY, CALIFORNIA". calsign.com. Retrieved 2009-06-03.
- ^ Durham, David L. (1998). California's Geographic Names: A Gazetteer of Historic and Modern Names of the State. Quill Driver Books. p. 508. ISBN 1-884995-14-4.
- ^ "2010 Census Interactive Population Search: CA - Kingvale CDP". U.S. Census Bureau. Retrieved July 12, 2014.
- ^ "Census 2010: Table 3A — Total Population by Race (Hispanic exclusive) and Hispanic or Latino: 2010" (Excel). California Department of Finance. Retrieved March 22, 2010.
References
- U.S. Census Bureau. American Community Survey, 2011 American Community Survey 5-Year Estimates. American FactFinder. Retrieved 2013-10-21.
Municipalities and communities of Placer County, California, United States | ||
|---|---|---|
| Cities and towns |  | |
| CDPs | ||
| Unincorporated communities |
| |
| Ghost towns | ||
| Footnotes | ‡This CDP also has portions in an adjacent county or counties | |
Municipalities and communities of Nevada County, California, United States | ||
|---|---|---|
| Cities and towns | 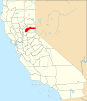 | |
| CDPs | ||
| Unincorporated communities | ||
| Ghost towns |
| |
| Footnotes | ‡This CDP also has portions in an adjacent county or counties | |