
Template talk:Weather box
| Weather Template‑class | |||||||
| |||||||

| This page is for discussing issues with this template. It isn't for general meteorological questions or for encyclopaedic content. If you have a question related to this template, please search the archives first to check whether it has been answered before: |
Index
|
||||||||||
|
This page has archives. Sections older than 400 days may be automatically archived by Lowercase sigmabot III when more than 5 sections are present. |
Please clarify "mean maximum" vs "average high"[edit]
The template has rows for "Mean maximum" and "Average high" temperatures, and similarly for "Mean minimum" and "Average low" temperatures.
From context I gather that the "mean maximum" temperature is the mean maximum for the month (or year, in the "Year" column), whereas the "average high" is the mean maximum temperature for the day in that month (or full year, for the "Year" column).
Unfortunately that isn't what the words mean. "Mean maximum" and "average high" are literally synonymous (except that "average" is less specific than "mean", but I gather that it's still being used in the sense of "mean").
I would suggest changing it to "mean monthly maximum" and "mean daily maximum", except for the nagging issue of the "Year" column. I'm not sure exactly how to deal with that issue. But I don't think the current solution addresses it either. --Trovatore (talk) 20:53, 10 March 2022 (UTC)
- Can we just get rid of "mean maximum" and "mean minimum" entirely? What meaningful info does it contribute to the general public that the record highs/lows + average highs/lows don't already provide? The fact that this is even a discussion suggests that these stats are already problematic to display. In my view, it's a waste of space. I'm tempted to visit every page with a weather box and remove "mean maximum" and "mean minimum" rows entirely. Meteoric91 (talk) 21:25, 24 July 2023 (UTC)
- How are they *not* useful information?? The lowest and highest temperature in a month can mean the diference between growth and death for plants; the USDA makes maps based on the mean yearly lowest temperature because it's extremely important for gardening. Your ignorance of the subject is no excuse for removing data or features. TekXS (talk) 16:22, 8 September 2023 (UTC)
- There's plenty of data that exists with varying degrees of importance. If it's "extremely important to gardening" as you claim, then place it on cities/town whose agriculture production is more significant. It does not need to be placed on virtually every single climate table. Meteoric91 (talk) 01:57, 10 September 2023 (UTC)
- How are they *not* useful information?? The lowest and highest temperature in a month can mean the diference between growth and death for plants; the USDA makes maps based on the mean yearly lowest temperature because it's extremely important for gardening. Your ignorance of the subject is no excuse for removing data or features. TekXS (talk) 16:22, 8 September 2023 (UTC)
One possibility: "Mean maximum" vs "Mean daily maximum". The reader still has to solve a problem, but at least receives a better clue via the word "daily". --Trovatore (talk) 20:56, 10 March 2022 (UTC)
- There has been some confusion over these terms in the past - e.g. see inconclusive discussions at:
- I get the impression that the terms are synonymous, but usage varies in different countries.
- For example, the Australian BoM's definitions (see Climate statistics for Australian locations - Definitions for temperature) use only "Mean maximum" and not "Average high".
- IMHO, the template parameter guidelines should be amended to say that "Mean maximum" is the only parameter that should be used for articles referencing sources using that term, and likewise, the "Average high" parameter should only be used for articles referencing sources using "Average high".
- It would be good to achieve consensus amongst editors, and clarity for our readers. (I'm currently trying to advise a newbie IP editor who is, mistakenly in my opinion, trying to use both parameters at once, and mislabelling BoM parameters in the process.) Cheers, Bahudhara (talk) 04:12, 8 June 2022 (UTC)
- I'm not sure what you mean by the "mean daily maximum" - surely you don't mean that the weatherbox should be expanded to have columns for each of the 365 days? Bahudhara (talk) 05:31, 8 June 2022 (UTC)
- Let's say June gets to a daily max temperature of 70 F for ten days, 75 F for ten days, and 80 F for ten days, and this happens every year. Then the mean daily maximum for June would be 75 F, the average of those values. However the mean monthly maximum for June would be 80 F, because every year, the maximum temperature for the whole month of June is 80 F. --Trovatore (talk) 17:22, 8 June 2022 (UTC)
- I'm not sure what you mean by the "mean daily maximum" - surely you don't mean that the weatherbox should be expanded to have columns for each of the 365 days? Bahudhara (talk) 05:31, 8 June 2022 (UTC)
- @Trovatore, using the Australian BoM's definitions, "mean daily maximum" in your example corresponds to "Mean maximum temperature", (the average daily maximum air temperature, for each month and as an annual statistic, calculated over all years of record), while "mean monthly maximum" in your example corresponds to "Decile 9 maximum temperature". I am not in favour of adding a new parameter, when existing parameter usage is already inconsistent.
- Environment and natural resources Canada's Glossary page also uses "Mean Maximum Temperature", and does not list or use "average high".
- The U.S. National Weather Service's Glossary page defines "Mean Daily Temperature" as "The average of the highest and lowest temperatures during a 24-hour period." The Glossary does not provide definitions for monthly "Mean Maximum Temperature", etc., but defines "Mean" as "The arithmetic average of a set of data (numbers), or the middle point between its two extremes."
- In the sources I've looked at, it seems that "Mean Maximum Temperature" is the standard scientific term used by national meteorogical organisations, while "average high" is used by popular-facing data aggregating websites such as Weather Atlas, and Weatherbase (which rounds figures to the nearest integer!). IMHO, these are inherently less reliable sources, as their methods of data acquisition/updating are not transparent. Cheers, Bahudhara (talk) 04:01, 9 June 2022 (UTC)
- I don't think mean monthly high temperature for June has anything to do with the 9th decile. It's just the answer to the question, "in an average year, what's the hottest it ever gets in June?" That's a reasonable question that I wouldn't mind seeing answered in a climate table. --Trovatore (talk) 04:51, 9 June 2022 (UTC)
- Good luck on finding a reliable source for that kind of data! Cheers,Bahudhara (talk) 05:38, 9 June 2022 (UTC)
- I wish I could reconstruct just what article I was looking at when I posted my first comment above. It looked like it had to be using the "mean maximum" row in the sense of "mean monthly/annual maximum", but "average high" in the sense of "mean daily maximum". Unfortunately I don't know which one it was now. --Trovatore (talk) 06:09, 9 June 2022 (UTC)
- See Tucson for a table that looks like it might be using these fields in the way I hypothesize above. --Trovatore (talk) 22:50, 14 June 2022 (UTC)
- Personally for the purposes of keeping things simple and transparent for our readers, would it not just be better to call the "Mean Maximum Temperature" as the average high? Jason Rees (talk) 23:25, 14 June 2022 (UTC)
- @Jason Rees: I'm not super-clear on what you're proposing. Can you look at the Tucson box I linked and say how you would change it? --Trovatore (talk) 01:45, 15 June 2022 (UTC)
- @Bahudhara: you might also look at the Tucson link I gave. --Trovatore (talk) 01:47, 15 June 2022 (UTC)
- Here's another one that seems to follow the pattern: Death Valley climate section. --Trovatore (talk) 15:55, 15 June 2022 (UTC)
- Personally for the purposes of keeping things simple and transparent for our readers, would it not just be better to call the "Mean Maximum Temperature" as the average high? Jason Rees (talk) 23:25, 14 June 2022 (UTC)
- See Tucson for a table that looks like it might be using these fields in the way I hypothesize above. --Trovatore (talk) 22:50, 14 June 2022 (UTC)
- I wish I could reconstruct just what article I was looking at when I posted my first comment above. It looked like it had to be using the "mean maximum" row in the sense of "mean monthly/annual maximum", but "average high" in the sense of "mean daily maximum". Unfortunately I don't know which one it was now. --Trovatore (talk) 06:09, 9 June 2022 (UTC)
- Good luck on finding a reliable source for that kind of data! Cheers,Bahudhara (talk) 05:38, 9 June 2022 (UTC)
- I don't think mean monthly high temperature for June has anything to do with the 9th decile. It's just the answer to the question, "in an average year, what's the hottest it ever gets in June?" That's a reasonable question that I wouldn't mind seeing answered in a climate table. --Trovatore (talk) 04:51, 9 June 2022 (UTC)
- In the sources I've looked at, it seems that "Mean Maximum Temperature" is the standard scientific term used by national meteorogical organisations, while "average high" is used by popular-facing data aggregating websites such as Weather Atlas, and Weatherbase (which rounds figures to the nearest integer!). IMHO, these are inherently less reliable sources, as their methods of data acquisition/updating are not transparent. Cheers, Bahudhara (talk) 04:01, 9 June 2022 (UTC)
- I agree that there is confusion, and the fact that this discussion exists is proof of that. I would rather use tooltips, though, as Ive proposed in the past, or else links to some page where we define what the terms mean. You can easily find mean maximum temperatures for US sites now, although I've always wondered if it came from Spanish-speaking countries first. —Soap— 21:29, 15 June 2022 (UTC)
- The terms mean maximum and average high are definitely not synonymous. Can we please just use tooltips to educate readers about the meanings of each term?
- I'm not at all in favor of using tooltips for this. That's an interface that is not significantly used in Wikipedia, so introducing it into the UX is a violation of the least surprise principle.
- @Soap:, if they are not synonymous, then what is the difference, exactly? Given that "mean" and "average" are synonyms, and "maximum" and "high" are in context also synonyms, you can see why people would think "mean maximum" is the same as "average high". --Trovatore (talk) 22:48, 15 June 2022 (UTC)
- I agree with you. It's confusing, yes. The World Book Encyclopedia made this mistake in the 1990's and I've been aware of it ever since. But this is also established terminology ...... mean monthly maximum means the highest temperature one can expect to feel in each month, and average daily high means the highest temperature one can expect to feel in each day in that month. Yes, we use shorter labels .... just like everyone else. Tooltips would be a good way to explain to users what the expanded definitions are, but if we are so set against tooltips, Im sure we can find some other solution. —Soap— 05:58, 16 June 2022 (UTC)
- I found this conversation because I googled the difference between mean max and mean daily max. I never took a class in meteorology, but I did major in Biology and I took a college level stats class and I don't understand what "mean max" means. Maybe you can add one of those little "i" links that opens a pop up that explains what it means and how it's different from mean daily max. 2600:6C55:6300:221:8C5C:C923:2433:FB13 (talk) 14:05, 27 January 2024 (UTC)
- AFAIK, daily high is the average highest temperature of the day (averaged among all the recorded days of that month). Mean maximum is the average highest temperature in the month/year. It's the difference between typical temperatures and (yearly) typical heat waves. IvicaInsomniac (talk) 20:51, 27 January 2024 (UTC)
- I've noticed "Mean maximum" and "Mean daily maximum" on Wikipedia lately. I don't understand what they mean. Can anyone provide a formula? 24.52.231.186 (talk) 03:01, 11 April 2024 (UTC)
- It looks like a lot of people are coming here with the exact same question--I know I am! Skimming through the comments above, it looks like there is quite the debate on this. I don't think anyone really cares about the hottest temperature reached in a given month, though most people would like to know what the typical high temperature for a month is--which is what has always been listed for 'average high'--I definitely think you should just keep it simple and continue with what has always been listed--'average low' and 'average high.' 98.97.141.180 (talk) 00:27, 26 April 2024 (UTC)
Solar exposure MJ/m2[edit]
There is no solar exposure energy row definition. This is most commonly expressed in SI units MJ/m2 (Megajoules per metre squared).
As solar energy is increasingly important this is now often collected by meteorology organisations.
Extreme snow depth[edit]
On the left label it shows that the metric unit in the parentheses is supposed to be in millimeters but in the table it gets converted to centimeters by default. How should this be fixed? Akamaikai (talk) 00:36, 23 February 2023 (UTC)
- A link to an example would be helpful. And please quote some text from an offending line to make it easier to find. Johnuniq (talk) 03:57, 23 February 2023 (UTC)
- I've never seen snow measured in mm. Most countries use cm for snow. CambridgeBayWeather, Uqaqtuq (talk), Huliva 16:24, 25 February 2023 (UTC)
- No like it's a problem in EVERY single weatherbox template on Wikipedia that uses imperial first and has a snow depth section. Go to a random weatherbox (one with imperial first) and in the parentheses in the table it will have the values in cm, while the label on the left says it should be in mm. I'm asking how to change that label on the left so that it says cm instead of mm. Akamaikai (talk) 18:36, 5 March 2023 (UTC)
- Also, some examples would be:
- Embarrass, MN
- Quemado, NM
- Dorset Township, Ashtabula County, OH
- Flaming Gorge, UT Akamaikai (talk) 18:47, 5 March 2023 (UTC)
- Please ask at WP:HELPDESK or WP:Teahouse about how to make a link to an article. I tried Embarrass, MN but cannot see a weather box there. Johnuniq (talk) 01:41, 6 March 2023 (UTC)
- Embarrass, Minnesota
- Quemado, New Mexico
- Dorset Township, Ashtabula County, Ohio
- Flaming Gorge, Utah Akamaikai (talk) 03:53, 9 March 2023 (UTC)
- Also, this problem only seems to happen if the snow depth data is precise to the tenth. If they are whole numbers it converts correctly. Akamaikai (talk) 03:58, 9 March 2023 (UTC)
- Thanks for the report. I have fixed the module so it should now be displaying correct results. The label has been changed to show that the snow depth is converted to cm not mm. It appears that error has been present since February 2021 when it was added. Please check a few articles (they might need to be purged) and let me know if there are any problems. Johnuniq (talk) 08:30, 9 March 2023 (UTC)
- Please ask at WP:HELPDESK or WP:Teahouse about how to make a link to an article. I tried Embarrass, MN but cannot see a weather box there. Johnuniq (talk) 01:41, 6 March 2023 (UTC)
Accumulation error[edit]
Problem: The annual total of the secondary measurement system is calculated by summing the rounded monthly figures, hence the rounding error for each month accumulates.
Example: Below, each month of 1mm (0.04 in) is correctly rounded to 0.0 in, but the annual total of 12mm (0.47 in) is shown to be 0.0 in, instead of 0.5 in, as it adds 12 times 0.0.
Solution: For the annual total of the secondary measurement system, convert the annual total of the primary measuring system.
| Climate data for this talk page | |||||||||||||
|---|---|---|---|---|---|---|---|---|---|---|---|---|---|
| Month | Jan | Feb | Mar | Apr | May | Jun | Jul | Aug | Sep | Oct | Nov | Dec | Year |
| Average precipitation mm (inches) | 1 (0.0) |
1 (0.0) |
1 (0.0) |
1 (0.0) |
1 (0.0) |
1 (0.0) |
1 (0.0) |
1 (0.0) |
1 (0.0) |
1 (0.0) |
1 (0.0) |
1 (0.0) |
12 (0) |
| [citation needed] | |||||||||||||
Hypnôs (talk) 00:01, 25 May 2023 (UTC)
- Thanks for the report. I think the idea was to make sure that the displayed numbers added up correctly. That is, so the Year value was the exact sum of the monthly values rather than being off-by-one due to rounding. I'll take a look at it later but I might need a reminder in a few days if no one else works out what to do. Johnuniq (talk) 08:53, 26 May 2023 (UTC)
| Climate data for this talk page | |||||||||||||
|---|---|---|---|---|---|---|---|---|---|---|---|---|---|
| Month | Jan | Feb | Mar | Apr | May | Jun | Jul | Aug | Sep | Oct | Nov | Dec | Year |
| Average precipitation mm (inches) | 1.0 (0.04) |
1.0 (0.04) |
1.0 (0.04) |
1.0 (0.04) |
1.0 (0.04) |
1.0 (0.04) |
1.0 (0.04) |
1.0 (0.04) |
1.0 (0.04) |
1.0 (0.04) |
1.0 (0.04) |
1.0 (0.04) |
12.0 (0.47) |
| [citation needed] | |||||||||||||
- Johnuniq & Hypnôs. The predominant user of inches for precipitation is the United States. The US standard is to have two decimal places for rain and total precip. I think that snow is to one decimal place. The WMO standard for mm (rain and total precipitation) and cm (snow) is to one decimal place. If you change the the mm in the example to 1.0 it works a bit better. CambridgeBayWeather (solidly non-human), Uqaqtuq (talk), Huliva 18:31, 1 June 2023 (UTC)
- Hypnôs. Just realised if you add "|year precipitation mm=12.0" instead of letting it calculate automatically it's a bit more accurate. The 0.04 is due to rounding from 1 mm (0.039 in). CambridgeBayWeather (solidly non-human), Uqaqtuq (talk), Huliva 21:12, 4 June 2023 (UTC)
Color aliases[edit]
Can we get color aliases for colour parameters? This could avoid unnecessary errors such as this. ~Kvng (talk) 14:55, 30 May 2023 (UTC)
- OK. I have worked out how to do this and will implement it soon after spending a few days contemplating changes to the module since I last examined it, and thinking about the #Accumulation error report above. Johnuniq (talk) 04:04, 31 May 2023 (UTC)
class="notheme"[edit]
@Seddon: You edited Module:Weather box/row on 3 April 2023 (diff) to add class="notheme" to each row of the table output. The edit summary was "Temporary fix to solve theming in Page Content Service". I don't want a full explanation but can you outline what that is about? Presumably the temporary fix is still needed? I'm planning to update the module soon and am trying to understand changes since I last examined the module. Johnuniq (talk) 04:49, 31 May 2023 (UTC)
- It has been confirmed (diff) that notheme is permanently wanted in Module:Weather box/row. Johnuniq (talk) 23:49, 7 December 2023 (UTC)
Colorful boxes 📦[edit]
While improving the article Climate of West Bengal, I added month wise extreme temperatures in the Indian state. The temperature boxes are colored according to their temperatures intensities. What command to use to color the rainfall boxes? Kolkatametro (talk) 00:20, 20 June 2023 (UTC)
- Similarly to the {{Weather box/colt}} that you used for temperatures, {{Weather box/colp}} can be used for precipitation. Johnuniq (talk) 01:21, 20 June 2023 (UTC)
- Okay. Thank you soo oooo much! Kolkatametro (talk) 23:30, 22 June 2023 (UTC)
possible sunshine[edit]
Currently Percent possible sunshine links to sunshine duration, the very same link target like two entries above, without being mentioned there (just in a reference for Yuma). I therefore would suggest to remove this link.-- U. M. Owen (talk) 14:53, 28 October 2023 (UTC)
- It would be nice to have a link to a typical article showing the issue to save us the trouble of hunting for it. Johnuniq (talk) 01:01, 29 October 2023 (UTC)
- @Johnuniq: Durham, NC for example (expanded, 2nd from bottom).--U. M. Owen (talk) 19:26, 29 October 2023 (UTC)
- So the problem is that the bottom of that weather box has a row for Mean monthly sunshine hours and another for Percent possible sunshine and they both link to Sunshine duration. Is that a significant issue? A problem is that the first row is due to entries like "Jan sun = 163.8" while the second comes from "Jan percentsun = 53". The weather box would have to do something quite clever to notice if both rows were present then suppress the duplicate link in the second. If only one row is specified, the link would have to be included. Johnuniq (talk) 04:10, 30 October 2023 (UTC)
- IMHO removing the link should not evoke significant feelings ;) Let me do a grep check on the database dump to see whether percentsun is present without sun at all. Relative data without the obvious reference seems odd.--U. M. Owen (talk) 13:22, 30 October 2023 (UTC)
- So the problem is that the bottom of that weather box has a row for Mean monthly sunshine hours and another for Percent possible sunshine and they both link to Sunshine duration. Is that a significant issue? A problem is that the first row is due to entries like "Jan sun = 163.8" while the second comes from "Jan percentsun = 53". The weather box would have to do something quite clever to notice if both rows were present then suppress the duplicate link in the second. If only one row is specified, the link would have to be included. Johnuniq (talk) 04:10, 30 October 2023 (UTC)
- @Johnuniq: Durham, NC for example (expanded, 2nd from bottom).--U. M. Owen (talk) 19:26, 29 October 2023 (UTC)
Solution to "mean maximum/minimum"[edit]
Hi,
Around 7 years ago, I added two new rows to the template: "mean maximum" and "mean minimum". This was after three years of delicate planning where I spent 18 hours a day perfecting the update.
Admittedly it has caused a bit of confusion because of its name, but I do think that there is general agreement that the data presented is at least somewhat useful. Since 2016 I've seen many articles, particularly of cities in the U.S., being updated to show mean maximum/minimum values. I'm very appreciative of that.
So, the problem mainly rests upon the confusing name. I admit that "mean maximum" and "average high", for example, are semantically synonymous. So I have two suggestions.
- The first is to rename the rows to something clearer. Maybe be consistent with "mean" and call them "mean maximum/minimum" instead of "average". I'm sure there are better two- or three-word suggestions.
- Additionally, whatever new name we could come up with, we could add underlined
{{abbr}}tooltips like this to clarify the term further. This was a suggestion mentioned in a thread from 2022 which has since died.
Let me know what you think.
Koopatrev (talk; contrib) 15:05, 5 December 2023 (UTC)
- Thanks for taking a look at this!
- My thoughts:
- I suggested a year and a half ago to use "mean maximum" versus "mean daily maximum". I think "mean daily maximum" is pretty clear. "Mean maximum" by itself is less clear, but from context, hopefully the reader can work out that it means the mean of the maximum value over the interval in the column (either a particular calendar month, or the whole year).
- I'm not thrilled about tooltips. They're a little-used UI in Wikipedia, and readers are not expecting them. Moreover they're mouse- and GUI-centric and completely lost in the print version. (Links are also lost in the print version, which is why the semantics of a page should never depend on link targets.) I suppose I don't mind that much if people want to include them as well (I mind a little, but not that much), but we should not rely on them for comprehension.
- I hope we can move on this! --Trovatore (talk) 17:36, 5 December 2023 (UTC)
- For now, change the description "average high" and "average low" to "mean daily maximum" and "mean daily minimum" respectively. Koopatrev.
(talk; contrib) 21:45, 6 December 2023 (UTC)
Edit request 6 December 2023[edit]
This edit request has been answered. Set the |answered= or |ans= parameter to no to reactivate your request. |
Please change "average high" and "average low" to "mean daily maximum" and "mean daily minimum", respectively. See discussion in the section above this one. --Trovatore (talk) 23:35, 6 December 2023 (UTC)
- I'm having a look at what is involved and have marked the edit request as done to temporarily remove it from the queue. If I disappear, replace "yes" with "no" in the template but I should be back within 24/48 hours. At any rate, it would be good to wait for more opinions before changing this widely used template. Johnuniq (talk) 03:35, 7 December 2023 (UTC)
- Thanks for taking a look. --Trovatore (talk) 07:14, 7 December 2023 (UTC)
- I have edited Module:Weather box/sandbox with what I understand is wanted. This changes two temperature labels: "Average high" → "Mean daily maximum" and "Average low" → "Mean daily minimum". Please check Template:Weather box/testcases and see if it is ok. Opinions on the desirability of this change are welcome. Johnuniq (talk) 07:46, 7 December 2023 (UTC)
- Thanks for taking a look. --Trovatore (talk) 07:14, 7 December 2023 (UTC)
With the above changes, there are now four "Mean daily" labels. The following shows an example parameter and the corresponding label.
|Jan high C = 12→ Mean daily maximum °C|Jan low C = -12→ Mean daily minimum °C|Jand sun = 5.2→ Mean daily sunshine hours|Jan light = 5.2→ Mean daily daylight hours
Johnuniq (talk) 08:04, 7 December 2023 (UTC)
- @Trovatore and Koopatrev: Please review the above. Nothing will happen if there is no active consensus. Also notifying some regulars: CambridgeBayWeather + Soap. Implementing the current sandbox would also make "x color" work as an alias for "x colour" as planned at #Color aliases above. For example, "rain color = green" and "rain colour = green" would both be accepted. Johnuniq (talk) 04:07, 9 December 2023 (UTC)
- Looks good to me. It matches up with the Enviroment Canada source I use. CambridgeBayWeather (solidly non-human), Uqaqtuq (talk), Huliva 04:17, 9 December 2023 (UTC)
- Looks good to me too. --Trovatore (talk) 06:02, 9 December 2023 (UTC)
- I like it. Also, I'd really like to update Canadian city weatherboxes to include the monthly/annual maximum and minimum data in question. I notice many US articles have it already. Is there some sort of algorithim that can calculate this data effectively, like Wolfram Alpha? Koopatrev (talk; contrib) 10:44, 9 December 2023 (UTC)
The changes discussed above are now live. Johnuniq (talk) 05:30, 10 December 2023 (UTC)
- Thanks Johnuniq ! — Preceding unsigned comment added by Trovatore (talk • contribs) 01:37, 11 December 2023 (UTC)
- Please change it back to "Average High" and "Average Low". The climate graphs have different sizes to eah box and it is very confusing with "Mean Minimum". Yuhjnmbh (talk) 08:08, 11 December 2023 (UTC)
- Please link to an article which shows the problem. Perhaps it depends on what screen is being used to view the article? I used a typical large monitor to view the testcases linked above and did not notice any size problems. Johnuniq (talk) 08:55, 11 December 2023 (UTC)
- I just looked at two recent pages you edited, Saint Arnaud, New Zealand and Mehamn, on my phone as well as mu large monitor and can't see a problem. CambridgeBayWeather (solidly non-human), Uqaqtuq (talk), Huliva 18:33, 11 December 2023 (UTC)
- 1: I did not make "Mehamn", I think I just made some typo fixes I don't exactly know
- 2: It doesn't make any major problems, but it gets so confusing with the "mean minimum" and the "mean maximum" as I mentioned before and takes up more space. Yuhjnmbh (talk) 08:06, 12 December 2023 (UTC)
- I mean, the concepts themselves are arguably a little bit confusing. I think the new names give you a much better chance of figuring out what is intended. The old names were more confusing, because "mean maximum" and "average high" appear to be synonymous. --Trovatore (talk) 08:11, 12 December 2023 (UTC)
- You can at least change "Mean Maximum" and "Mean Minimum" to "Mean Monthly Maximum" and "Mean Monthly Minimum" respectively. Yuhjnmbh (talk) 08:33, 12 December 2023 (UTC)
- I mean, the concepts themselves are arguably a little bit confusing. I think the new names give you a much better chance of figuring out what is intended. The old names were more confusing, because "mean maximum" and "average high" appear to be synonymous. --Trovatore (talk) 08:11, 12 December 2023 (UTC)
This whole mean high and mean low doesn't make any sense. It doesn't represent the true climate of a given region. Providence, RI shows a mean high of 14C in January. It rarely is that warm there in January. Average is a much better representation. The idea to change the template to kick out averages was a fundamentally wrong idea. — Preceding unsigned comment added by 104.226.53.66 (talk) 21:40, 27 December 2023 (UTC)
- "Average" and "mean" are synonymous, so not sure what you're getting at here. --Trovatore (talk) 04:42, 28 December 2023 (UTC)
- So can you clarify what each row actually means? We'll use Bismark as an example.
- July Mean Maximum: 98.3
- Does this mean, for the 1991-2010 period, this is the average of the highest temperature of the single hottest days of July?
- July Mean daily maximum 84.7
- Does this mean for the 1991-2010 period, the average highest temperature of every day in July?
- July Mean Maximum: 98.3
- Q T C 08:09, 26 January 2024 (UTC)
- Yes, I believe you have interpreted it correctly, provided by "the hottest days of July" you mean the July day in each year with the highest high temperature. Basically it's the average of the highest temperature reached at any time in July in each of the years. --Trovatore (talk) 02:41, 27 January 2024 (UTC)
- So can you clarify what each row actually means? We'll use Bismark as an example.
Possible sunshine header conflict with MOS:CONSISTENT[edit]
Hey, I was just wondering if there would be any opposition to changing the header row from "Percent of possible sunshine" to "Percentage of possible sunshine".
At the moment, the present wording is creating several MOS:CONSISTENT issues with articles written in English varieties that spell the word percent as per cent (ie. Commonwealth English). Changing its wording to "Percentage of possible sunshine" would rectify this issue. Leventio (talk) 17:44, 25 December 2023 (UTC)
- I tried that in the sandbox, links:
- Module:Weather box • Module:Weather box/sandbox • different (diff)
- Module:Weather box/row • Module:Weather box/row/sandbox • same content
- Module:Weather box/colors • Module:Weather box/colors/sandbox • different (diff)
- See the examples in Template:Weather box/testcases where the first weather box is from the current module ("Percent") and the second is from the sandbox ("Percentage"). The proposal looks good to me. Any thoughts? Johnuniq (talk) 01:06, 26 December 2023 (UTC)
- Looks good to me, though "possible sunshine percentage" would also work (though that's just a personal preference). Leventio (talk) 21:14, 27 December 2023 (UTC)
- I just noticed that the other day. Sounds good to me. CambridgeBayWeather (solidly non-human), Uqaqtuq (talk), Huliva 00:46, 3 January 2024 (UTC)
Automatically generate Köppen and Trewartha climate types based on weather box[edit]
May be added to show Köppen and Trewartha climate classification climate types and generate automatically, and accurate as possible based on climate table box. But users can also mark climate types manually when editing articles. It hat also have climate bordering if that city borders on two climate types. 217.76.12.207 (talk) 12:19, 30 December 2023 (UTC)
Auto width does not seem to work like you would expect[edit]
Tag to get opinions. Johnuniq, Koopatrev, Soap, Trovatore, IvicaInsomniac, The Grid.
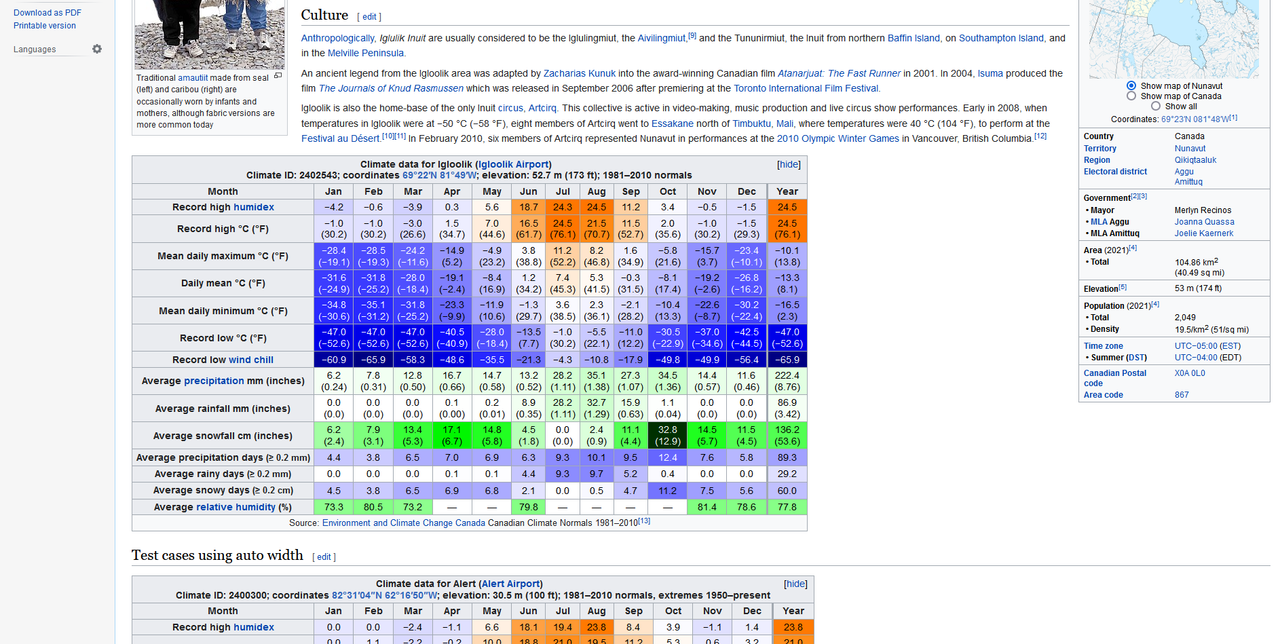
Can you look at User:CambridgeBayWeather/Auto width? All the weather boxes are using auto. To my mind the auto should reduce the width of the Igloolik weather box to fit to the left of the community infobox and not be forced down the page.
Further down the other weather boxes tend to be slightly different sizes. To me I would have thought that auto should make them all the same size. CambridgeBayWeather (solidly non-human), Uqaqtuq (talk), Huliva 19:39, 4 January 2024 (UTC)
- OK. This may be in part a browser issue. Chrome and Bing both show all the weather boxes the same size and it doesn't matter if I'm logged in or not. I used a second laptop and both show the width the same size but everything forces the Igloolik box down the page. CambridgeBayWeather (solidly non-human), Uqaqtuq (talk), Huliva 19:47, 4 January 2024 (UTC)
- These look like typical weatherboxes on Wikipedia to me, some are a few pixels wider than the other (~1%?), none occupy the full screen. The exception is Kuglugtuk, maybe because of the long text in the footer? Igloolik is only forced down by the infobox if I use the narrow text width on the new skin or make the browser window much smaller. In a maximized window on FHD screen it's just below the text. IvicaInsomniac (talk) 20:01, 4 January 2024 (UTC)
- Picture of Igloolik weatherbox on the classic skin, Firefox here. IvicaInsomniac (talk) 20:06, 4 January 2024 (UTC)
EXTREME snow depth[edit]
Does average EXTREME snow depth mean that the highest snow depth in one month is averaged in the given period?
If not, Why is it called Extreme snow depth? How often is this parameter used in data observations outside USA?
I saw weatherboxes in CIS countries having the same parameter but its not called extreme and is simply called average snow depth.PAper GOL (talk) 20:21, 15 February 2024 (UTC)
- Maybe it means typical maximum snow depth, I agree that the combination "average extreme" needs to go away. But I couldn't find any weatherboxes that use plain "average snow depth", Astana#Climate uses "average extreme snow depth" too for example.
- BTW where did "average high" and "average low" temperatures go? IvicaInsomniac (talk) 18:50, 19 February 2024 (UTC)
- I 'm not talking about the weatherbox itself. It's the source of the data which uses average snow depth without mentioning the EXTREME part. Major cities in CIS region have pogoda.ru as the source of the weather box and in those it simply says height.(at least when translated from Russian). There is one row for maximum Snow depth, but that's the extreme snow depth and not the average extreme depth. Here is a link to Tomsk's climate page for example.PAper GOL (talk) 19:36, 19 February 2024 (UTC)
- See the discussions above for the fate of "average high/low" temperatures. They were changed to mean daily maximum/minimum. This phrase seems to be more commonly used by meteorological agencies.PAper GOL (talk) 20:54, 19 February 2024 (UTC)
Highest minimum temperatures and lowest maximum temperatures per month[edit]
Can we make two new lines with highest minimum and lowest maximum temperatures per month? Is it possible?Weatherextremes (talk) 05:43, 28 March 2024 (UTC)
- Maybe, but do sources commonly discuss these measures? Are reliable figures available for a lot of places? I'm not sure more complexity would be welcomed. Johnuniq (talk) 07:18, 28 March 2024 (UTC)
- I've not seen that before. Is it common? CambridgeBayWeather (solidly non-human), Uqaqtuq (talk), Huliva 17:36, 28 March 2024 (UTC)
Possible color contrast problem in temperature row[edit]
The new dark mode contrast checker has highlighted three cells in the weather box at Buenos Aires#Climate as not passing the WCAG AA color contrast test. The three cells are:
<td style="background: #FF1800; color:#FFFFFF;" class="notheme">38.0<br>(100.4) </td>
<td style="background: #FF1100; color:#FFFFFF;" class="notheme">38.9<br>(102.0) </td>
<td style="background: #FF0600; color:#FFFFFF;" class="notheme">40.5<br>(104.9) </td>
These cells are all in the temperature row. Here's a link showing the WCAG test for the "38.0" cell. FWIW, switching the foreground text to black passes the test. Something may need adjustment. – Jonesey95 (talk) 20:23, 23 April 2024 (UTC)
Mean maximum and mean minimum[edit]
Not to rekindle old discussions, but I believe the wording of these two parameters are still vague. I think we should be using "mean monthly maximum" and "mean monthly minimum" per their daily counterparts. Uness232 (talk) 15:27, 26 April 2024 (UTC)
- That's about 92.31% correct. The problem is that those rows also have a yearly column. I agree that it's clearer with "monthly", except then it's incorrect when you get to the last column. I haven't thought of a good fix for this -- any suggestions? --Trovatore (talk) 21:51, 26 April 2024 (UTC)
- @Trovatore I see what you mean.
- In that case, wouldn't a tooltip be the best option? I am aware that you are not a fan, and I definitely see valid points in your reasoning, but I do not see a reason why a tooltip (specifically a mouseover) would be worse than leaving the terms unexplained.
- In general, I am personally very uncomfortable with the terminology of the weather box and its rather awkward use of technical language; but if that has to remain unchanged, I believe we should at least give the average reader some guidance. Uness232 (talk) 06:27, 28 April 2024 (UTC)
- Maybe the tooltip would actually make sense here. --Trovatore (talk) 19:10, 28 April 2024 (UTC)
- If using tooltips, returning average high/low for daily minimum/maximum would make those rows easier to distinguish from this one. In fact in some countries average highs and lows are computed based on three measurements per day so that statistics don't differ in method from historical records, so they're not daily minimums and maximums at all. IvicaInsomniac (talk) 04:43, 30 April 2024 (UTC)
- The old phrasing made no sense whatsoever. "Average high" and "mean maximum" are synonymous. --Trovatore (talk) 04:51, 30 April 2024 (UTC)
- I've seen "high" on many weather websites, but "daily maximum" only on Wikipedia and the higher of 14:00 and 21:00 measurements is unlikely to be close to the daily maximum. This is the procedure used to compile statistics in my country (to make them comparable to 1800's records). "High" and "low" are vague as necessary to be appropriate for this. IvicaInsomniac (talk) 05:11, 30 April 2024 (UTC)
- We could make it "average high" and "average daily high", I suppose. But hard no to using "average" vs "mean" or "high" vs "maximum" to distinguish the time periods they're averaged over. --Trovatore (talk) 05:12, 30 April 2024 (UTC)
- I don't think WMO has standards for monthly and yearly highs/lows. My country's service doesn't release this data publicly. I assume, where it's released, it's compiled from more recent sources and probably based on hourly measurements. 2*30 or 24*30 measurements is obviously a much more stable sample than two measurements. I don't think it's wrong to assume it's close to real maximum/minimum. IvicaInsomniac (talk) 06:31, 30 April 2024 (UTC)
- We could make it "average high" and "average daily high", I suppose. But hard no to using "average" vs "mean" or "high" vs "maximum" to distinguish the time periods they're averaged over. --Trovatore (talk) 05:12, 30 April 2024 (UTC)
- I've seen "high" on many weather websites, but "daily maximum" only on Wikipedia and the higher of 14:00 and 21:00 measurements is unlikely to be close to the daily maximum. This is the procedure used to compile statistics in my country (to make them comparable to 1800's records). "High" and "low" are vague as necessary to be appropriate for this. IvicaInsomniac (talk) 05:11, 30 April 2024 (UTC)
- The old phrasing made no sense whatsoever. "Average high" and "mean maximum" are synonymous. --Trovatore (talk) 04:51, 30 April 2024 (UTC)
- If using tooltips, returning average high/low for daily minimum/maximum would make those rows easier to distinguish from this one. In fact in some countries average highs and lows are computed based on three measurements per day so that statistics don't differ in method from historical records, so they're not daily minimums and maximums at all. IvicaInsomniac (talk) 04:43, 30 April 2024 (UTC)
- Maybe the tooltip would actually make sense here. --Trovatore (talk) 19:10, 28 April 2024 (UTC)