
User talk:Yurik/Archive 2016
| This is an archive of past discussions. Do not edit the contents of this page. If you wish to start a new discussion or revive an old one, please do so on the current talk page. |
Grahp module on it.wiki
I will check the change for 2.0 this week or next week (depends on free time :D ). My main change on it.wiki were made to localize the parameter name in italian, to add piechart (like here, to add support for named color palette different from the default color10 of vega. My module wrap also the chart in a div to align them to left/rigth of page and to add a legend (the problem with the automatic legend from vega is that you cannot have wikilink in them) - I'm not sure this was a good idea, on a second thought this complicated too much the code, but now is done.--Moroboshi (talk) 06:02, 12 December 2015 (UTC)
- Hello, I modified the pie chart function in the sandbox version of my module, but in the test page it:Template:Pie chart/test the pie chart is not generated and the page is categorized in the "Obsolete Vega 1.0" category. If I cut and paste the code generated by my module in the vega editor online here the pie chart show up. Some idea whats could be wrong ? (you can see the code generated in the test page).--Moroboshi (talk) 16:48, 24 December 2015 (UTC)
- It was a stupid error, I forgot to add "version: 2" to the graph code.--Moroboshi (talk) 17:22, 24 December 2015 (UTC)
- Chart template on it.wiki have parameter localized in italian, manage pie chart and have some additional function over the de.wiki version, so please do not copy de version over italian version.--Moroboshi (talk) 18:47, 7 January 2016 (UTC)
- It was a stupid error, I forgot to add "version: 2" to the graph code.--Moroboshi (talk) 17:22, 24 December 2015 (UTC)
- Moroboshi my appologies, I was copying it by hand to all wikis listed in the wikidata, and I thought i checked them all, but apparently i missed Italian. Do you think it might make sense to actually switch it to English? There will be much more work like this in the future by many developers in many languages, and using the common templates should benefit the whole world. Otherwise you will forever be playing a catch-up to something implemented in another language. And yes, we probably should think of how to make localization generic for the future, just that it shouldn't be inside the module. --Yurik (talk) 20:25, 7 January 2016 (UTC)
- Italian localization is not hardcoded, there is a configuration submodule (it:Modulo:Chart/Configurazione), but they are other change not compatible with the de.wiki version. In future I will check if can sync my version with the original version from de.wiki one, but at for at least two month I don't have the free time to work on it.--Moroboshi (talk) 05:09, 8 January 2016 (UTC)
Vega 1.0 to Vega 2.0
I've seen your advertence, but the extension is not very used in eswiki. There are not many users mantaining those templates, so a guide to updating the graphs would be useful.--FAR (talk) 13:12, 17 January 2016 (UTC)
- FAR, I recommend you use the {{Graph:Chart}} template on eswiki instead. It has already been copied - es:Template:Gráfico. The graph already supports pie charts, please update the documentation. --Yurik (talk) 19:46, 17 January 2016 (UTC)
An apology
Hi Yurik, I want to apologize to you for restoring that graph yesterday on Talk:Female genital mutilation. I just reacted to seeing you change someone else's post. It was only later that I realized you had created the graphs, and you were just trying to fix how they were presented, so I felt like an idiot. So I'm sorry, and thank you again for creating them. They're going to be very helpful. All the best, SarahSV (talk) 06:34, 18 February 2016 (UTC)
- SlimVirgin, don't worry, it's all in good faith :) --Yurik (talk) 12:07, 18 February 2016 (UTC)
Экспорт-импорт m:User:Yurik/US Politics Real Time
Хотел новость на основе m:User:Yurik/US Politics Real Time в Русских Викиновостях создать, но что-то застопорилось ещё на первом шаге: n:ru:Шаблон:Graph:PageViews. У нас там не подключено это расширение? Что для этого нужно сделать? И второй вопрос. Можно сразу улучшить этот шаблон, чтобы он выдавал pageviews с-до определённых таймстампов. Для новостей нужно чтобы статическая картина была на момент публикации и дальше не менялась. --sasha (krassotkin) 13:21, 19 February 2016 (UTC)
- (answering in English because other languages might have the same problem)
- Krassotkin, There is a bug in pageviews API - it can be made to works with article names that contain a '/' (slash) or with ' ' (space), but not with both. If you remove the word "WIKI", you will have to specify all titles with underscores instead of spaces. This issue should be fixed soon. Also, don't translate the template, use a /doc page, hope we can automate page sharing between wikis soonish. --Yurik (talk) 14:54, 19 February 2016 (UTC)
- Krassotkin the path issue has been fixed. Make sure the "urlencoding" uses "PATH". I've updated several wikis, but more might need updating --Yurik (talk) 22:07, 22 February 2016 (UTC)
- Thank you. Updated. --sasha (krassotkin) 08:13, 23 February 2016 (UTC)
- In my opinion It would be good to add parameters of #tag:graph (m:Extension:Graph) to (named?) parameters of m:Templage:Graph:PageViews. For example, I use another width and height (diff). But perhaps some will use a different type of chart, etc. --sasha (krassotkin) 08:13, 23 February 2016 (UTC)
- By the way, is "metrics" standard/stable feature? --sasha (krassotkin) 08:13, 23 February 2016 (UTC)
- Krassotkin the path issue has been fixed. Make sure the "urlencoding" uses "PATH". I've updated several wikis, but more might need updating --Yurik (talk) 22:07, 22 February 2016 (UTC)
nl:wikivoyage
Please read https://nl.wikivoyage.org/wiki/Wikivoyage:Reizigerscaf%C3%A9#Maps for Wikivoyage I think we cannot accept the changes from Mapnik to Wikimedia. --FredTC (talk) 07:39, 24 February 2016 (UTC)
Minutes
I think that posting these was very helpful. Has the development team considered contributing to the Signpost once every so many weeks? This would probably be the most effective way to reach the community. —Ruud 09:29, 25 February 2016 (UTC)
- Ruud, I wouldn't speak for the whole team, but I would love to make a post on what I'm involved in :) --19:19, 25 February 2016 (UTC)
About error on the map
I find about error on the map (from Chinese Wikivoyage), This change for part of Template:Mapframe and Template:PoiMap2. But as seen in this article, The map maker is error, the maker used for {{Marker|type=orange|lat=25.047781 | long=121.516898| image=TMS.JPG| name=台北}},How to solve this problem?--Yuriy kosygin (talk) 16:02, 24 February 2016 (UTC)
- @Yuriy kosygin:, something seems to be broken with the wmflabs maps - it uses a https://tools.wmflabs.org/wikivoyage/w/ico24/orange.png image, which does not exist. Have you seen this issue before? I don't think this is related to switching to a different tile layer, but i will take a look in a bit. --Yurik (talk) 19:18, 25 February 2016 (UTC)
- Okay, I know where the problem!--Yuriy kosygin (talk) 15:45, 26 February 2016 (UTC)
Notification about disabling the Wikipedia collections tool
Thank you for using the collections feature in Wikipedia beta! Due to technical and moderation issues, we will be turning off this experimental feature. Your collections will be available for viewing and export until March 1st. If you would like to save your collection as links on a special Wikipedia page, please fill out the following [http://goo.gl/forms/ZyYQm6uu7e form]. If you are interested in giving your feedback about Wikipedia Collections please do so here.
Thanks,
Jon Katz
Product manager, Wikimedia Foundation
Jkatz (WMF) (talk) 23:52, 26 February 2016 (UTC)
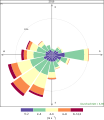
Wind roses with <graph>?
-
 Done with R
 -


Hi Yurik,
is there any way to create wind rose plots? The data has the form TIME–WINDSPEED–WINDDIRECTION.--Kopiersperre (talk) 11:37, 25 February 2016 (UTC)
- @Kopiersperre:, why is there "TIME" component? Is that the total time the wind has been blowing in the given direction with the given speed? I see no reasons why Vega wouldn't be able to plot it. Maybe Jhoffswell might have some ideas on how to do it? --19:26, 25 February 2016 (UTC)
- TIME is the hour of the measurement. And I know, that I shouldn't bother you with such graphical tasks. --Kopiersperre (talk) 21:30, 25 February 2016 (UTC)
- @Kopiersperre:, Jhoffswell has sent me a graph that i modified a bit. With some more work we could add axis and all other marks. --Yurik (talk) 05:38, 27 February 2016 (UTC)
| Graphs are unavailable due to technical issues. There is more info on Phabricator and on MediaWiki.org. |
Get data from RESTBase API to wikipages
In the development of your ideas I'm experimenting with the inclusion of statistics of articles from RESTBase API to wikipages: n:ru:Категория:Статистика страниц (for example: n:ru:Викиновости:Статистика страниц/Forbes: Рейтинг самых богатых людей мира 2015 года). Is there any way to get the data in a table format (or raw JSON; directly, templates, lua modules or through your extension)? --sasha (krassotkin) 15:11, 22 February 2016 (UTC)
- Krassotkin I don't think there is a way to get that data via anything other than via the graph ext at this point. --Yurik (talk) 15:31, 22 February 2016 (UTC)
- How can we initiate to add this functionality? --sasha (krassotkin) 08:13, 23 February 2016 (UTC)
- krassotkin, I would add a task to phabricator - all requests are tracked and discussed there. It has to be a very clearly defined request - what data, from what api, should be available to what system, and possibly a sample of how it will be used. It may change many times, but at least it will get the discussion going. --Yurik (talk) 17:04, 27 February 2016 (UTC)
Delete
Hi Yurik, sorry I realized too late that I was not supposed to edit your sk talk page. Asking you here then: Do you want your talk page deleted (in addition to the User Page)? Thanks!--Jetam2 (talk) 20:32, 27 February 2016 (UTC)
- @Jetam2: hi, thanks for asking, please delete only the user page. The talk page should continue to have the warning. Thanks! --Yurik (talk) 23:02, 27 February 2016 (UTC)
- Okay. The page was deleted, the talk page was not. Feel free to revert my discussion there.--Jetam2 (talk) 11:53, 28 February 2016 (UTC)
Pageviews
Hi again! One my colleague gave me one great idea. We (lvwiki) could list top-N (I think, some 6-10, but that doesn't matter, how much) visited articles in last week/2 weeks/month (also not so important what period) in the main page at Latvian Wikipedia. It could be done with <graph>, right? We actually don't need graph itself, but we can use pageview API there, that's why I was thinking about <graph>. OK, we could use some graph (you know, probably something fancy like File:Vital articles tag cloud.png or Wikipedia:Vital articles/TreeMap, but clickable), if we get some extra space at our main page. But the main idea (and goal) is to get automatically updated list of top-N visited articles in some period of time. Maybe some Lua module, which uses data from graph extension, which uses pageviews (as work-around)? Thoughts? --Edgars2007 (talk/contribs) 14:29, 1 March 2016 (UTC)
- @Edgars2007:, yes, you can plot a graph of the top articles (e.g. as a pie chart, or some other visualization). At this moment the "click" functionality in "interactive mode" is off because of a security issue, but I hope I can get it fixed soon. Still, since the graph is an image, in a regular (non-interactive) mode it won't be clickable until we implement SVG support, which might take a bit longer. But you do give me an interesting idea, thank you! --Yurik (talk) 14:42, 1 March 2016 (UTC)
Odp:broken graph (comment on my talkpage at plwiki)
Hi, graphs in Demografia powiatu template on plwiki work normally for me; and the Wykres template, which is used there, uses {{#graph:}} instead of <graph>...</graph>, so wikimarkup should not be problem for it's usages anyway. Karol Szapsza (dyskusja) 21:09, 1 mar 2016 (CET)
- Thanks! --Yurik (talk) 20:15, 1 March 2016 (UTC)
New maps for WV
Thanks for your message at the german WV and your efforts to improve the maps for WV. Unfortunatly I didnt follow the discussions and the progress of this project. I welcome every improvement. I compared the map layer M and W. So I like the already included informations for travellers of layer M. My question: Is it possible to show a similar layer after switching to the new maps ? I guess that Google cant translate "Extrawurst" (meaning seperate or own way) and "Senf" (meaning a post on discussion wich could be helpfull or not.) ;-) Greetings --Bernello (talk) 11:57, 25 February 2016 (UTC)
- Bernello, thx, answered in the wikivoyage discussion. --Yurik (talk) 19:28, 25 February 2016 (UTC)
- Hi Yurik, what is your plan to improve the map? Is it possible to copy the mapnik-map to wikimedia? Are there any problems with licenses? How can I help you? Greetings, --Bernello (talk) 11:06, 5 March 2016 (UTC)
- Bernello, there is really no way to "copy" mapnik map because that map uses outdated raster technology that everyone is moving away from. Our maps servers contain all the same map data, but we simply don't have the code (SQL+styling) to draw them. Yet, to make it happen, we need to decide WHAT needs to be drawn first. This is actually the hardest problem - maps can be drawn in a millions of different ways depending on the application. See style gallery. Even for WV, many users said they like our new maps better because they are "cleaner" and "less crowded" - which lets users concentrate on the information relevant to the article, rather than showing every tree and park bench. You could really help by discussing with the community the style definition. We keep all requests at the #map-styles dashboard to give you some ideas. Also take a look at the Maps - future plans. Thanks! --Yurik (talk) 02:48, 6 March 2016 (UTC)
- Hi Yurik, what is your plan to improve the map? Is it possible to copy the mapnik-map to wikimedia? Are there any problems with licenses? How can I help you? Greetings, --Bernello (talk) 11:06, 5 March 2016 (UTC)
pl:documentation template
On the Polish wiki beyond firmly justified exceptions, we do not use redirects in the template space. It seems to me, in a few days this redirect will be removed by one of another sysops. Malarz pl (talk) 08:14, 8 March 2016 (UTC)
- Malarz pl, I think you should raise this as a concern, because every single other wiki i know uses a template redirect for the common "universal" templates. This allows easy copy/pasting of code between wikis. So unless Polish wiki never wants to use shared graphs and other similar complex templates from other wikis, or unless Polish wiki always wants to do it by hand at a huge human cost, I think it should allow general template redirects like {{Documentation}} and others. --Yurik (talk) 12:31, 8 March 2016 (UTC)
pageview graph again
hi.
so (hewiki users), we found it useful to be able to also define "platform", so we can look at page views from mobile, desktop, or all. please see this change: he:Special:Diff/18249499. please consider doing something similar in PageView graph template. if you do, we'll be able to re-synch the version in hewiki.
thanks, peace - קיפודנחש (aka kipod) (talk) 16:24, 10 March 2016 (UTC)
- קיפודנחש (aka kipod), thx, I would recommend simply changing the graph at mediawiki.org, and updating the doc there. Than someone will copy it to all other wikis. As for the actual graph - do you ever see this graph used alone? Like showing just the mobile usage, or just the desktop? Or do you think they will be shown together side-by-side - so that users can see both mobile and desktop? If later, I did something like that here, and I can improve it to the same quality as the pageviews graph. --Yurik (talk) 16:44, 10 March 2016 (UTC)
- thanks. seems that User:IKhitron (an admin on hewiki) already did update the mw version. as to your question: i think it's possible that someone will want to show mobile-only or desktop-only view stats, but i agree that probably being able to see both on same graph is more useful. peace - קיפודנחש (aka kipod) (talk) 19:17, 10 March 2016 (UTC)
- I don't so sure that the same graph is a good idea, because the range is too different - we almost can't see the mobile-app data on the graph with desktop data - it's too low. IKhitron (talk) 19:36, 10 March 2016 (UTC)
- thanks. seems that User:IKhitron (an admin on hewiki) already did update the mw version. as to your question: i think it's possible that someone will want to show mobile-only or desktop-only view stats, but i agree that probably being able to see both on same graph is more useful. peace - קיפודנחש (aka kipod) (talk) 19:17, 10 March 2016 (UTC)
log scale for Template:Graph:Chart ?
as long as i'm bothering you here, i wanted to ask for something else, this time regarding Module:Graph: can you please teach the chart() function to use logarithmic scale? from the code, it seems that "scaleType=log" is only possible for map(). this can be limited to line chart, i think - it's completely meaningless for pie, and i never saw area graph using log (it's almost like "if it can stack, it can't log). maybe allow new "type" - like "area/stackarea", you can have "line/logline". peace - קיפודנחש (aka kipod) (talk) 21:16, 10 March 2016 (UTC)
- ping? קיפודנחש (aka kipod) (talk) 23:16, 13 March 2016 (UTC)
- קיפודנחש (aka kipod), i am a bit swamped at the moment - we are trying to launch the new maps service. I will try to get to it, but no promises. Already doing 90hr/week, not very healthy :) --Yurik (talk) 00:01, 14 March 2016 (UTC)
- thanks. sorry for bothering you - absolutely agree that 90 is way way too much. peace - קיפודנחש (aka kipod) (talk) 00:08, 14 March 2016 (UTC)
- קיפודנחש (aka kipod), i am a bit swamped at the moment - we are trying to launch the new maps service. I will try to get to it, but no promises. Already doing 90hr/week, not very healthy :) --Yurik (talk) 00:01, 14 March 2016 (UTC)
Graph in catalan wikipedia
Thanks for warning me of the broken template. I have tried your suggestion but I can't get it to work... I you be grateful if you could take a look.
Thanks --Gerardduenas (talk) 11:27, 13 March 2016 (UTC)
- Gerardduenas, I fixed the syntax issue, but the graph still needs to be migrated to vega2, because vega1 does not support external URLs. Could you create a new template at mediawiki.org - this way it will be more accessible for all wikis, and explain to me what it should do, and I will fix it. Please use the same style as in Template:Graph:PageViews to structure the new graph. Thanks! --Yurik (talk) 15:54, 13 March 2016 (UTC)
- Hi Yurik, I've done some clean up to the template and done my best to migrate it to vega 2 but somewhere there's a syntax error and I can't find it nor I have the time to do it. I've created it in mediawiki. My idea was to add a link in MediaWiki:Histlegend that would show/hide a graphic view of the history. Thanks for all your work! --Gerardduenas (talk) 17:44, 13 March 2016 (UTC)
- Gerardduenas, fixed and improved a bit. Also, see Special:GraphSandbox -- very useful if you want to design graphs in real time. It understands wiki syntax as well. --Yurik (talk) 22:49, 13 March 2016 (UTC)
- Thanks a lot. I've proposed in cawiki to implement it in histlegend, we'll se what they say about it. I tried to use the GraphSandbox but couldn't find some of the errors. Does that lyra that you recommended me work in vega2? --Gerardduenas (talk) 18:09, 14 March 2016 (UTC)
- Gerardduenas i am not sure lyra has been updated to vega2 yet (work in progress from what i heard). As for the sandbox - you get slightly more info than with pagepreview, plus the ability to type and see at the same time is very useful, especially when you can remove large chunks of the graph to see if the rest works ok. But yes, needs to be revised a lot, to improve the error reporting, etc. I have high hopes :) --Yurik (talk) 18:33, 14 March 2016 (UTC)
- I'd offer you to try and help with the graph development but I've taken a wikivacation this last months to study hard... I'll come round again in two months and see where I can help ;) --Gerardduenas (talk) 17:23, 15 March 2016 (UTC)
- Gerardduenas i am not sure lyra has been updated to vega2 yet (work in progress from what i heard). As for the sandbox - you get slightly more info than with pagepreview, plus the ability to type and see at the same time is very useful, especially when you can remove large chunks of the graph to see if the rest works ok. But yes, needs to be revised a lot, to improve the error reporting, etc. I have high hopes :) --Yurik (talk) 18:33, 14 March 2016 (UTC)
- Thanks a lot. I've proposed in cawiki to implement it in histlegend, we'll se what they say about it. I tried to use the GraphSandbox but couldn't find some of the errors. Does that lyra that you recommended me work in vega2? --Gerardduenas (talk) 18:09, 14 March 2016 (UTC)
- Gerardduenas, fixed and improved a bit. Also, see Special:GraphSandbox -- very useful if you want to design graphs in real time. It understands wiki syntax as well. --Yurik (talk) 22:49, 13 March 2016 (UTC)
- Hi Yurik, I've done some clean up to the template and done my best to migrate it to vega 2 but somewhere there's a syntax error and I can't find it nor I have the time to do it. I've created it in mediawiki. My idea was to add a link in MediaWiki:Histlegend that would show/hide a graphic view of the history. Thanks for all your work! --Gerardduenas (talk) 17:44, 13 March 2016 (UTC)
Graphs
Hi! First of all, thanks for developing the Graph extension. It's really cool :) Currently I have one question (but have some more :) ). What I'm doing wrong here? It shouldn't look like that (double years and line ends in 2014)? And I'm pretty sure, the double year problem didn't exist some few weeks (or months) ago.
| Graphs are unavailable due to technical issues. There is more info on Phabricator and on MediaWiki.org. |
I basically would like to get such graph. BTW, some gridlines and those points (for exact values) also would be cool :) --Edgars2007 (talk/contribs) 17:44, 26 February 2016 (UTC)
- @Edgars2007: Mps usually would know much better about the graph (Mps is the author of the Graph:Chart module), but in this case - you forgot to have as many "y" values as "x" values. I fixed it above. --Yurik (talk) 19:07, 26 February 2016 (UTC)
- OK, that was a silly mistake, yes :) But still, if I count correctly, this contains six values for each (this is a little bit different from what is used in template above):
|x=2010,2011,2012,2013,2014,2015|y=5618,6063,6414,6321,6320,6516- but I don't have the desired result.--Edgars2007 (talk/contribs) 19:27, 26 February 2016 (UTC)
- @Edgars2007: I'm not sure what problem you are seeing. Here are two graphs with your data, and the second one uses yAxisMin=0. What graph would you like to get? --Yurik (talk) 20:45, 26 February 2016 (UTC)
| Graphs are unavailable due to technical issues. There is more info on Phabricator and on MediaWiki.org. |
| Graphs are unavailable due to technical issues. There is more info on Phabricator and on MediaWiki.org. |
- Oh, didn't notice
|yAxisMin=. Currently it's not important, but thanks. Well, in both graphs there are double years from 2011 till 2015. I hope, you understand yourself, that it shouldn't be like that. What I would like to get? I just want to get rid of those double years, not screwing up the line (with 0). --Edgars2007 (talk/contribs) 20:57, 26 February 2016 (UTC)
- Oh, didn't notice
- @Edgars2007: ah, I see the problem. This is due to x axis using "linear" instead of timeline (this is a limitation of the graph that either Mps or I should fix). Because its linear, it simply treats the year as a regular number, and injects "2011.5, 2012, 2012.5, ..." on the bottom. But when it draws those numbers, it uses "d" format, which cuts away the fraction, so you end up with duplicate values. I will try to get to it soonish. --Yurik (talk) 02:20, 27 February 2016 (UTC)
- OK, thanks. --Edgars2007 (talk/contribs) 08:36, 27 February 2016 (UTC)
- @Edgars2007: ah, I see the problem. This is due to x axis using "linear" instead of timeline (this is a limitation of the graph that either Mps or I should fix). Because its linear, it simply treats the year as a regular number, and injects "2011.5, 2012, 2012.5, ..." on the bottom. But when it draws those numbers, it uses "d" format, which cuts away the fraction, so you end up with duplicate values. I will try to get to it soonish. --Yurik (talk) 02:20, 27 February 2016 (UTC)
From your answer I understand, that using timeline is possible with graph, but this isn't working. It's the same as that template except for x axs, where is "type": "timeline"
| Graphs are unavailable due to technical issues. There is more info on Phabricator and on MediaWiki.org. |
Or I misunderstood your answer? --Edgars2007 (talk/contribs) 22:01, 15 March 2016 (UTC)
- Edgars2007, I changed the above - type: timeline->time, removed format, added an expression to create a date value, and re-arranged the order. Use Special:GraphSandbox for experimentation. --Yurik (talk) 11:13, 16 March 2016 (UTC)
- Thanks! Yes, my piece of Vega was just a result of ExpandTemplates, which was then formatted by GraphSandbox, which I noticed few days ago. --Edgars2007 (talk/contribs) 11:33, 16 March 2016 (UTC)
Question about graphs
Hello, could you take a look at second graph on pl:PKP_Intercity#Historia_sp.C3.B3.C5.82ki? The values can be negative or positive. With showValues=offset:4, when the values are negative the numbers are displayed on the columns. Can we make the numbers to always appear outside the columns? Sorry for bad English. Tufor (talk) 23:28, 19 March 2016 (UTC)
Kartographer documentation
Yurik, you posted a request for help regarding translation of the text on this page. Where on meta do you want the various local versions of the text? Kindly reply on Wikivoyage. Riggwelter (talk) 13:28, 23 April 2016 (UTC)
Your bot on Ladino Wikipedia
We are looking to clean up inactive bots on Judeo-Spanish (Ladino) Wikipedia. Your bot lad:User:YurikBot has been inactive for over five years. Consistent with the bot policy of this wiki, we will remove the bot permission from your bot account unless you respond within one week at this page. Thank you for your prompt attention. StevenJ81 (talk) 17:09, 25 April 2016 (UTC)
Most expensive paintings graph
Yurik, I believe your Template:Graph:Most Expensive Paintings used to show different shapes for Van Gogh, Picasso, Warhol and Rothko. In Safari ad Chrome, at least, these are not there anymore, and the legend now makes it appear to people (see today's edits at List of most expensive paintings) that Van Gogh painted before 1700, Picasso between 1850 and 1900, etc. Is it possible for you to fix that? Thanks, Afasmit (talk) 00:15, 7 May 2016 (UTC)
Some ideas about tabular data
Hi! I was testing this, and have some ideas. Thanks for reading!--Eloy (talk) 17:39, 20 April 2016 (UTC)
- Eloy, this is awesome!!! Could you copy those comments to a new subsection at [1] - this way others could comment, and we don't accidentally loose them if i rebuild the wmflabs instance. --Yurik (talk) 18:33, 20 April 2016 (UTC)
- Hi! I'll try to use Phabricator, but I never used before, so it may take some time, haha. Also, I do know PHP, JavaScript, etc., but I never collaborate in any Wikimedia code, so I've no idea how to help. Do you know some doc to start?--Eloy (talk) 01:07, 10 May 2016 (UTC)
Mapframe on Wikinews
For some reasons Wikinews primarily needs this extension. --sasha (krassotkin) 06:12, 17 June 2016 (UTC)
Maps trial has begun!
Hi Yuri,
I plan to be a demonstration of Kartographer during wikiconfr (19 of August 2016, Paris). I wonder if there is any tutorial somewhere explaining how to use new feature (espacially new features).
Can you confirm me that everything is usable on wikivoyage.fr?
Regards,
--Benoît Prieur (talk) 08:34, 30 June 2016 (UTC)
- Benoît Prieur, absolutely! Help page has some info, and you can check out the discussions on English Wikivoyage community board - lots of details there. We are currently migrating the layer button customizations into the core repo, so you will be able to gain its functionality without copying js/css. You will only need to specify which external map providers community decides to use. --Yurik (talk) 12:15, 30 June 2016 (UTC)
- Thanks a lot Yurik.
- Actually I'd like to present several maps including in the wiki. For example:
- Extract a book from wikisource, parse every localizable places and draw the itinerary follew by the hero;
- Visualize the map of use of a word defined on wiktionary;
- etc. find a fun idea by project. Indeed entry data will be pushed on my personnal user space on wikivoyage but it can show the huge interest of Kartographer.
- Bye. --Benoît Prieur (talk) 12:40, 30 June 2016 (UTC)
- Benoît Prieur, sounds like an awesome presentation :) Check out this little demo I just did - I hope it will be in production in a few weeks. It takes data from Wikidata, adds geo shapes, and shows it using the graph extension :) --Yurik (talk) 16:58, 30 June 2016 (UTC)
Hi Yurik,
With Kartographer I could not manage to indicate width and color of a LineString? How can I do that please?
Thank you :) --Benoît Prieur (talk) 05:47, 19 August 2016 (UTC)
- Forget this question. I found solution by myself.
- SeeYu! --Benoît Prieur (talk) 07:38, 19 August 2016 (UTC)
easy version to replace Map location
Hi, I saw your message in CA-WP and we are willing to use it. However I need some help. The Kartographer help page explain how to use with Jason sintax, but it does not allow use variable (For instance a template parameter) for latitude, longitude, marker, etc.. I tried to use {{mapframe}} template which call module:Map. However, I don't understand how to show a single Point with the same Lat-Lon of the mpaframe without use "see, do, eat, etc, template". The reason is because I want to replace the map generated with "template:Location map xxxxx" + coordinates, that we have embed in a infobox. Now, we have in catalan wiki, more than 30.000 articles that find the more appropiate "location map" from coordinates (see this sample). Using Kartographer will improve a lot this infoboxes. May you help me ?. Thanks--Amadalvarez (talk) 13:42, 24 July 2016 (UTC)
- Amadalvarez, check out Map module that is able to generate GeoJSON from parameters. That's what is used underneath the marker template. I will look at your question more in a bit - preparing for presentation at the moment (pls remind me in case i forget). Thx! --Yurik (talk) 14:15, 24 July 2016 (UTC)
- I think I got it !. When I change in the infobox, I'll ping you to show you. Thanks !--Amadalvarez (talk) 14:50, 24 July 2016 (UTC)
- Done, but in test. You can see:
- ca:template:Crea mapa dinàmic wd (to invoke map)
- ca:Usuari:Amadalvarez/edifici (pseudo "template:Infotaula edifici" to test before launch)
- ca:Can Draper (sample of use).
- Questions:
- it's slower than the "location map solution". Is it because of code or because the servers providing service ?
- the APP doesn't show the map. Just a blank space. No problem with mobile desktop navigator (Iphone).
- I await your answer before deploy the change in the production infobox. Thanks, --Amadalvarez (talk) 18:52, 24 July 2016 (UTC)
- Done, but in test. You can see:
- I think I got it !. When I change in the infobox, I'll ping you to show you. Thanks !--Amadalvarez (talk) 14:50, 24 July 2016 (UTC)
Amadalvarez, what is a "location map solution"? To be shown, map needs to download a tile composing javascript (leaflet), and all the needed tile images. As for the app - hmm, i wasn't aware of that - we might need to raise a bug with the app team. --Yurik (talk) 01:20, 25 July 2016 (UTC)
- The location map solution is the present solution of static maps based on an image (country, region, city, etc) with a known boundaries coordinates + a marker(s) drawn by the template:location map from the coordinates of the object(s).
- Regarding the app, if you will manage the solution with developers, please ping to me when it was fixed. Thanks a lot !!.--Amadalvarez (talk) 04:07, 25 July 2016 (UTC)
- Amadalvarez, ah, yes, I actually just created a {{Graph:Map_with_marks}} template to use Graph ext to render any kinds of marks (including commons images) with labels on top of any background maps (or sections thereof). And yes, that thing would always be much faster than interactive maps because it is basically just an image, as oppose to multiple tiles + code. We do plan to work on making a static maps service, but its just not there yet. Work in progress :) --Yurik (talk) 21:04, 25 July 2016 (UTC)
- Perfect !. Remind to tell me when team app fixed the bug, please.--Amadalvarez (talk) 21:07, 25 July 2016 (UTC)
- Amadalvarez, ah, yes, I actually just created a {{Graph:Map_with_marks}} template to use Graph ext to render any kinds of marks (including commons images) with labels on top of any background maps (or sections thereof). And yes, that thing would always be much faster than interactive maps because it is basically just an image, as oppose to multiple tiles + code. We do plan to work on making a static maps service, but its just not there yet. Work in progress :) --Yurik (talk) 21:04, 25 July 2016 (UTC)
See this tuit. It looks nice !. --Amadalvarez (talk) 12:41, 29 July 2016 (UTC)
- Amadalvarez awesome!!! Very happy to see it :) There is clearly a lot more we can and should do with it, like more data layers, better user interface, but its a great first step! Also, I noticed that there is a small gap on the left of the map - should CSS be adjusted in some way? Please keep the bugs and suggestions coming, and overall discussion active with the community (not just CA, but all languages). Once again, thanks :) --Yurik (talk) 20:23, 17 August 2016 (UTC)
- Amadalvarez, could you translate this message to cawiki? Thanks!! --Yurik (talk) 23:23, 25 August 2016 (UTC)
- Amadalvarez don't listen to Yuri. :) If you are interested in helping translate, please do so at this page on meta. Thank you. CKoerner (WMF) (talk) 17:53, 26 August 2016 (UTC)
- @CKoerner (WMF) and Yurik: I think is done. --Amadalvarez (talk) 22:52, 26 August 2016 (UTC)
- Amadalvarez don't listen to Yuri. :) If you are interested in helping translate, please do so at this page on meta. Thank you. CKoerner (WMF) (talk) 17:53, 26 August 2016 (UTC)
- Amadalvarez, could you translate this message to cawiki? Thanks!! --Yurik (talk) 23:23, 25 August 2016 (UTC)
<mapframe> on Wikipedia
<mapframe> tag seams very interesting. I've taken the example from mw:Help:Extension:Kartographer, and it works fine on ca:Usuari:Zebulon84/proves, but it doesn't work on User:Zebulon84/sandbox or fr:Utilisateur:Zebulon84/Brouillon, despite an identical MediaWiki an Kartographer version installed .
- Is it normal ?
- Is it a known issue ?
- Is it planned for the future ? (when ?)
<maplink> seams to works fine everywhere though.
Regards, --Zebulon84 (talk) 10:22, 16 September 2016 (UTC)
- Zebulon84, hi, the <maplink> has launched everywhere, and <mapframe> has launched on all non-Wikipedia projects, plus a few (ca, mk, he) Wikipedia projects. We plan to launch it more widely soon, but only when we feel the system is stable enough to have a bigger load. --Yurik (talk) 15:59, 16 September 2016 (UTC)
Saturday October 22: WikiArte Latin American Edit-a-thon @ MoMA
| Saturday October 22, 10am: WikiArte Latin American Edit-a-thon @ MoMA | |
|---|---|
 Join us for a full Saturday of social Wikipedia editing at the Museum of Modern Art (drop-in any time!), during which we will create, update, and improve Wikipedia articles pertaining to the lives and works of Latin American artists. The WikiArte (Wiki Arte y Cultura Latinoamerica) edit-a-thon is a global campaign to improve Wikipedia's coverage of Latin American arts and culture and to counter geocultural systemic bias on Wikipedia. Featuring an opening Artists' Panel at 10am, with Sol Aramendi, Sharon Lee De La Cruz, and Marisa Morán Jahn, to be moderated by Rocío Aranda-Alvarado, curator at El Museo del Barrio. The Museum of Modern Art and Fundacion Cisneros/Colección Patricia Phelps de Cisneros are uniting with international allies to focus on the lives and works of Latin American artists, architects and designers. With keystone events scheduled for October 22 in New York City and other cities throughout the month (Mexico City, Buenos Aires, Caracas, & others), the campaign aims to further similar goals to Art+Feminism. All are invited, with no specialized knowledge of the subject or Wikipedia editing experience required. Introductory training on the basics of Wikipedia editing will be given throughout the edit-a-thon. Please bring your laptop and power cord; we will have library resources, WiFi, and a list of suggested topics on hand.
Newcomers are very welcome! Bring your friends and colleagues! --Pharos (talk) 23:29, 19 October 2016 (UTC) | |
(You can subscribe/unsubscribe from future notifications for NYC-area events by adding or removing your name from this list.)
Indian National Highway
Hi Yurik, planning to use maplink for NHs in India, we have OSM relation for each NHs ? How to use it for NHs in Wikipedia ? . List of National Highways in India by highway number. Is there anything we have to do in Wikidata ? --naveenpf (talk) 10:12, 16 October 2016 (UTC)
- naveenpf, it seems some of India's NHs do not have Wikidata IDs. I just added Wikidata ID and Wikipedia article link to the NH1 here, and it should take about a day for our systems to pick up the change. You need do two things: 1) ensure that every single NH has an entry in Wikidata (it seems they all do already), and 2) edit OSM to add those Wikidata IDs. The list you mentioned already contains OSM relation IDs, so this will be relatively simple, but tedious - click on the relationship, zoom in until you see the "edit button", edit, add Wikipedia link (it should automatically add Wikidata ID), save. Afterwards you will be able to create SPARQL queries to draw these roads. --Yurik (talk) 15:20, 16 October 2016 (UTC)
- can you please show how to do for one SPARQL queries to draw roads ? I am planning to add it here [2] -- naveenpf (talk) 01:08, 20 October 2016 (UTC)
- I got it, how to do, Thank you ...
 Done. I am planning to update the complete list. Any suggestions ? -- naveenpf (talk) 05:28, 20 October 2016 (UTC)
- Updating a big list is a bit tricky - could in theory be done by a script, but that might take a bit more effort than its worth. I would suggest creating a simple template, e.g. "Highway maplink" that takes lat, lon, zoom, and wikidata ID parameters. Apparently this tool can convert multiple wiki pages to their wikidata IDs, so you can copy all article links from that table, convert them, and insert them as template calls. Updating OSM database is a separate can of worms that hopefully can also be solved, either automatically or via manual efforts. --Yurik (talk) 19:08, 23 October 2016 (UTC)
- P.S. another linking tool. --Yurik (talk) 19:22, 23 October 2016 (UTC)
Using Graph:Street map with marks
Hello Yurik! Great to know that some of the ideas are still going on in different places. You know... Wikipedia is quite slow for technological novelty, but it seems that Wikidata has make thinks go faster. I have made some tests here and I wonder if it would be possible to have two different things:
- A legend for the colors
- Something that is not a discrete property, but a complex query: county seats in Texas, airports in Germany, museums in Mexico...
Do you know anything about this? -Theklan (talk) 20:00, 14 October 2016 (UTC)
- Theklan, it is totally possible to make a legend in the graph - I will try to poke at it at some point, or if you are brave at heart you could try poking at the Vega syntax of the graph. As for the query - it will accept any query, see my explanation here --Yurik (talk) 20:52, 14 October 2016 (UTC)
- I'll watch around (brave heart, but don't know Vega syntax)... about the sparql query, yes, I know how to make it, but don't know where I should change it in the example. I see there only the query for Armenian heritage sites. Any clue? :P -Theklan (talk) 21:06, 14 October 2016 (UTC)
- Theklan, just change the "wdqs=..." parameter to any query you want. As long as that query returns expected fields, such as lat, lon, text, img, ..., that graph will use them. --Yurik (talk) 22:04, 14 October 2016 (UTC)
- Theklan, appologies, coordinates should be returned as "coord" field. I updated the documentation. --Yurik (talk) 22:08, 14 October 2016 (UTC)
- Yes... I found some good examples. Quite lost in sparql, but with some examples it gets easier. Just stuck in the Vega syntax. I found how to insert a legend, but can't insert it in the template. -Theklan (talk) 22:19, 14 October 2016 (UTC)
- Theklan, try using Graph sandbox special page - you can copy the graph itself there, and experiment with it. --Yurik (talk) 23:01, 14 October 2016 (UTC)
- The problem is that I found the code for inserting the legend, but I can't figure out where and how to change ALL the template. Is to say... is it possible to insert a legend in the template without changing the code? -Theklan (talk) 09:31, 15 October 2016 (UTC)
- Theklan, i did a sample implementation of a legend, but the query will need to be adjusted to return meaningful strings as oppose to the Q numbers for the "type" field. --Yurik (talk) 03:00, 16 October 2016 (UTC)
- I'll watch around (brave heart, but don't know Vega syntax)... about the sparql query, yes, I know how to make it, but don't know where I should change it in the example. I see there only the query for Armenian heritage sites. Any clue? :P -Theklan (talk) 21:06, 14 October 2016 (UTC)
| Graphs are unavailable due to technical issues. There is more info on Phabricator and on MediaWiki.org. |
- Great! I can't help with the QXXXX problem, but it seems a great start. -Theklan (talk) 20:50, 16 October 2016 (UTC)
- It is really exciting to see these map tools taking shape. Great work. I am looking forward to seeing how this and <mapframe> etc develops. Is there an overall maps discussion forum that lets us know when they are settled and stable?
- I couldn't help noticing that the labels are coming out on the wrong sides - both top and bottom and left and right - as you will see from the map. Also, allowing for the dot size would seem important - it would need quite a bit of hand tweaking of Dx and Dy to get them the right distance from the dot. Also, is there a way of adding the legend details direct, rather than via wikidata? RobinLeicester (talk) 18:07, 16 October 2016 (UTC)
- RobinLeicester, I added some info about thi individual params of the street params. As for legend - it would be fairly difficult and error-prone to have a copy of the legend setting from the template params. I would recommend figuring out the sparql query to get the needed (localized) information. There is a maps-l mailing list. Also, there is mw:Maps, and Phabricator board] with all the tasks. --Yurik (talk) 19:17, 23 October 2016 (UTC)
| Graphs are unavailable due to technical issues. There is more info on Phabricator and on MediaWiki.org. |
Hello again! I'm developing an automatic cartography template. Now it can put an airport map in any sovereign state in the world, as you see here: eu:Espainia#Aireportuak. I have to change the zoom factor, the width and some other features, but the main idea is there. I'm trying to put it inside a box and inserting a maplink below, so the user can expand it. Is it possible to create a mapling to, as the example, a big interactive map of all the airpors of Spain? -Theklan (talk) 13:29, 23 October 2016 (UTC)
- Theklan, yes, maplink can use wikidata query service to generate a list of values - see the help page (simply change mapframe to maplink for your usecase). Also, I added some documentation to the street map template, explaining what individual parameters mean. --Yurik (talk) 19:13, 23 October 2016 (UTC)
- Could you make an example of displaying the airports of a country? I have this with the template:
| Graphs are unavailable due to technical issues. There is more info on Phabricator and on MediaWiki.org. |
- But I can't figure how to make it with the mapling. -Theklan (talk) 19:52, 23 October 2016 (UTC)
- Theklan, I am sorry, maplink/mapframe only support extracting geoshapes (polygons and lines) from OSM database based on the IDs from Wikidata. Which means at this point there i no way to draw "dots" (points of interest) that come directly from Wikidata. See (and comment) phab:T134816. --Yurik (talk) 20:42, 23 October 2016 (UTC)
Maps in Hebrew Wikipedia
Hi,
It seems that recently "dynamic maps" were included in the standard "city" templates in Hebrew Wikipedia. See e.g. Bellano (on the bottom). This started a flame (Hebrew) on the village pump. Excluding the usual arguments of "Oh no, something changed!", a real issue remains that nowhere outside of Israel are there any Hebrew names on the map, and there are all too many places in the world where the names don't use a Latin script and are thus not even readable for an English reader (a somewhat reasonable assumption in Israel).
At some point in the discussion someone pointed out an help from Google Maps on setting the language of the map. This was good enough for the main proponent of the change. But from what I understand it is irrelevant (right?).
Is there any way to provide maps with Hebrew names, or even English names? Tzafrir (talk) 17:08, 26 October 2016 (UTC)
- Tzafrir, wow, I tried to follow the discussion with Google Translate (scrolled to "map"). I am sorry it was so heated, and would love to make it better. The multilingual maps has always been one of the main goals, but there are many technical limitation that make it very hard task - phab:T112948 has some discussion about it. So while we MUST do this, the timeline is very hazy. It will be relatively easy for us to generate a map with "Show English, and if not available, show local label", but we cannot generate 300 maps for each different Wikipedia language due to storage, caching, and processing limitations. Another option would be to create an English map in addition to the current international one, and let users choose which map to show for each article - international or English. I will brainstorm with the devs, see what we can do. --Yurik (talk) 02:43, 27 October 2016 (UTC)
Maps in app
Hi, Yurik, Good and hard job since we talked in July. Congratulations. I'd like to deploy the dinamic maps to replace all the statics maps, but it still remains some problems with maps in the smartphone app. Now it shows the map, that's correct. However, sometimes not show the mark, but I don't know in what conditions it happens. In addition, the map is not clickable, and it's not possible to open or scroll it on the screen. You can see two exemple (selecting catalan language in both): Casa Milà, doesn't show mark; Santa Maria de Taüll, shows mark. Some idea/help ?. Thanks ! --Amadalvarez (talk) 07:30, 4 November 2016 (UTC)
- Amadalvarez, both articles show the pushpin. I suspect it simply took some time to show up because "pageprops" database table that is used to store it is updated a bit after saving is done, so you don't get to see the result right away. It's on our TODO list. On the other hand, I tried both of the above articles in the Wikipedia Android app (beta), and both did NOT have the pushpin. I am not exactly sure what is going on there - I will have to reach to the apps team. See phab:T150031. --Yurik (talk) 16:53, 4 November 2016 (UTC)
- Thanks, Yurik. I'll do more tests and will follow the phabricator. Thanks a lot. Keep in contact. --Amadalvarez (talk) 20:18, 4 November 2016 (UTC)
Saturday November 12: Women in Science Edit-a-thon @ NY Academy of Sciences (plus Sunday Indigenous People's Justice event)
| Saturday November 12, 12-4pm: Women in Science Edit-a-thon @ NY Academy of Sciences | |
|---|---|
 Join us for a full Saturday of social Wikipedia editing at NY Academy of Sciences (drop-in any time!), during which we will create, update, and improve Wikipedia articles covering Women in science for their second annual edit-a-thon!. This event also coincides with the year-long celebration of the Academy's 200th Anniversary and a Women in Red online campaign. Beginning and experienced Wikipedia writers are both welcome, and there will be helpers on hand to assist those new to editing the encyclopedia.
Newcomers are very welcome! Bring your friends and colleagues! --Pharos (talk) 19:26, 10 November 2016 (UTC) And RSVP now for our other event this Sunday in Brooklyn, focusing on Indigenous communities and social justice:
| |
(You can subscribe/unsubscribe from future notifications for NYC-area events by adding or removing your name from this list.)
Maps with english language labels in countries with non-latin characters
Hallo Yurik, as I understood from discussions within wikivoyage.de, where we migrated to wikimedia maps a while ago, you are the one to contact, when there are maps problems. I'm editing quite a lot for places in Greece and now Israel, we use quite a lot of POIs in wikivoyage as People do not only want to know about the main sites of interest bus also want to go there ;-) Earlier, there was the possibility to switch to maps with english language labels, now there are the OSM maps with only labels in local languages and as I hardly can read hebrew, it's very difficult, to get one with these maps (Arab would be same, by the way). I then used Google Street Maps instead which has all english labels, but that's absolutely not the idea to tell people when we want to rely on open source / open information. I noticed, there are some troubles the other way round with hebrew speakers not familiar with english labels... So is there some imagineable solution? As far is I now, we cannot switch to other language labels in our current maps, but with the cycle and transport maps, at least the towns are written in english, so there must be some english labels around, somehow. Maybe, there will be a possibility to have the maps set to different label sets and have the local language as a fallback, if there is no english available? Kind regards from Switzerland Martin - Mboesch (talk) 10:54, 18 November 2016 (UTC)
- Mboesch, hi, multilingual maps has been one of our biggest goals, but a very hard one to do. See the discussion in the phab:T112948 task, and some proposals. In short - yes, we want it, no, it won't be right away, but yes, hopefully soon :) --Yurik (talk) 23:29, 18 November 2016 (UTC)
Graph:Street map with marks
Hi, Yurik. Did you see my conversation with Theklan about the "Graph:Street map with marks" ?. Easier than I though. Now it's installed in ca:template:indret with near 14k articles. I will use dynamic maps in some cases that is important scroll and navigate within. However, to eliminate the "location map" solution (my initial question, d'you remember ?) is enough. Thanks, --Amadalvarez (talk) 22:48, 12 November 2016 (UTC)
- Amadalvarez, hi, it looks nice! Question though - why not use the interactive maps? They would show the same thing, plus when you click, they become interactive and allow users to point to other locations. And sorry, could you remind me which other question you mean? :) --Yurik (talk) 23:32, 18 November 2016 (UTC)
- I understood that interactive were more resource consumer thant this one. Isn't?. In any case, I'll wait until app team fix the problem with dynamic maps. Don't worry about my "initial question". I mean this conversation, when I first met you to ask about change "Location map" technique by dynamic maps. Thanks, --Amadalvarez (talk) 23:56, 18 November 2016 (UTC)
- Amadalvarez, hehe, not any more - it is actually the same resources - it generates a static image that is very fast (cached in Varnish). Only when you click, you start downloading the needed javascript and images, which is totally fine, and offers much better user experience. As for the apps - are you sure it is still not working? Ever since we enabled static snapshot images, they should have started working. Please double check and comment in phab:T143877. And thanks! --Yurik (talk) 00:05, 19 November 2016 (UTC)
- I understood that interactive were more resource consumer thant this one. Isn't?. In any case, I'll wait until app team fix the problem with dynamic maps. Don't worry about my "initial question". I mean this conversation, when I first met you to ask about change "Location map" technique by dynamic maps. Thanks, --Amadalvarez (talk) 23:56, 18 November 2016 (UTC)
ArbCom Elections 2016: Voting now open!
Hello, Yurik. Voting in the 2016 Arbitration Committee elections is open from Monday, 00:00, 21 November through Sunday, 23:59, 4 December to all unblocked users who have registered an account before Wednesday, 00:00, 28 October 2016 and have made at least 150 mainspace edits before Sunday, 00:00, 1 November 2016.
The Arbitration Committee is the panel of editors responsible for conducting the Wikipedia arbitration process. It has the authority to impose binding solutions to disputes between editors, primarily for serious conduct disputes the community has been unable to resolve. This includes the authority to impose site bans, topic bans, editing restrictions, and other measures needed to maintain our editing environment. The arbitration policy describes the Committee's roles and responsibilities in greater detail.
If you wish to participate in the 2016 election, please review the candidates' statements and submit your choices on the voting page. MediaWiki message delivery (talk) 22:08, 21 November 2016 (UTC)
Saturday December 3: Contemporary Chinese Art Edit-a-thon @ Guggenheim
| Saturday December 3: Contemporary Chinese Art Edit-a-thon @ Guggenheim | |
|---|---|
 On Saturday December 3, 2016, in conjunction with a global campaign, the Guggenheim will host its fifth Wikipedia edit-a-thon—or, #guggathon—to enhance Wikipedia's coverage of modern and contemporary artists from Greater China. The event will cap off Wikipedia Asian Month, an online campaign dedicated to augmenting Asian content on Wikipedia throughout November. New and experienced editors are welcome. The event will include a training session for participants who are new to Wikipedia, and Wikipedia specialists will be on hand to provide basic instruction and editing support. Editors are invited to view the exhibition Tales of Our Time following the event. The Guggenheim aims to raise awareness of the artists featured in the Tales of Our Time exhibition supported by The Robert H. N. Ho Family Foundation Chinese Art Initiative, and build on the model of campaigns like the Wikipedia Edit-a-thon at the Guggenheim: Women in Architecture, Wikipedia Edit-a-thon at the Guggenheim: Contemporary Art of the Middle East and North Africa, and Art+Feminism.
Newcomers are very welcome! Bring your friends and colleagues! --Pharos (talk) 09:46, 23 November 2016 (UTC) | |
(You can subscribe/unsubscribe from future notifications for NYC-area events by adding or removing your name from this list.)
Copying code doesn't render a graph
Hello again Yurik! I'm making some experiments with graphs and copying the code in Template:Graph:Most_Expensive_Paintings into eu:Txantiloi:Saldutako margolanik garestienak gives a syntax error. Do you know why? -Theklan (talk) 21:23, 5 December 2016 (UTC)
- Theklan because that graph uses {{Inflation}}, which you don't have in euwiki. --Yurik (talk) 22:13, 5 December 2016 (UTC)
- Yes we do! -Theklan (talk) 22:17, 5 December 2016 (UTC)
- Theklan, my apologies, it is not that you don't have that template, it's that the Inflation template produces an error. If you look at the graph page, you will see incorrect data:
- Yes we do! -Theklan (talk) 22:17, 5 December 2016 (UTC)
  {"date_sold": "April 18, 1985",

   "price_adj": <span class="error">Error when using <tt>{{[[Txantiloi:Inflation|Inflation]]}}</tt>: <code>|<span style="white-space:nowrap;">index</span>='''US'''</code> (parameter 1) not a recognized index.</span>[[Category:Pages with errors in inflation template]],

   "year_painted": 1462, "period": "p1", "artist": "Mantegna", "author": "other", "title": "Adoration of the Magi", "ratio": {"x": 0, "y": 0} },
That price_adj should be a simple numeric value instead. --Yurik (talk) 00:50, 6 December 2016 (UTC)
- Thanks! I copied again the original code and all is ok now! -Theklan (talk) 09:30, 6 December 2016 (UTC)