From Wikipedia, the free encyclopedia
U.S. House district for New Mexico
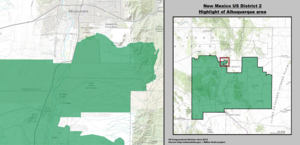
New Mexico's 2nd congressional district Interactive map of district boundaries since January 3, 2023
Representative Distribution Population (2022) 696,764 Median household $53,550[1] Ethnicity Cook PVI D+1[2]
New Mexico's 2nd congressional district serves the southern half of New Mexico , including Las Cruces , and the southern fourth of Albuquerque . It is currently represented by Democrat Gabe Vasquez .
History [ edit ] Historically, the district has leaned more Republican than New Mexico's other two districts, particularly in presidential elections. In the 2020 election , Republican candidate Yvette Herrell defeated Democratic representative Xochitl Torres Small in a rematch of their race in 2018 . Herrell is the third Native woman elected to Congress and she assumed office on January 3, 2021. Following the 2020 census, each congressional district in the state underwent redistricting "to ensure that each district has a variety of constituents better reflecting the diversity of interests in New Mexico as a whole."[3] Gabe Vasquez won the 2022 midterm election.[4] Cook Partisan Voting Index rating of D+1, it is the least Democratic district in New Mexico, a state with an all-Democratic congressional delegation.[2]
Election results from statewide races [ edit ] Results under current lines (since 2023) Results under old lines (2013-2023) [5] Results under old lines (2003-2013) [6]
List of members representing the district [ edit ]
Member(Residence)
Party
Years
Cong
Electoral history
District location
District established January 3, 1969
Ed Foreman (Las Cruces )
Republican
January 3, 1969 –
91st
Elected in 1968 .1969–1983 Catron , Chaves , Curry , De Baca , Doña Ana , Eddy , Grant , Hidalgo , Lea , Lincoln , Luna , McKinley , Otero , Roosevelt , San Juan , Sierra , Socorro , and Valencia
Harold Runnels (Lovington )
Democratic
January 3, 1971 –
92nd 93rd 94th 95th 96th
Elected in 1970 .Re-elected in 1972 .Re-elected in 1974 .Re-elected in 1976 .Re-elected in 1978 .
Vacant
August 5, 1980 –
96th
Joe Skeen (Picacho )
Republican
January 3, 1981 –
97th 98th 99th 100th 101st 102nd 103rd 104th 105th 106th 107th
Elected in 1980 .Re-elected in 1982 .Re-elected in 1984 .Re-elected in 1986 .Re-elected in 1988 .Re-elected in 1990 .Re-elected in 1992 .Re-elected in 1994 .Re-elected in 1996 .Re-elected in 1998 .Re-elected in 2000 .
1983–1993 [data missing
1993–2003 Bernalillo , Catron , Chaves , Cibola , De Baca , Doña Ana , Eddy , Grant , Guadalupe , Hidalgo , Lea , Lincoln , Luna , Otero , Sierra , Socorro , and Valencia
Steve Pearce (Hobbs )
Republican
January 3, 2003 –
108th 109th 110th
Elected in 2002 .Re-elected in 2004 .Re-elected in 2006 .run for U.S. senator .
2003–2013 Bernalillo , Catron , Chaves , Cibola , De Baca , Doña Ana , Eddy , Grant , Guadalupe , Hidalgo , Lea , Lincoln , Luna , McKinley , Otero , Sierra , Socorro , and Valencia
Harry Teague (Hobbs )
Democratic
January 3, 2009 –
111th
Elected in 2008 .
Steve Pearce (Hobbs )
Republican
January 3, 2011 –
112th 113th 114th 115th
Elected in 2010 .Re-elected in 2012 .Re-elected in 2014 .Re-elected in 2016 .run for Governor of New Mexico .
2013–2023 Bernalillo , Catron , Chaves , Cibola , De Baca , Doña Ana , Eddy , Grant , Guadalupe , Hidalgo , Lea , Lincoln , Luna , McKinley , Otero , Roosevelt , Sierra , Socorro , and Valencia
Xochitl Torres Small (Las Cruces )
Democratic
January 3, 2019 –
116th
Elected in 2018 .
Yvette Herrell (Alamogordo )
Republican
January 3, 2021 –
117th
Elected in 2020 .
Gabe Vasquez (Las Cruces )
Democratic
January 3, 2023 –
118th
Elected in 2022 .
2023–present Bernalillo , Catron , Cibola , Doña Ana , Eddy , Grant , Hidalgo , Lea , Lincoln , Luna , McKinley , Otero , Sierra , Socorro , and Valencia
Election results [ edit ] See also [ edit ]
References [ edit ]
^ Center for New Media & Promotion (CNMP), US Census Bureau. "My Congressional District" . www.census.gov . ^ a b "2022 Cook PVI: District Map and List" . Cook Political Report . July 12, 2022. Retrieved January 10, 2023 .^ "New Mexico Redistricting is Completed" . Lea County Tribune . Retrieved November 11, 2022 .^ "Democrats Make a Clean Sweep in New Mexico" . Lea County Tribune . Retrieved November 11, 2022 .^ "Daily Kos Elections 2008 & 2012 presidential election results for congressional districts used in 2012 & 2014 elections - Google Drive" . docs.google.com .^ Presidential Election Results, by district , swingstateproject.com^ "1968 Election Results" (PDF) .^ "1970 Election Results" (PDF) .^ "1972 Election Results" (PDF) .^ "1974 Election Results" (PDF) .^ "1976 Election Results" (PDF) .^ "1978 Election Results" (PDF) .^ "1980 Election Results" (PDF) .^ "1982 Election Results" (PDF) .^ "1984 Election Results" (PDF) .^ "1986 Election Results" (PDF) .^ "1988 Election Results" (PDF) .^ "1990 Election Results" (PDF) .^ "1992 Election Results" (PDF) .^ "1994 Election Results" (PDF) .^ "1996 Election Results" (PDF) .^ "1998 Election Results" (PDF) .^ "2000 Election Results" (PDF) .^ "2002 Election Results" (PDF) .^ "2004 Election Results" (PDF) .^ "2006 Election Results" (PDF) .^ "2008 Election Results" (PDF) .^ "2010 Election Results" (PDF) . Archived from the original (PDF) on September 27, 2011. Retrieved May 11, 2011 .^ "Statewide Results" . New Mexico Secretary of State. Archived from the original on December 27, 2017.^ "Official Results General Election - November 4, 2014" . New Mexico Secretary of State. November 4, 2014. Retrieved January 2, 2015 .^ "Election Night Results - November 8, 2016" . New Mexico Secretary of State. November 8, 2016. Retrieved December 7, 2016 .^ "Election Night Results - November 6, 2018" . New Mexico Secretary of State. November 6, 2018. Retrieved November 7, 2018 .
33°23′07″N 106°17′58″W / 33.38528°N 106.29944°W / 33.38528; -106.29944

.svg)


.jpg)


.svg)