
Chaves County, New Mexico
Chaves County | |
|---|---|
 Chaves County Courthouse in Roswell | |
|
Seal | |
 Location within the U.S. state of New Mexico | |
 New Mexico's location within the U.S. | |
| Coordinates: 33°22′N 104°28′W / 33.36°N 104.47°W | |
| Country | |
| State | |
| Founded | February 25, 1889 |
| Named for | José Francisco Chaves |
| Seat | Roswell |
| Largest city | Roswell |
| Area | |
| • Total | 6,075 sq mi (15,730 km2) |
| • Land | 6,065 sq mi (15,710 km2) |
| • Water | 9.8 sq mi (25 km2) 0.2% |
| Population (2020) | |
| • Total | 65,157 |
| • Density | 11/sq mi (4/km2) |
| Time zone | UTC−7 (Mountain) |
| • Summer (DST) | UTC−6 (MDT) |
| Congressional districts | 1st, 2nd, 3rd |
| Website | co |
Chaves County is a county in New Mexico, United States. As of the 2020 census, the population was 65,157.[1] Its county seat is Roswell.[2] Chaves County was named for Colonel Jose Francisco Chaves, a military leader there during the Civil War and later in Navajo campaigns. The county was created by the New Mexico Territorial Legislature on February 25, 1889, out of land from Lincoln County.
Chaves County comprises the Roswell, New Mexico Micropolitan Statistical Area.
Geography[edit]
According to the U.S. Census Bureau, the county has a total area of 6,075 square miles (15,730 km2), of which 6,065 square miles (15,710 km2) is land and 9.8 square miles (25 km2) (0.2%) is water.[3] It is the fourth-largest county in New Mexico by area.
Adjacent counties[edit]
- De Baca County - north
- Roosevelt County - northeast
- Lea County - east
- Eddy County - south
- Otero County - southwest
- Lincoln County - west
National protected areas[edit]
Demographics[edit]
| Census | Pop. | Note | %± |
|---|---|---|---|
| 1910 | 16,850 | — | |
| 1920 | 12,075 | −28.3% | |
| 1930 | 19,549 | 61.9% | |
| 1940 | 23,980 | 22.7% | |
| 1950 | 40,605 | 69.3% | |
| 1960 | 57,649 | 42.0% | |
| 1970 | 43,335 | −24.8% | |
| 1980 | 51,103 | 17.9% | |
| 1990 | 57,849 | 13.2% | |
| 2000 | 61,382 | 6.1% | |
| 2010 | 65,645 | 6.9% | |
| 2020 | 65,157 | −0.7% | |
| U.S. Decennial Census[4] 1790-1960[5] 1900-1990[6] 1990-2000[7] 2010[8] | |||
2000 census[edit]
As of the 2000 census,[9] there were 61,382 people, 22,561 households, and 16,085 families living in the county. The population density was 10 people per square mile (3.9 people/km2). There were 25,647 housing units at an average density of 4 units per square mile (1.5/km2). The racial makeup of the county was 71.95% White, 1.97% Black or African American, 1.13% Native American, 0.53% Asian, 0.06% Pacific Islander, 21.25% from other races, and 3.12% from two or more races. 43.83% of the population were Hispanic or Latino of any race.
There were 22,561 households, out of which 35.60% had children under the age of 18 living with them, 52.70% were married couples living together, 13.70% had a female householder with no husband present, and 28.70% were non-families. 24.80% of all households were made up of individuals, and 11.60% had someone living alone who was 65 years of age or older. The average household size was 2.66 and the average family size was 3.17.
In the county, the population was spread out, with 29.10% under the age of 18, 9.40% from 18 to 24, 25.30% from 25 to 44, 21.50% from 45 to 64, and 14.70% who were 65 years of age or older. The median age was 35 years. For every 100 females there were 95.90 males. For every 100 females age 18 and over, there were 91.60 males.
The median income for a household in the county was $28,513, and the median income for a family was $32,532. Males had a median income of $26,896 versus $21,205 for females. The per capita income for the county was $14,990. About 17.60% of families and 21.30% of the population were below the poverty line, including 29.10% of those under age 18 and 13.90% of those age 65 or over.
2010 census[edit]
As of the 2010 census, there were 65,645 people, 23,691 households, and 16,646 families living in the county.[10] The population density was 10.8 inhabitants per square mile (4.2 inhabitants/km2). There were 26,697 housing units at an average density of 4.4 units per square mile (1.7 units/km2).[11] The racial makeup of the county was 70.9% white, 2.0% black or African American, 1.2% American Indian, 0.6% Asian, 0.1% Pacific islander, 21.9% from other races, and 3.2% from two or more races. Those of Hispanic or Latino origin made up 52.0% of the population.[10] In terms of ancestry, 10.1% were German, 9.3% were Irish, 8.5% were English, and 4.6% were American.[12]
Of the 23,691 households, 37.7% had children under the age of 18 living with them, 48.9% were married couples living together, 14.9% had a female householder with no husband present, 29.7% were non-families, and 25.2% of all households were made up of individuals. The average household size was 2.70 and the average family size was 3.22. The median age was 34.7 years.[10]
The median income for a household in the county was $37,524 and the median income for a family was $43,464. Males had a median income of $37,573 versus $26,250 for females. The per capita income for the county was $18,504. About 15.9% of families and 21.0% of the population were below the poverty line, including 27.1% of those under age 18 and 14.6% of those age 65 or over.[13]
Politics[edit]
Chaves County is a Republican stronghold. No Democratic presidential candidate has won Chaves County since Lyndon Johnson's landslide victory of 1964. Even in that election, Johnson took Chaves County by only 1.3 percent.[14]
| Year | Republican | Democratic | Third party | |||
|---|---|---|---|---|---|---|
| No. | % | No. | % | No. | % | |
| 2020 | 15,656 | 69.76% | 6,381 | 28.43% | 406 | 1.81% |
| 2016 | 12,872 | 63.50% | 5,534 | 27.30% | 1,865 | 9.20% |
| 2012 | 13,088 | 64.50% | 6,604 | 32.54% | 600 | 2.96% |
| 2008 | 13,651 | 61.74% | 8,197 | 37.07% | 264 | 1.19% |
| 2004 | 14,773 | 68.06% | 6,726 | 30.99% | 206 | 0.95% |
| 2000 | 11,378 | 62.69% | 6,340 | 34.93% | 431 | 2.37% |
| 1996 | 9,991 | 53.95% | 7,014 | 37.87% | 1,514 | 8.18% |
| 1992 | 8,872 | 46.95% | 6,360 | 33.65% | 3,666 | 19.40% |
| 1988 | 13,367 | 65.84% | 6,730 | 33.15% | 206 | 1.01% |
| 1984 | 15,248 | 73.37% | 5,332 | 25.66% | 202 | 0.97% |
| 1980 | 12,502 | 67.24% | 5,350 | 28.77% | 742 | 3.99% |
| 1976 | 10,631 | 59.26% | 7,139 | 39.79% | 170 | 0.95% |
| 1972 | 11,493 | 70.87% | 4,296 | 26.49% | 427 | 2.63% |
| 1968 | 8,866 | 63.61% | 3,612 | 25.91% | 1,460 | 10.47% |
| 1964 | 8,419 | 49.20% | 8,650 | 50.55% | 43 | 0.25% |
| 1960 | 9,089 | 59.05% | 6,212 | 40.36% | 91 | 0.59% |
| 1956 | 7,538 | 63.37% | 4,270 | 35.89% | 88 | 0.74% |
| 1952 | 7,018 | 63.92% | 3,880 | 35.34% | 81 | 0.74% |
| 1948 | 3,123 | 40.43% | 4,569 | 59.15% | 33 | 0.43% |
| 1944 | 3,149 | 48.33% | 3,350 | 51.41% | 17 | 0.26% |
| 1940 | 2,981 | 40.84% | 4,304 | 58.97% | 14 | 0.19% |
| 1936 | 2,505 | 35.70% | 4,394 | 62.62% | 118 | 1.68% |
| 1932 | 1,830 | 28.95% | 4,257 | 67.34% | 235 | 3.72% |
| 1928 | 3,124 | 69.48% | 1,364 | 30.34% | 8 | 0.18% |
| 1924 | 1,519 | 39.40% | 2,168 | 56.24% | 168 | 4.36% |
| 1920 | 1,765 | 45.54% | 2,080 | 53.66% | 31 | 0.80% |
| 1916 | 862 | 25.90% | 2,275 | 68.36% | 191 | 5.74% |
| 1912 | 465 | 18.24% | 1,339 | 52.53% | 745 | 29.23% |
Communities[edit]
City[edit]
- Roswell (county seat)
Towns[edit]
Census-designated place[edit]
Unincorporated communities[edit]
Education[edit]
School districts include:[16]
- Artesia Public Schools
- Dexter Consolidated Schools
- Elida Municipal Schools
- Hagerman Municipal Schools
- Lake Arthur Municipal Schools
- Roswell Independent Schools
- Tatum Municipal Schools
Notable people[edit]
- Jacqueline Wonsetler (1918–1974), American meteorologist
See also[edit]
References[edit]
- ^ "Chaves County, New Mexico". United States Census Bureau. Retrieved July 1, 2023.
- ^ "Find a County". National Association of Counties. Archived from the original on May 31, 2011. Retrieved June 7, 2011.
- ^ "2010 Census Gazetteer Files". United States Census Bureau. August 22, 2012. Archived from the original on January 1, 2015. Retrieved January 1, 2015.
- ^ "U.S. Decennial Census". United States Census Bureau. Retrieved January 1, 2015.
- ^ "Historical Census Browser". University of Virginia Library. Archived from the original on August 11, 2012. Retrieved January 1, 2015.
- ^ "Population of Counties by Decennial Census: 1900 to 1990". United States Census Bureau. Retrieved January 1, 2015.
- ^ "Census 2000 PHC-T-4. Ranking Tables for Counties: 1990 and 2000" (PDF). United States Census Bureau. Archived (PDF) from the original on March 27, 2010. Retrieved January 1, 2015.
- ^ "State & County QuickFacts". United States Census Bureau. Archived from the original on June 6, 2011. Retrieved September 27, 2013.
- ^ "U.S. Census website". United States Census Bureau. Retrieved January 31, 2008.
- ^ a b c "DP-1 Profile of General Population and Housing Characteristics: 2010 Demographic Profile Data". United States Census Bureau. Archived from the original on February 13, 2020. Retrieved January 24, 2016.
- ^ "Population, Housing Units, Area, and Density: 2010 - County". United States Census Bureau. Archived from the original on February 13, 2020. Retrieved January 24, 2016.
- ^ "DP02 SELECTED SOCIAL CHARACTERISTICS IN THE UNITED STATES – 2006-2010 American Community Survey 5-Year Estimates". United States Census Bureau. Archived from the original on February 13, 2020. Retrieved January 24, 2016.
- ^ "DP03 SELECTED ECONOMIC CHARACTERISTICS – 2006-2010 American Community Survey 5-Year Estimates". United States Census Bureau. Archived from the original on February 13, 2020. Retrieved January 24, 2016.
- ^ "Dave Leip's Atlas of U.S. Presidential Elections".
- ^ Leip, David. "Dave Leip's Atlas of U.S. Presidential Elections". uselectionatlas.org. Retrieved April 1, 2018.
- ^ "2020 CENSUS - SCHOOL DISTRICT REFERENCE MAP: Chaves County, NM" (PDF). U.S. Census Bureau. Archived (PDF) from the original on June 28, 2022. Retrieved June 28, 2022. - Text list
External links[edit]
![]() Media related to Chaves County, New Mexico at Wikimedia Commons
Media related to Chaves County, New Mexico at Wikimedia Commons
Places adjacent to Chaves County, New Mexico | ||||||||||||||||
|---|---|---|---|---|---|---|---|---|---|---|---|---|---|---|---|---|
| ||||||||||||||||
Municipalities and communities of Chaves County, New Mexico, United States | ||
|---|---|---|
| City | 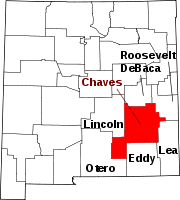 | |
| Towns | ||
| CDP | ||
| Unincorporated community | ||
| Ghost town | ||
| International | |
|---|---|
| National | |