Politics of Campania
 |
|---|
|
The Politics of Campania, Italy takes place in a framework of a presidential representative democracy, whereby the President of Regional Government is the head of government, and of a pluriform multi-party system. Executive power is exercised by the Regional Government. Legislative power is vested in both the government and the Regional Council.
Executive branch
The Regional Government (Giunta Regionale) is presided by the President of the Region (Presidente della Regione), who is elected for a five-year term, and is composed by the President and the Ministers (Assessori), who are currently eight, including a vice president, all appointed by the President.[1]
List of presidents
Legislative branch
This section needs to be updated. (October 2015) |
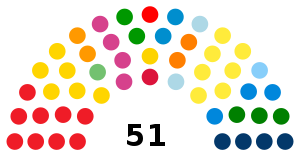
The Regional Council of Campania (Consiglio Regionale della Campania) is composed of 60 members. 48 councillors are elected in provincial constituencies by proportional representation using the largest remainder method with a Droop quota and open lists, while 12 councillors (elected in bloc) come from a "regional list", including the President-elect. One seat is reserved for the candidate who comes second. If a coalition wins more than 50% of the total seats in the council with PR, only 6 candidates from the regional list will be chosen and the number of those elected in provincial constituencies will be 54. If the winning coalition receives less than 40% of votes, special seats are added to the council to ensure a large majority for the President's coalition.[2]
The council is elected for a five-year term, but, if the President suffers a vote of no confidence, resigns or dies, under the simul stabunt, simul cadent clause introduced in 1999 (literally they will stand together or they will fall together), also the council is dissolved and a snap election is called.[3]
Local government
Provinces
This section needs expansion. You can help by adding to it. (March 2019) |
Municipalities
Provincial capitals
| Municipality | Inhabitants[4] | Mayor | Party | Election | |
|---|---|---|---|---|---|
| Avellino | 54,080
#DCDCDC |
Gianluca Festa | Civic | 2019 | |
| Benevento | 59,306
#0087DC |
Clemente Mastella | Forza Italia | 2016 | |
| Caserta | 75,456
#EF1C27 |
Carlo Marino | Democratic Party | 2016 | |
| Naples | 956,917
#FFA500 |
Luigi de Magistris | Democracy and Autonomy | 2016 | |
| Salerno | 133,557
#EF1C27 |
Vincenzo Napoli | Democratic Party | 2016 | |
Parties and elections
Latest regional election
In the latest regional election, which took place on 20–21 September 2020, Vincenzo De Luca of the Democratic Party was re-elected President by a landslide 69.5% of the vote.
 | ||||||||||
| Candidates | Votes | % | Seats | Parties | Votes | % | Seats | |||
|---|---|---|---|---|---|---|---|---|---|---|
| Vincenzo De Luca | 1,789,017 | 69.48 | 1 | Democratic Party | 398,490 | 16.90 | 8 | |||
| De Luca for President | 313,666 | 13.30 | 6 | |||||||
| Italia Viva | 173,870 | 7.37 | 4 | |||||||
| Free Campania | 122,367 | 5.19 | 2 | |||||||
| Democratic Making – Populars | 104,857 | 4.45 | 2 | |||||||
| Us Campanians | 102,652 | 4.35 | 2 | |||||||
| Liberal Democrats – Popular Campania – Moderates | 84,769 | 3.60 | 2 | |||||||
| Democratic Centre | 76,141 | 3.23 | 2 | |||||||
| Italian Socialist Party | 60,100 | 2.55 | 1 | |||||||
| More Campania in Europe | 45,500 | 1.93 | 1 | |||||||
| Green Europe – Solidary Democracy | 42,996 | 1.82 | 1 | |||||||
| Really – Animalist Party | 33,681 | 1.43 | 1 | |||||||
| For the People and the Community | 26,452 | 1.12 | – | |||||||
| Democrats and Progressives | 25,254 | 1.07 | – | |||||||
| Italian Republican Party | 5,745 | 0.24 | – | |||||||
| Total | 1,616,540 | 68.57 | 32 | |||||||
| Stefano Caldoro | 464,921 | 18.06 | 1 | Brothers of Italy | 140,918 | 5.98 | 4 | |||
| League | 133,152 | 5.65 | 3 | |||||||
| Forza Italia | 121,695 | 5.16 | 2 | |||||||
| Caldoro for President – Union of the Centre | 45,326 | 1.92 | 1 | |||||||
| Alliance of the Centre | 6,432 | 0.27 | – | |||||||
| Southern Identity – South Macroregion | 3,333 | 0.14 | – | |||||||
| Total | 450,856 | 19.12 | 10 | |||||||
| Valeria Ciarambino | 255,714 | 9.93 | – | Five Star Movement | 233,974 | 9.92 | 7 | |||
| Giuliano Granato | 30,955 | 1.20 | – | Power to the People | 26,711 | 1.13 | – | |||
| Luca Saltalamacchia | 27,475 | 1.07 | – | Terra | 25,125 | 1.07 | – | |||
| Sergio Angrisano | 4,028 | 0.16 | – | Third Pole | 3,056 | 0.13 | – | |||
| Giuseppe Cirillo | 2,608 | 0.10 | – | Party of Good Manners | 1,348 | 0.06 | – | |||
| Blank and invalid votes | 199,386 | 7.19 | ||||||||
| Total candidates | 2,574,718 | 100.00 | 2 | Total parties | 2,357,610 | 100.00 | 49 | |||
| Registered voters/turnout | 4,996,921 | 55.52 | ||||||||
| Source: Ministry of the Interior – Results[permanent dead link] | ||||||||||

