From Wikipedia, the free encyclopedia
Brazilian general election, 1994|
|
|
|
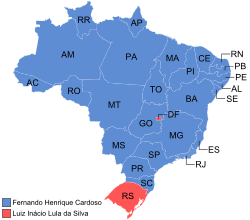
 Presidential election results map after voting:
Blue denotes states won by Cardoso
Red denotes states won by Lula |
|
General elections were held in Brazil on 3 October 1994.[1] The presidential elections were won by Fernando Henrique Cardoso of the Brazilian Social Democracy Party (and also supported by the Liberal Front Party and the Brazilian Labour Party),[2] who received 54.3% of the vote.[3] Cardoso won the election by a margin of 27.3%, the largest in Brazilian history to date, and the first of his two landslide victories. The Brazilian Democratic Movement Party remained the largest party in the Chamber of Deputies and the Senate.
Results
President
| Candidate
|
Party
|
Votes
|
%
|
| Fernando Henrique Cardoso |
Brazilian Social Democracy Party |
34,362,726 |
54.3
|
| Luiz Inácio Lula da Silva |
Workers' Party |
17,116,579 |
27.0
|
| Enéas Carneiro |
Party of the Reconstruction of the National Order |
4,671,474 |
7.4
|
| Orestes Quércia |
Brazilian Democratic Movement Party |
2,773,497 |
4.4
|
| Leonel Brizola |
Democratic Labour Party |
2,015,843 |
3.2
|
| Espiridião Amin |
Reform Progressive Party |
1,739,780 |
2.7
|
| Carlos Antônio Gomes |
National Reconstruction Party |
387,815 |
0.6
|
| Hernani Fortuna |
Social Christian Party |
238,257 |
0.4
|
| Invalid/blank votes |
14,638,118 |
–
|
| Total |
77,944,089 |
100
|
| Registered voters/turnout |
94,743,043 |
82.3
|
| Source: Nohlen
|
Chamber of Deputies
| Party
|
Votes
|
%
|
Seats
|
+/–
|
| Brazilian Democratic Movement Party |
9,287,049 |
20.3 |
107 |
–2
|
| Brazilian Social Democracy Party |
6,350,941 |
13.9 |
62 |
+25
|
| Liberal Front Party |
5,873,370 |
12.9 |
89 |
+6
|
| Workers' Party |
5,859,347 |
12.8 |
49 |
+14
|
| Reform Progressive Party[4] |
4,307,878 |
9.4 |
52 |
–12
|
| Democratic Labour Party |
3,303,434 |
7.2 |
34 |
–12
|
| Progressive Party[5] |
3,169,626 |
6.9 |
36 |
New
|
| Brazilian Labour Party |
2,379,773 |
5.2 |
31 |
–3
|
| Liberal Party |
1,603,330 |
3.5 |
13 |
–2
|
| Brazilian Socialist Party |
995,298 |
2.2 |
15 |
+4
|
| Communist Party of Brazil |
567,186 |
1.2 |
10 |
+5
|
| Democratic Social Party |
414,933 |
0.9 |
3 |
+1
|
| Party of the Reconstruction of the National Order |
308,031 |
0.7 |
0 |
0
|
| Party of National Mobilization |
257,018 |
0.6 |
4 |
+3
|
| Socialist People's Party |
256,485 |
0.6 |
2 |
–1
|
| Social Christian Party |
213,734 |
0.5 |
3 |
–2
|
| Progressive Republican Party |
207,307 |
0.5 |
1 |
+1
|
| National Reconstruction Party |
184,727 |
0.4 |
1 |
–40
|
| Labour Party of Brazil |
39 |
0.0 |
0 |
0
|
| Green Party |
154,666 |
0.4 |
1 |
New
|
| United Socialist Workers' Party |
0 |
New
|
| Brazilian Communist Party |
0 |
–
|
| Brazilian Labour Renewal Party |
0 |
New
|
| Invalid/blank votes |
31,966,623 |
– |
– |
–
|
| Total |
77,660,795 |
100 |
513 |
+11
|
| Registered voters/turnout |
94,743,043 |
82.0 |
– |
–
|
| Source: Nohlen
|
References


