2002 Irish general election
| |||||||||||||||||||||||||||||||||||||||||||||||||||||||||||||||||||||||||||||||||||||||||||||||||||||||||||||
165 of 166 seats in Dáil Éireann 84 seats were needed for a majority | |||||||||||||||||||||||||||||||||||||||||||||||||||||||||||||||||||||||||||||||||||||||||||||||||||||||||||||
|---|---|---|---|---|---|---|---|---|---|---|---|---|---|---|---|---|---|---|---|---|---|---|---|---|---|---|---|---|---|---|---|---|---|---|---|---|---|---|---|---|---|---|---|---|---|---|---|---|---|---|---|---|---|---|---|---|---|---|---|---|---|---|---|---|---|---|---|---|---|---|---|---|---|---|---|---|---|---|---|---|---|---|---|---|---|---|---|---|---|---|---|---|---|---|---|---|---|---|---|---|---|---|---|---|---|---|---|---|---|
| Turnout | 62.6% | ||||||||||||||||||||||||||||||||||||||||||||||||||||||||||||||||||||||||||||||||||||||||||||||||||||||||||||
| |||||||||||||||||||||||||||||||||||||||||||||||||||||||||||||||||||||||||||||||||||||||||||||||||||||||||||||
File:Irish general election 2002.png Percentage of seats gained by each of the five biggest parties, and number of seats gained by smaller parties and independents. | |||||||||||||||||||||||||||||||||||||||||||||||||||||||||||||||||||||||||||||||||||||||||||||||||||||||||||||
| |||||||||||||||||||||||||||||||||||||||||||||||||||||||||||||||||||||||||||||||||||||||||||||||||||||||||||||
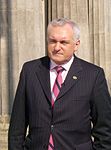
The Irish general election of 2002 was held on Friday, 17 May 2002 just over three weeks after the dissolution of the 28th Dáil on Thursday 25 April by President Mary McAleese, at the request of the Taoiseach, Bertie Ahern. The newly elected members of the 29th Dáil assembled on Thursday 6 June 2002.
The general election took place in 42 parliamentary constituencies throughout Ireland for 165 seats in the lower house of parliament, Dáil Éireann.
Overview
The general election was significant for a number of reasons:
- The election was considered a success for Fianna Fáil, with the party coming within a handful of seats from achieving an overall majority (the nearest the country came to a one party majority government since 1987). The only high-profile loss was Mary O'Rourke losing her seat in Westmeath.
- The re-election of the Fianna Fáil–Progressive Democrats government, the first occasion since 1969 that an Irish government won re-election.
- The meltdown in Fine Gael support, which saw the main opposition party drop from 54 to 31 seats, and lose all but three seats in Dublin.
- The failure of the Labour Party, contrary to all expectations, to increase its seat total. Later in the year, Ruairi Quinn stepped down as leader of the Labour Party. He was replaced by Pat Rabbitte, who was one of four Democratic Left TDs who joined in a merger with Labour in 1999. The most high-profile loss for the party was the defeat of former leader Dick Spring in Kerry.
- The success of the Green Party, which increased its TDs from two to six, including its first Teachta Dála (TD) outside of Dublin.
- The electoral success of Sinn Féin, which increased its seat number from one to five.
- The election of a large number of independent candidates.
- Contrary to what opinion polls and political pundits were predicting, the Progressive Democrats kept all of their seats, and picked up four more.
- It was the first time electronic voting machines were used in an Irish election. They were used in three constituencies: Dublin North, Dublin West and Meath.
Fine Gael
The most noticeable feature of the election was the collapse in Fine Gael's vote. It suffered its second worst electoral result ever (after the 1948 general election), with several prominent members failing to get re-elected, including:
- Alan Dukes – former party leader
- Jim Mitchell – deputy leader
- Nora Owen – former deputy leader and former Minister for Justice
- Austin Currie – former Presidential Election candidate
- Jim Higgins – former Chief Whip
- Alan Shatter – front bench member
- Deirdre Clune – front bench member
- Michael Creed – front bench member
- Frances Fitzgerald – front bench member
The party's losses were especially pronounced in Dublin, where just three TDs (Richard Bruton, Gay Mitchell and Olivia Mitchell) were returned, fewer than Fianna Fáil, Labour, the Progressive Democrats or the Greens. The reasons for the drop in support for Fine Gael are many and varied:
- There was an element of bad luck in some losses, and the proportion of seats they lost (42.6%) was much greater than the proportion of votes (5.2%).
- In 2002, the Irish economy was booming, unemployment was low, and the outgoing government was a stable one that had lasted its full term.
- No other opposition party, noticeably Labour, would agree to a pre-election pact with Fine Gael, sensing the unpopularity of the party. This meant that no-one felt that Fine Gael would be able to lead a government after the election. In contrast, the two parties of the outgoing government fought the election on a united front.
- The Fine Gael party was poorly organised in Dublin, and morale was low.
- The political landscape had changed in Ireland since Fine Gael's heyday in the 1980s. The Progressive Democrats and the Green Party in particular ate into Fine Gael's middle class support, and anti-Fianna Fáil voters had a much wider range of parties to choose from. All 4 of the extra seats won by the Green Party were at the expense of Fine Gael, as were 3 out of 4 of the Progressive Democrats' gains.
- Toward the end of the campaign, Michael McDowell warned that because Fianna Fáil were so high in the opinion polls, they could form a government by themselves. This led to a significant shift to the Progressive Democrats at the last minute, and many Fine Gael voters voted strategically for the Progressive Democrats to avoid a single-party Fianna Fáil government.
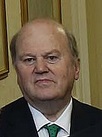
In the immediate aftermath of the election, Fine Gael leader Michael Noonan announced his resignation from the leadership and Enda Kenny was chosen as the new leader in the subsequent election.
Results
| Party | Fianna Fáil | Fine Gael | Labour Party | Sinn Féin | Progressive Democrats | Green Party | Socialist Party |
| style="background:Template:Fianna Fáil/meta/color;"| | style="background:Template:Fine Gael/meta/color;"| | style="background:Template:Labour Party (Ireland)/meta/color;"| | style="background:Template:Sinn Féin/meta/color;"| | style="background:Template:Progressive Democrats/meta/color;"| | style="background:Template:Green Party (Ireland)/meta/color;"| | style="background:Template:Socialist Party (Ireland)/meta/color;"| | |
| Leader | Bertie Ahern | Michael Noonan | Ruairi Quinn | Gerry Adams | Mary Harney | Trevor Sargent | Joe Higgins |
| Votes | 41.5%, 770,748 | 22.5%, 417,619 | 10.8%, 200,130 | 6.5%, 121,020 | 4.0%, 73,628 | 3.8%, 71,470 | 0.8%, 14,896 |
| Seats | 81 (48.8%) | 31 (18.7%) | 20 (12.7%) | 5 (3.0%) | 8 (4.8%) | 6 (3.6%) | 1 (0.6%) |
| style="background:Template:Fianna Fáil/meta/color; width:48.8%;" | 81 | style="background:Template:Progressive Democrats/meta/color; width:4.8%;" | 8 | 15 | style="background:Template:Fine Gael/meta/color; width:18.7%;" | 31 | style="background:Template:Labour Party (Ireland)/meta/color; width:12.7%;" | 20 | style="background:Template:Green Party (Ireland)/meta/color; width:3.6%;" | 6 | style="background:Template:Sinn Féin/meta/color; width:3%;" | 5 | style="background:Template:Socialist Party (Ireland)/meta/color; width:0.6%;" | 1 |
| Fianna Fáil | PDs | Inds | Fine Gael | Labour Party | Green Party | Sinn Féin |
Vote Share of different parties in the election.
| Election to the 29th Dáil – 17 May 2002[1][2] | ||||||||
|---|---|---|---|---|---|---|---|---|
| Party | Leader | Seats | ± | % of seats |
First pref. votes |
% FPv | ±% | |
| Fianna Fáil | Bertie Ahern | 81 | 48.8 | 770,748 | 41.5 | |||
| Fine Gael | Michael Noonan | 31 | 18.7 | 417,619 | 22.5 | |||
| Labour | Ruairi Quinn | 20 | 12.7 | 200,130 | 10.8 | |||
| Sinn Féin | Gerry Adams | 5 | 3.0 | 121,020 | 6.5 | |||
| Progressive Democrats | Mary Harney | 8 | 4.8 | 73,628 | 4.0 | |||
| Green | Trevor Sargent | 6 | 3.6 | 71,470 | 3.8 | |||
| Socialist Party | Joe Higgins | 1 | 0.6 | 14,896 | 0.8 | |||
| Christian Solidarity | 0 | 0 | 4,741 | 0.3 | ||||
| Workers' Party of Ireland | Seán Garland | 0 | 0 | 4,012 | 0.2 | |||
| Socialist Workers | N/A | 0 | 0 | 3,333 | 0.2 | |||
| Independent | N/A | 13 | 7.8 | 176,305 | 9.5 | |||
| Spoilt votes | 20,707 | — | — | |||||
| Total | 166 | 0 | 100 | 1,878,609 | 100 | — | ||
| Electorate/Turnout | 3,002,173 | 62.6% | — | |||||
- Fianna Fáil and Progressive Democrats majority coalition government formed.
Democratic Left, which won 4 seats in 1997, merged with the Labour Party in 1999. Independents include Independent Health Alliance candidates (12,296 votes, 1 seat) and Independent Fianna Fáil (6,124 votes, 1 seat).
Dáil membership changes
The following changes took place as a result of the election:
- 23 outgoing TDs retired
- 141 TDs stood for re-election (plus the Ceann Comhairle, Séamus Pattison who was automatically returned)
- 109 of those were re-elected
- 32 failed to be re-elected
- 55 successor TDs were elected
- 47 were elected for the first time
- 8 had previously been TDs
- There were 7 successor female TDs, replacing 6 outgoing, increasing the total number by 1 to 22
- There were changes in 38 of 42 constituencies contested
Outgoing TDs are listed in the constituency they constested in the election. For some, such as Marian McGennis, this differs from the constituency they represented in the outgoing Dáil. Where more than one change took place in a constituency the concept of successor is an approximation for presentation only.
A summary of the cross-party seat transfers is:
| Lost by | To | Seats | — | Won by | From | Seats |
|---|---|---|---|---|---|---|
| Fine Gael (23) | Fianna Fáil | 7 | Fianna Fáil (9) | Fine Gael | 7 | |
| Progressive Democrats | 4 | Independent | 2 | |||
| Sinn Féin | 1 | Independent (7) | Fine Gael | 5 | ||
| Independent | 5 | Labour Party | 1 | |||
| Labour Party | 2 | Fianna Fáil | 1 | |||
| Green Party | 4 | Progressive Democrats (4) | Fine Gael | 4 | ||
| Labour Party (3) | Sinn Féin | 2 | Sinn Féin (4) | Fine Gael | 1 | |
| Independent | 1 | Labour Party | 2 | |||
| Independent (3) | Fianna Fáil | 2 | Fianna Fáil | 1 | ||
| Labour Party | 1 | Green Party (4) | Fine Gael | 4 | ||
| Fianna Fáil (2) | Sinn Féin | 1 | Labour Party (3) | Fine Gael | 2 | |
| Independent | 1 | Independent | 1 |
See also
- Government of the 29th Dáil
- Members of the 29th Dáil
- Ministers of State of the 29th Dáil
- Members of the 22nd Seanad
References
- ^ "29th Dáil – General Election: 17 May 2002". ElectionsIreland.org. Retrieved 9 April 2009.
- ^ Nohlen, D & Stöver, P (2010) Elections in Europe: A data handbook, pp1009-1017 ISBN 978-3-8329-5609-7
Further reading
- Mitchell, Paul (April 2003). "Fianna Fáil still dominant in the coalition era: The Irish general election of May 2002". West European Politics. 26 (2): 174–183. doi:10.1080/01402380512331341171.
External links
- Dáil General Election May 2002: Results and Transfer of Votes (PDF format)
- [1] RTÉ archives
- Collection of party manifestos from 2002 on IrishManifestos.co.nr [dead link]


