Yiliang County, Kunming
Appearance
Yiliang County
宜良县 | |
|---|---|
 Yiliang County Coach Station | |
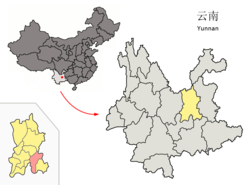
 Location of Yiliang County (pink) and Kunming City (yellow) within Yunnan | |
| Country | People's Republic of China |
| Province | Yunnan |
| Prefecture | Kunming |
| Established | 1956 |
| Area | |
| • Total | 1,880 km2 (730 sq mi) |
| Population (2003) | |
| • Total | 410,000 |
| • Density | 220/km2 (560/sq mi) |
| Time zone | UTC+8 (CST) |
| Postal code | 652100 |
| Area code | 0871 |
| Website | http://www.yiliang-china.com/ |
Yiliang County (Chinese: 宜良县; pinyin: Yíliáng Xiàn) is a county, under the jurisdiction of Kunming, the capital of Yunnan province, China.
Administrative divisions
- Kuangyuan Town (匡远镇)
- Beigucheng Town (北古城镇)
- Tangchi Town (汤池镇)
- Goujie Town (狗街镇)
- Gengjiaying Yi Nationality & Miao Nationality Village (耿家营彝族苗族乡)
- Jiuxiang Yi Nationality & Hui Nationality Village (九乡彝族回族乡)
- Majie Village (马街乡)
- Zhushan Village (竹山乡)
Climate
| Climate data for Yiliang (1981−2010) | |||||||||||||
|---|---|---|---|---|---|---|---|---|---|---|---|---|---|
| Month | Jan | Feb | Mar | Apr | May | Jun | Jul | Aug | Sep | Oct | Nov | Dec | Year |
| Record high °C (°F) | 25.8 (78.4) |
29.6 (85.3) |
31.3 (88.3) |
34.2 (93.6) |
34.9 (94.8) |
32.6 (90.7) |
33.7 (92.7) |
31.9 (89.4) |
33.7 (92.7) |
29.5 (85.1) |
28.0 (82.4) |
26.7 (80.1) |
34.9 (94.8) |
| Mean daily maximum °C (°F) | 17.8 (64.0) |
20.0 (68.0) |
23.9 (75.0) |
27.1 (80.8) |
26.9 (80.4) |
26.6 (79.9) |
26.5 (79.7) |
26.9 (80.4) |
25.6 (78.1) |
22.9 (73.2) |
20.0 (68.0) |
17.3 (63.1) |
23.5 (74.2) |
| Daily mean °C (°F) | 9.1 (48.4) |
11.1 (52.0) |
14.9 (58.8) |
19.2 (66.6) |
21.1 (70.0) |
21.6 (70.9) |
21.6 (70.9) |
21.2 (70.2) |
19.8 (67.6) |
17.2 (63.0) |
13.0 (55.4) |
9.3 (48.7) |
16.6 (61.9) |
| Mean daily minimum °C (°F) | 2.9 (37.2) |
4.1 (39.4) |
7.4 (45.3) |
12.4 (54.3) |
16.3 (61.3) |
18.2 (64.8) |
18.4 (65.1) |
17.7 (63.9) |
16.3 (61.3) |
13.6 (56.5) |
8.2 (46.8) |
3.9 (39.0) |
11.6 (52.9) |
| Record low °C (°F) | −3.4 (25.9) |
−2.2 (28.0) |
−4.2 (24.4) |
3.3 (37.9) |
6.8 (44.2) |
11.7 (53.1) |
12.9 (55.2) |
11.6 (52.9) |
7.6 (45.7) |
4.8 (40.6) |
−1.7 (28.9) |
−10.1 (13.8) |
−10.1 (13.8) |
| Average precipitation mm (inches) | 16.5 (0.65) |
16.7 (0.66) |
18.9 (0.74) |
23.9 (0.94) |
81.1 (3.19) |
157.8 (6.21) |
164.8 (6.49) |
150.8 (5.94) |
98.4 (3.87) |
75.6 (2.98) |
39.4 (1.55) |
16.2 (0.64) |
860.1 (33.86) |
| Average relative humidity (%) | 72 | 66 | 61 | 57 | 67 | 79 | 83 | 83 | 79 | 80 | 78 | 77 | 74 |
| Source: China Meteorological Data Service Center | |||||||||||||
References
External links
Wikimedia Commons has media related to Yiliang County, Kunming.
24°54′49″N 103°08′52″E / 24.91361°N 103.14778°E
