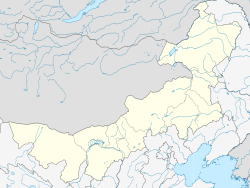
Hanggin Banner
Appearance
Hanggin Banner
杭锦旗 • ᠬᠠᠩᠭᠢᠨᠬᠣᠰᠢᠭᠤ | |
|---|---|
| Coordinates: 39°50′N 108°44′E / 39.833°N 108.733°E | |
| Country | People's Republic of China |
| Region | Inner Mongolia |
| Prefecture-level city | Ordos |
| Area | |
| • Total | 19,000 km2 (7,000 sq mi) |
| Elevation | 1,391 m (4,564 ft) |
| Population (2020)[1] | |
| • Total | 110,824 |
| • Density | 5.8/km2 (15/sq mi) |
| Time zone | UTC+8 (China Standard) |
| Hanggin Banner | |||||||||
|---|---|---|---|---|---|---|---|---|---|
| Chinese name | |||||||||
| Traditional Chinese | 杭錦旗 | ||||||||
| Simplified Chinese | 杭锦旗 | ||||||||
| Postal | Hangkin | ||||||||
| |||||||||
| Mongolian name | |||||||||
| Mongolian Cyrillic | Қанин қосиу | ||||||||
| Mongolian script | ᠬᠠᠩᠭᠢᠨ ᠬᠣᠰᠢᠭᠤ | ||||||||
| |||||||||
Hanggin or Hangjin Banner is a banner in southwest Inner Mongolia in the People's Republic of China. Occupying the northwest corner of the Ordos Loop, it is under the administration of Ordos Prefecture and is bordered by Dalad Banner to the east, Otog Banner to the southwest, and Bayan Nur to the north.
Geography
Most of Hanggin Banner is occupied by the northern half of the Ordos Desert. Its central basin formerly held the salt lake Dabasun Nor, whose salt was harvested and sold throughout the neighboring provinces during the Qing Dynasty.
Climate
| Climate data for Hanggin Banner (1981−2010) | |||||||||||||
|---|---|---|---|---|---|---|---|---|---|---|---|---|---|
| Month | Jan | Feb | Mar | Apr | May | Jun | Jul | Aug | Sep | Oct | Nov | Dec | Year |
| Record high °C (°F) | 11.8 (53.2) |
17.5 (63.5) |
24.4 (75.9) |
34.5 (94.1) |
33.2 (91.8) |
37.4 (99.3) |
38.1 (100.6) |
36.1 (97.0) |
35.2 (95.4) |
26.3 (79.3) |
20.4 (68.7) |
14.5 (58.1) |
38.1 (100.6) |
| Mean daily maximum °C (°F) | −3.6 (25.5) |
0.7 (33.3) |
7.3 (45.1) |
15.8 (60.4) |
22.4 (72.3) |
27.0 (80.6) |
28.9 (84.0) |
26.3 (79.3) |
21.3 (70.3) |
14.3 (57.7) |
5.4 (41.7) |
−1.9 (28.6) |
13.7 (56.6) |
| Daily mean °C (°F) | −11.1 (12.0) |
−6.7 (19.9) |
0.2 (32.4) |
8.6 (47.5) |
15.8 (60.4) |
20.5 (68.9) |
22.5 (72.5) |
20.1 (68.2) |
14.7 (58.5) |
7.1 (44.8) |
−1.9 (28.6) |
−9.0 (15.8) |
6.7 (44.1) |
| Mean daily minimum °C (°F) | −16.6 (2.1) |
−12.5 (9.5) |
−5.8 (21.6) |
1.8 (35.2) |
8.6 (47.5) |
13.6 (56.5) |
16.1 (61.0) |
14.5 (58.1) |
8.9 (48.0) |
1.5 (34.7) |
−7.2 (19.0) |
−14.2 (6.4) |
0.7 (33.3) |
| Record low °C (°F) | −29.7 (−21.5) |
−29.5 (−21.1) |
−25.5 (−13.9) |
−13.5 (7.7) |
−5.5 (22.1) |
0.4 (32.7) |
5.7 (42.3) |
4.7 (40.5) |
−3.2 (26.2) |
−13.3 (8.1) |
−23.8 (−10.8) |
−32.3 (−26.1) |
−32.3 (−26.1) |
| Average precipitation mm (inches) | 1.2 (0.05) |
2.0 (0.08) |
6.8 (0.27) |
9.5 (0.37) |
25.9 (1.02) |
34.3 (1.35) |
65.1 (2.56) |
76.5 (3.01) |
36.2 (1.43) |
14.7 (0.58) |
2.3 (0.09) |
1.3 (0.05) |
275.8 (10.86) |
| Average relative humidity (%) | 54 | 46 | 39 | 32 | 36 | 42 | 53 | 59 | 56 | 51 | 49 | 53 | 48 |
| Source: China Meteorological Data Service Center[2] | |||||||||||||
References
- ^ Inner Mongolia: Prefectures, Cities, Districts and Counties
- ^ 中国地面气候标准值月值(1981-2010) (in Simplified Chinese). China Meteorological Data Service Center. Retrieved 24 November 2022.
External links
- Official site (in Chinese)

