
Talk:Western African Ebola epidemic: Difference between revisions
| Line 499: | Line 499: | ||
::::I'm currently not able to check the what the sources actually say, but wouldn't Fox News count as reliable? I'm just an IP, but would like to know more about our Wiki's policy. Thanks.[[Special:Contributions/72.224.172.14|72.224.172.14]] #[[User talk:72.224.172.14|talk]]# 21:23, 21 August 2014 #UTC# |
::::I'm currently not able to check the what the sources actually say, but wouldn't Fox News count as reliable? I'm just an IP, but would like to know more about our Wiki's policy. Thanks.[[Special:Contributions/72.224.172.14|72.224.172.14]] #[[User talk:72.224.172.14|talk]]# 21:23, 21 August 2014 #UTC# |
||
:::::The Fox article might be reliable, but it doesn't support the assertion that a DoD lab accident caused the current outbreak, or that the US was involved in the outbreak inany way. It seems to have been used speciously to support a conspiracy theory. Cheers, [[User:Dawn Bard|Dawn Bard]] ([[User talk:Dawn Bard|talk]]) 21:32, 21 August 2014 (UTC) |
:::::The Fox article might be reliable, but it doesn't support the assertion that a DoD lab accident caused the current outbreak, or that the US was involved in the outbreak inany way. It seems to have been used speciously to support a conspiracy theory. Cheers, [[User:Dawn Bard|Dawn Bard]] ([[User talk:Dawn Bard|talk]]) 21:32, 21 August 2014 (UTC) |
||
::::::Thank you. Shouldn't we have a 'Conspiracy Theory' section though? |
::::::Thank you. Shouldn't we have a 'Conspiracy Theory' section though?[[Special:Contributions/72.224.172.14|72.224.172.14]] ([[User talk:72.224.172.14|talk]]) 22:02, 21 August 2014 (UTC) |
||
Revision as of 22:02, 21 August 2014
| This is the talk page for discussing improvements to the Western African Ebola epidemic article. This is not a forum for general discussion of the article's subject. |
Article policies
|
| Find medical sources: Source guidelines · PubMed · Cochrane · DOAJ · Gale · OpenMD · ScienceDirect · Springer · Trip · Wiley · TWL |
| Archives: 1, 2, 3, 4, 5, 6, 7, 8, 9, 10, 11, 12 |
| This article is of interest to the following WikiProjects: | ||||||||||||||||||||||||||||||||||||||||||||||||||||
| ||||||||||||||||||||||||||||||||||||||||||||||||||||


| A news item involving Western African Ebola epidemic was featured on Wikipedia's Main Page in the In the news section on 31 March 2014. |
| A news item involving Western African Ebola epidemic was featured on Wikipedia's Main Page in the In the news section on 29 June 2014. |
| This page is not a forum for general discussion about politics of Ebola containment. Any such comments may be removed or refactored. Please limit discussion to improvement of this article. You may wish to ask factual questions about politics of Ebola containment at the Reference desk. |
Western African Ebola epidemic is currently a Biology and medicine good article nominee. Nominated by -PAPAJECKLOY (hearthrob! kiss me! <3) (talk) at 15:11, 20 August 2014 (UTC) An editor has indicated a willingness to review the article in accordance with the good article criteria. Further reviews are welcome from any editor who has not contributed significantly to this article (or nominated it), and can be added to the review page, but the decision whether or not to list the article as a good article should be left to the first reviewer.
|
Better title?
I edited the box a little bit, just wanted to say it's great that an article about this event finally exists and I hope more information becomes avaliable so we can expand it. Does anyone think that "2014 West Africa Ebola outbreak" or "2014 West African Ebola outbreak" might be better options for the article's title? I was going to move it at first, but decided to go ahead and ask others before doing so. Skycycle (talk) 23:08, 1 April 2014 (UTC)
- I support your suggestion Skycycle. I felt this article was important to share for the awareness factor and welcome help from more experienced contributors. Lozion (talk) 23:42, 1 April 2014 (UTC)
- I also support the move proposal, the outbreak isn't confined in Guinea anymore.--Hariboneagle927 (talk) 11:09, 2 April 2014 (UTC)
- I'd go with "2014 West Africa Ebola outbreak". The Rambling Man (talk) 11:46, 2 April 2014 (UTC)
- Moving the article to 2014 West Africa Ebola outbreak, for any further ideas or suggestions please keep the discussion under this heading. Skycycle (talk) 14:38, 4 April 2014 (UTC)
Should be renamed "2014 Ebola Outbreak" given the cases in Nigeria and suspected cases elsewhere. — Preceding unsigned comment added by 70.209.206.12 (talk) 03:36, 6 August 2014 (UTC)
Total mortality
The article claims "Total mortality" is "729 deaths / 1323+ cases (55.1%)". This seems original and, in fact, pretty bad research. You simply can't calculate mortality like that, since it takes a while for a patient to die after diagnosis. So for real mortality, you need to divide the number of deaths today by the number of cases x days earlier (not today!), where x is the average number of days from diagnosis it takes a doomed patient (a patient who will be killed by the disease) to die. Such a calculcation, if done correctly, would obviously be too complicated for being WP:NOR compliant. Please consider deleting the misleading mortality percentage. It can be added back once the outbreak has stopped and the last patient has died. The alleged "mortality" percentage currently depends a lot more on the speed with which the disease is spreading (case growith) than on mortality. Because the speed is still increasing, we see this claimed "total mortality" percentage dropping every day... which is of course nonsense. --rtc (talk) 17:29, 31 July 2014 (UTC)
- As i understand this figure could be used as an indicator about the virus evolution. So the graph shows how the mortality changes over time. However, it is unclear how reliable the numbers are, since it has been reported that people do not report when ill. And it could be different for Europeans or Asians etc. See also this section https://en.wikipedia.org/wiki/Ebola_virus_disease#Prognosis prokaryotes (talk) 01:22, 1 August 2014 (UTC)
- Please actually read what I wrote before you reply. Even assuming perfectly reliable numbers, the calulated "total mortality" can be "used as an indicator about the virus evolution" only after the outbreak has ceased and the last victim has died. This is a mathematical fact! Please remove the number for now. It's original research and bad research. --rtc (talk) 13:20, 2 August 2014 (UTC)
Table suggestion
Can we please modify the table of cases and fatalities to add an extra column for each nation and in aggregate showing a mortality percentage? It would be really useful. Neukenjezelf (talk) 16:28, 12 August 2014 (UTC)
- But we don't know the mortality percentage. It's not a simple deaths/cases: some patients alive today may die tomorrow. Neither is it deaths / cases-delayed-by-n-days because there isn't a magic value of n. The mortality rate may also depend on the condition of the patient when first treated: those entering a hospital early may have a much better chance than those who come in very ill. We need a source for the mortality rate. Glrx (talk) 16:52, 12 August 2014 (UTC)
- The mortality rate is really unreliable, so it wouldn't be useful information. There's an article discussing that here: http://epidemic.bio.ed.ac.uk/ebolavirus_fatality_rate Donners (talk) 10:19, 13 August 2014 (UTC)
CDC
Please remember the context in which this is occurring, and do not use American abbreviations with separate local meanings. "CDC" occurs with great frequency in Liberian publications, but virtually always as a reference to the Congress for Democratic Change. I can't remember ever seeing "CDC" used for the Centers for Disease Control in any Liberian publication. Regardless of the usage of "CDC" in publications from other countries, the full name is unambiguous in all contexts. Nyttend (talk) 13:27, 7 April 2014 (UTC)
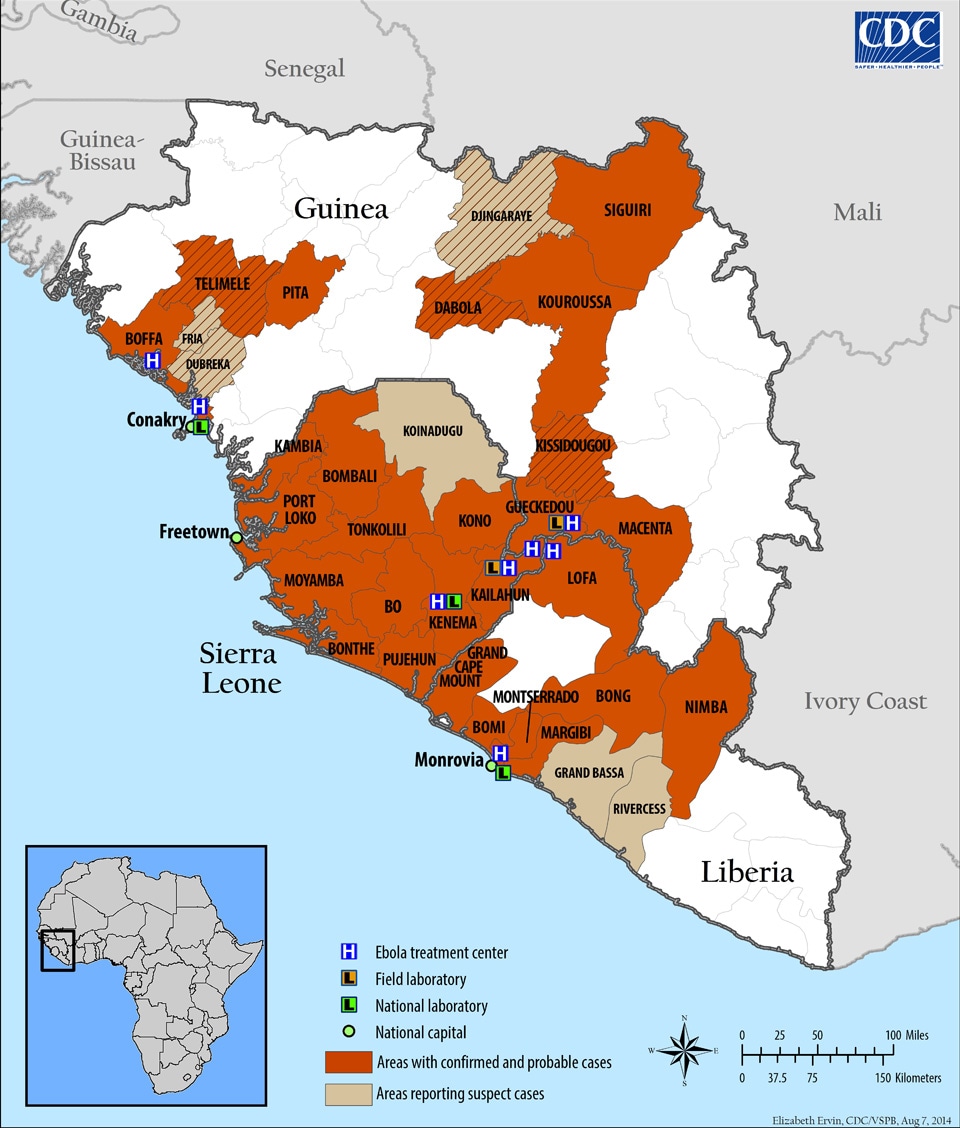
I think we should use WHO updates, not CDC. CDC updates are a copy of WHO updates, but later and whit some mistakes. For example, the WHO 5 June update reports 81 cases in Sierra Leone (31 confirmed, 3 probable, and 47 suspected), but the CDC update talks of 31 cases confirmed and 81 unconfirmed! Can someone update the map? http://www.cdc.gov/vhf/ebola/resources/distribution-map-guinea-outbreak.html Mtchief (talk) 20:53, 9 April 2014 (UTC)
New map available as of August 8, 2014. http://www.cdc.gov/vhf/ebola/images/outbreaks/guinea-liberia-sierra-leone-2014-current.jpg 132.216.227.13 (talk) 02:47, 7 August 2014 (UTC)
Temporal evolution
The numbers in the "Guinea" column of this table appear to be inconsistent. Why? -- 109.193.15.4 (talk) 16:10, 19 July 2014 (UTC)
- Numbers are regularly reassessed. They included suspected and probable cases - some turn out to be negative. Also, some turn out to be double-counted on review.Donners (talk) 23:10, 19 July 2014 (UTC)
- Incidentally, I noted that the latest edit contained figures not reported by the CDC. I initially reverted it, but I decided to change the reference to the WHO, as the CDC link (which is ostensibly relied upon for the table) is lagging behind. Donners (talk) 23:16, 19 July 2014 (UTC)
30 July WHO Numbers don't add up.
Literally. Take previous numbers, add to them the number of new cases. They don't add up to the new numbers --66.41.154.0 (talk) 21:53, 2 August 2014 (UTC)
- Numbers are constantly reviewed. If suspected and probable cases test negative, they are removed. If previously unknown cases turn out to be Ebola, they are retrospectively added. Donners (talk) 22:04, 2 August 2014 (UTC)
- The problem is that adding the new cases to the previously reported total number of cases isn't even close to what they're now reporting for the new totals. It's not like they're reducing the previous number via case they found weren't ebola. They're increasing them. There's nothing we can do about it I guess. --66.41.154.0 (talk) 16:50, 3 August 2014 (UTC)
- Total deaths between April 10 to May 23 are also off by 2, clearly this data is to be taken as rough indicator at best 84.52.42.33 (talk) 16:38, 4 August 2014 (UTC)
- The problem is that adding the new cases to the previously reported total number of cases isn't even close to what they're now reporting for the new totals. It's not like they're reducing the previous number via case they found weren't ebola. They're increasing them. There's nothing we can do about it I guess. --66.41.154.0 (talk) 16:50, 3 August 2014 (UTC)
Casualties List Clean Up?
So we think that these totals should reflect the WHO/CDC numbers like the timeline? (It would be cleaner and official, not speculation). Also the notes that are added after some countries really don't need to be there as that information can be added in the main article. (And why is the note of the Nigerian case of the Liberian that traveled to Lagos there, but not, for example the notes of the many Guinean cases that travlled to Sierra Leone and Liberia? added too). And Finally the US being added, aren't those cases of the health workers counted by WHO/CDC (and that list) as Liberian cases already?, so why do they need to be added twice. Shouldn't we count the WHO/CDC, as they will only count them once, and where they are first registered. Rump1234 (talk) 14:53, 3 August 2014 (UTC)
- Agreed, it should be a quick-reference to the latest data in the table. Having conflicting numbers is confusing, especially when there is no citation for the casualty list. At present, it is unsourced and contradictory to the offical numbers, which is particularly bad when it's the first thing page visitors see. Donners (talk) 05:42, 5 August 2014 (UTC)
- Agreed, I removed the superfluous info. already prior to reading this (what's it they say about "great minds" ;) ?), but those numbers should absolutely be consistent with the table and based on the same reliable sources too. -Oosh (talk) 06:04, 5 August 2014 (UTC)
- Yeah official numbers are best. I edited the tally to reflect the latest WHO/CDC info like the timeline. So hopefully it stays consistent with the timeline now.Rump1234 (talk) 10:59, 5 August 2014 (UTC)
WHO can take several days to release a new update. Any numbers confirmed by a country's ministry of health should go on the table - such as the second Nigerian death and the Saudi death.70.209.201.191 (talk) 15:27, 6 August 2014 (UTC)
- Then you wind up with a table from multiple sources, reliant on the mainstream media which is often outdated or inaccurate. See the Moroccan "case" as a prime example. Media were still publishing it as a confirmed case - and people were adding it to this page - based on an old and refuted announcement. The Saudi case is not confirmed as being Ebola. Donners (talk) 23:09, 7 August 2014 (UTC)
- I'd like to believe that Wikipedia should be able to get accurate information out quicker than the WHO, but I'm not convinced. We will see whether the WHO confirms that Saudi case. As mentioned elsewhere on this page, suspected cases in new countries come and go with alarming regularity. For now I think I'll enforce the policy agreed above Armouredduck (talk) 00:34, 7 August 2014 (UTC)
- Maybe Wikipedia could get information out quicker, but that is explicitly not the purpose of Wikipedia. This is an encyclopedia, not a newspaper. See WP:notnews.--Taylornate (talk) 00:51, 7 August 2014 (UTC)
How does case reporting work?
I am worried that case reporting is so difficult that we don't know the extent of the Ebola outbreak. Can anyone provide a description of how the reporting system is supposed to work? — Preceding unsigned comment added by 67.247.35.33 (talk) 19:21, 12 August 2014 (UTC)
- As far as I can tell they(WHO) just provide a SWAG. (Scientific Wild Ass Guess) --Aflafla1 (talk) 12:07, 13 August 2014 (UTC)
- Actually, news sources are starting to discuss the likelihood that the "official" WHO numbers substantially understate the size of the outbreak, because of widespread reluctance to report cases. I just added this point to the article with a citation. —Patrug (talk) 10:00, 14 August 2014 (UTC)
Ebola-Like Symptoms
Should the article cover suspected cases at all? Ebola symptoms are very similar with a wide variety of illness, thus i don't see the need to add reports on symptoms, without confirmation (i.e. see recent addition of New York case). prokaryotes (talk) 21:59, 4 August 2014 (UTC)
- I'd say a little mention would be warranted, if we have sources discussing outbreak-related hype and hysteria: have one thing on people imagining outbreaks all over the world, and have another on the lunatics who think that Mr Brantly's disease is a national emergency for the USA. For example, 2009 flu pandemic in the United States has comments about crazy responses (e.g. a school district closing all schools after one student was found with the disease), and Oklahoma City bombing mentions the fact that investigators originally thought that it was the work of some Middle Eastern men. In the same way, we might as well mention the inaccurate initial assessments and off-the-wall ideas that spread among some members of the general population. Nyttend (talk) 04:18, 5 August 2014 (UTC)
- Not unless they're reported by WHO, in my view. There have been over 10 countries reporting "suspected" cases which turned out to be false, including Spain, England, Gambia (three times!), Mali (13 cases) and Canada. It'll just become a mess, especially with the media hype at the moment. Donners (talk) 05:04, 5 August 2014 (UTC)
- That's my point — mentioning it amid a section discussing the media hype. WHO probably won't pay that much attention to the media hype; if we cover it (which I say we most definitely should), we'll have to depend on sources that aren't primarily medical. Nyttend (talk) 05:19, 5 August 2014 (UTC)
- Ah, for that use I agree. I was concerned about it being conflated with the facts of the outbreak, especially as some media reports of suspected cases had been creeping into the casualty list. A section on the media coverage, and the high level of awareness to potential cases (to put it politely) is certainly relevant. Donners (talk) 06:24, 5 August 2014 (UTC)
- And at the same time, we ought to mention the use of the media to fight the disease. Here's where the rap song belongs, for example. At the same time, see today's Heritage article, "As the Fight Against Ebola Intensifies: Ellen Pleads with the Media"; President Sirleaf is calling for the media to do more to increase awareness, in part to persuade people who think it's all a hoax. By the way, I apologise for relying so heavily on Heritage; it's been carrying more articles with wide-scale relevance than competitors such as The New Dawn (today's biggest headline) or The New Democrat (today's biggest headline, three weeks old), while I've not seen any recent coverage in The Inquirer, and the website of The Analyst is currently under major maintenance. I really know nothing about Leonese or Guinean publications, so I can't bring in anything but Liberian. Nyttend (talk) 13:01, 5 August 2014 (UTC)
- Ah, for that use I agree. I was concerned about it being conflated with the facts of the outbreak, especially as some media reports of suspected cases had been creeping into the casualty list. A section on the media coverage, and the high level of awareness to potential cases (to put it politely) is certainly relevant. Donners (talk) 06:24, 5 August 2014 (UTC)
- That's my point — mentioning it amid a section discussing the media hype. WHO probably won't pay that much attention to the media hype; if we cover it (which I say we most definitely should), we'll have to depend on sources that aren't primarily medical. Nyttend (talk) 05:19, 5 August 2014 (UTC)
Examination of sources for determination of strain
I'm a writer who has researched Ebola as a hobby for almost 10 years. I have zero Wikipedia experience other than using it for research. I often follow sources randomly and is how I found this oddity. I had to make an account to just post this and did so because I consider it so important.
This is what I found when I looked at the sources saying this is Ebola Zaire and I believe it needs more eyes on it.
There were 3 reports listed as sources 11-13.
11. (http://www.nejm.org/doi/full/10.1056/NEJMoa1404505?query=featured_home&&#t=article) This source is the initial study done to determine the strain. It's dated 4.16.14. It appears to be solid research backed by a large number of doctors. It shows this not to be Zaire, but something 97% similar and shows where those differences are in the genome.
12. (http://epidemic.bio.ed.ac.uk/ebolavirus_phylogeny) This is the second source and the first one that says it's Zaire. It seems to be a more general, much less precise reanalysis of the data. It also seems to reference the first study and is dated only the day after.
13. (http://www.afro.who.int/en/clusters-a-programmes/dpc/epidemic-a-pandemic-alert-and-response/outbreak-news/4071-ebola-haemorrhagic-fever-guinea-30-march-2014.html) This source is the whole reason I'm typing this. This source is listed as the source for the third/last study, yet is dated more than two weeks before the extensive April 16th study. What would be a real source for this doesn't seem to exist.
It appears that there was an initial study, then a quick relook, and the 3rd was never done in any form. — Preceding unsigned comment added by Ephiroll (talk • contribs) 21:19, 9 August 2014 (UTC)
- The first source says explicitly that it is Zaire, not least in the title. It is a 97% match for particular Zaire strains in the past (that's based on analysis at the Pasteur Institute at the very early stages). All Zaire strains vary a bit because of genetic drift. What it concludes is that it is an new clade; ie. a strain of Zaire which evolved parallel to the others in the rest of Africa. However, that conclusion has been twice refuted by later studies which place it in the known lineage of Zaire. Donners (talk) 22:27, 9 August 2014 (UTC)
- You don't understand what I'm saying. This second study you say refutes it doesn't exist. That's source 13. The April 16th study was the first study and shows only 97% similarity to Zaire. Then the source 12 link is the second study that was completed within 24 hours of the first that shows opposite results. (Edit: Opposite results here meaning not diff strain but Zaire.) Then the source for the third study is dated March 30. That's 17 days BEFORE the second study. Upon further study, I can't find anything on the internet that would be a legitimate source for the last/3rd study. All sources for it leads back to this fake source dated 18 days before it could have been done.--jerry — Preceding unsigned comment added by Ephiroll (talk • contribs) 23:01, 9 August 2014 (UTC)
- You're said, in reference to source 11, "It shows this not to be Zaire, but something 97% similar". Read the source. It says explicitly in the abstract "Virologic investigation identified **Zaire ebolavirus (EBOV)** as the causative agent." How can you say it shows it not to be Zaire when it explicitly says that it is?! The studies which refute its conclusions about the **clade** are these, which were published subsequently:
- The sources have been mixed up. They should be the ones cited, not 12 and 13. I have corrected them. Donners (talk) 00:40, 10 August 2014 (UTC)
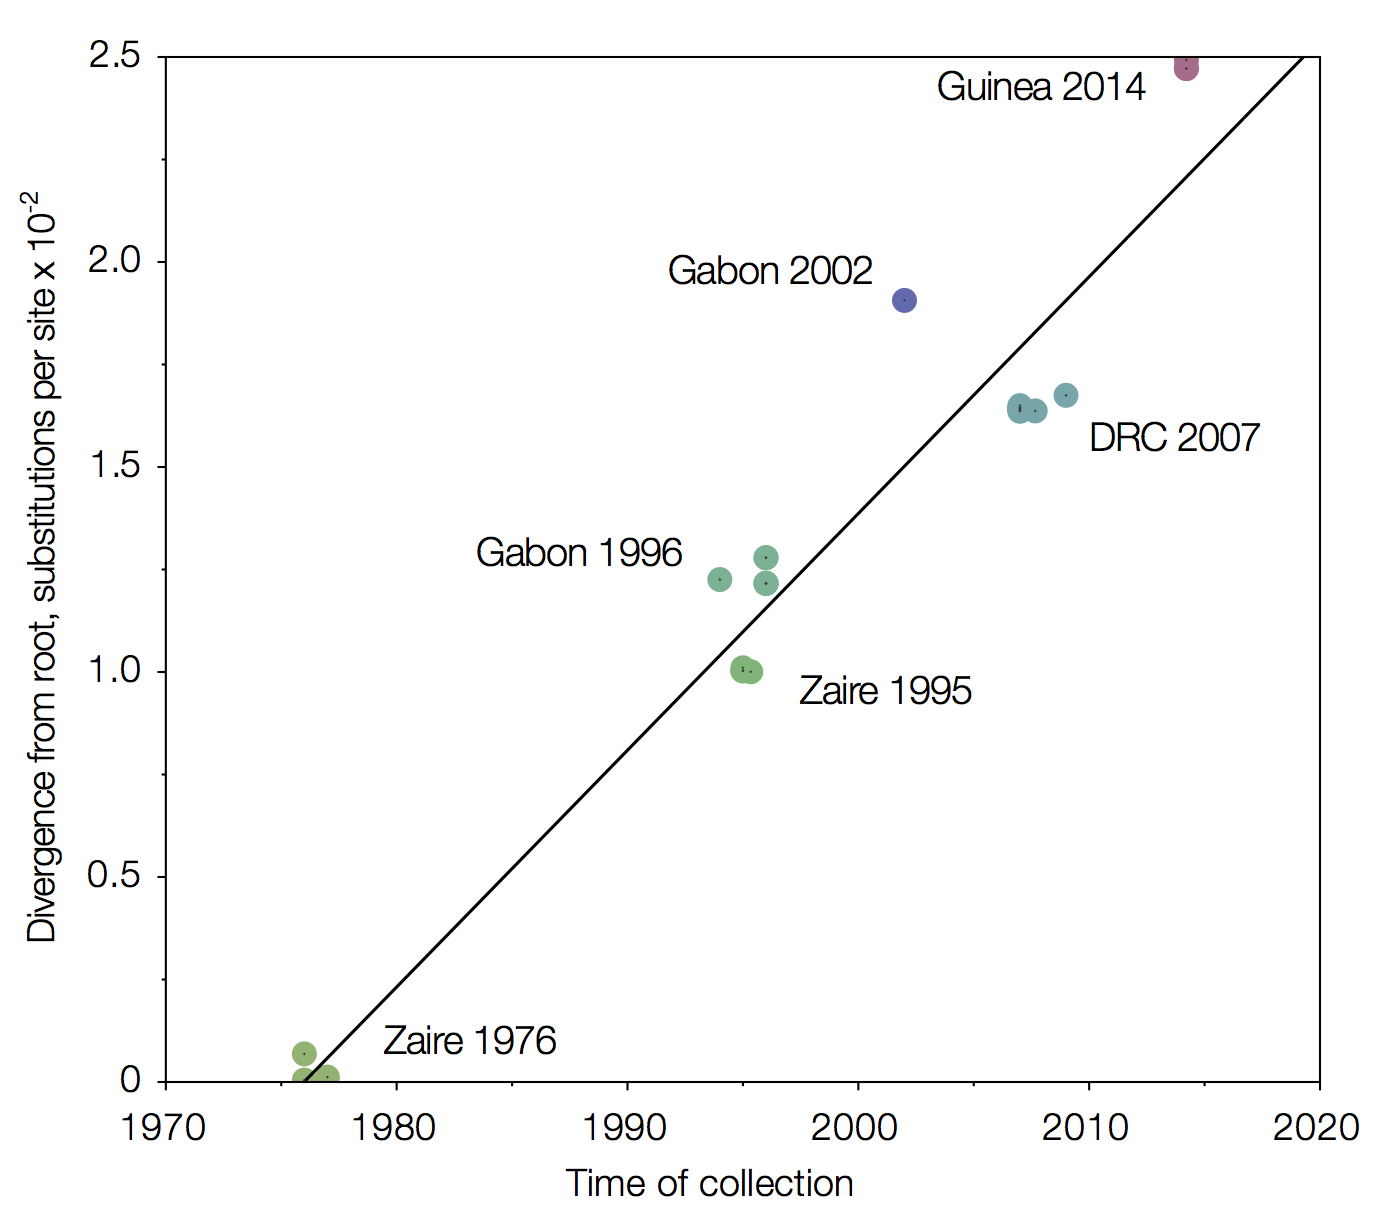
- Okay, very interesting links there. But still, nothing is saying the 3% isn't right. 'The overall genetic diversity within the Zaire ebolavirus species is low, with a maximum 2.7% nucleotide difference between sequences. Within a single outbreak, genetic diversity was even lower.' According to that, 3% is more than it should be and would make a new strain. Source: http://jvi.asm.org/content/87/5/2608.full --jerry — Preceding unsigned comment added by Ephiroll (talk • contribs) 01:36, 10 August 2014 (UTC)
- CDC still has 97% stated as the similarity percent on the newest update page: http://www.cdc.gov/vhf/ebola/outbreaks/guinea/index.html They stand by that number, so why not stand by it being outside its normal genetic range according to research? No one seems to argue with the amount of difference, only what that difference means.--jerry — Preceding unsigned comment added by Ephiroll (talk • contribs) 02:40, 10 August 2014 (UTC)
- All known Zaire ebolaviruses seem to have evolved from the 1976 isolate. That time period doesn't give much room for diversity, but it will only increase with time. This graph makes it very clear: http://currents.plos.org/outbreaks/files/2014/04/EBOV_cds_mb_path.png Donners (talk) 03:18, 10 August 2014 (UTC)
- Wow, that's close. And interesting. The next mutation will almost certainly be far outside the criteria for a new one. Thanks.--jerry — Preceding unsigned comment added by Ephiroll (talk • contribs) 03:40, 10 August 2014 (UTC)
- I swear, I'm not a nut or conspiracy theory person. The actual sources given in this Wikipedia article don't show a third study. If someone has a real source for #13 then I would love to see it. I'm trying to find one and can't. Been trying all day.--jerry
Edit: This is the sentence clearly showing that #13 is the 3rd study, aka the second to refute. (An initial report suggested that it was a new strain of ebolavirus,[11] but this was refuted by later studies which placed it within the lineage of the Zaire strain.[12][13]) — Preceding unsigned comment added by Ephiroll (talk • contribs) 23:49, 9 August 2014 (UTC)
- Please. If anyone reading this who doesn't think I'm a nut can get a message to them over there. It's got to be tested again.--jerry www.ephiroll.com — Preceding unsigned comment added by Ephiroll (talk • contribs) 00:33, 10 August 2014 (UTC)
- "Got to be" - why? All viruses drift somewhat, that's why the criteria say things like "> or < 50% difference" rather than "is identical". A virus that drifts slightly more or less is probably going to be no different for vaccine or treatment purposes - the treatment so far for all species (which are a lot more than a few percent different) is identical: rehydrate etc. Any current vaccine will surely be developed and tested against this strain and not some arbitrary reference strain, or target commonalities between all 4 species. So I'm not sure what "has" to be said, or has "got to be tested again", ore why anyone needs to "get a message through". Even if it is more of a drift than a few percent I'm pretty sure that will be within spec for research on the virus as explained. If not, then Wikipedia is not the place to look for communication on it, we just write articles based on current recognized information. As above, currently this is that it's firmly within EBOV as of now. FT2 (Talk | email) 14:33, 12 August 2014 (UTC)
Another important Sierra Leone doctor is infected
'Dr Modupe Cole, a senior physician at the country`s main referral facility, Connaught Hospital, was infected after treating a patient who died and was later found to have had the virus, the ministry of Health and Sanitation said Saturday.' http://www.africareview.com/News/Another-Sierra-Leone-doctor-contracts-Ebola/-/979180/2414158/-/kfkk7cz/-/index.html — Preceding unsigned comment added by Ephiroll (talk • contribs) 19:51, 10 August 2014 (UTC)
- Good info, thanks. I added this to the article, with the corrected ref link. –Patrug (talk) 10:00, 14 August 2014 (UTC)
Deaths/cases graph
Could be intesesting to have a graph with the deaths and cases vs date. The source should be Center for Dis. Cont. But should be splitt by country or add all to one? I can do it fast in Mathematica but I think is better to use a Wikimedia SVG Chart in order to let anyone update it. Could anyone help me on that? — Preceding unsigned comment added by Leopoldo Martin R (talk • contribs) 07:32, 9 April 2014 (UTC)
new numbers, april 17th: http://www.who.int/csr/don/2014_04_17_ebola/en/ — Preceding unsigned comment added by Lozion (talk • contribs) 03:37, 18 April 2014 (UTC)
- I've created a new one, but prior to reading this and Wikimedia SVG Chart's in general, so it's SVG but not easily updatable unfortunately (converted from Excel). I'll try to keep it up-to-date until I can get my head around these or someone beats me to it. -Oosh (talk) 03:27, 3 July 2014 (UTC)


- I've created an SVG plot that also has switch translations for several languages. The data is plotted as points rather than a piecewise linear function. New points can be added by following the pattern in the SVG file. That is, download the most recent SVG file from Commons, edit it in a text editor, and then upload the changed file. The data portion looks like:
    <!-- Data points -->
    <!-- x coordinate = Julian Day * 2  (1 Jan 14 = 0, 2 Jan 14 = 2) -->
    <!-- y coordinate = -0.1 * individuals -->

    <!-- 1 Aug 2014 1604 887 -->
    <use xlink:href="#markCt" x="424" y="-160.4"><title>1604</title></use>
    <use xlink:href="#markXt" x="424" y="-88.7" ><title> 887</title></use>
- edited to use specific marks. Glrx (talk) 20:31, 15 August 2014 (UTC)
- Additional languages or partial translations can slso be added. Glrx (talk) 02:49, 6 August 2014 (UTC)
- It would be great to see graphs for each individual country. I have done so in Excel for Liberia and Sierra Leone, and they are really different, L seems like a curve, SL a straight line. Dekritischelezer (talk) 08:40, 6 August 2014 (UTC)
- I'm getting ready a new one by using OpenOffice Calc to be able to update easily, as your language detection didn't seem to work out properly (and for personal use to detect bad updates through lots of rules). It's taking some more time though, as I'm reviewing all data according to CDC, thus having to cope with lots of issues, even with some incorrect sums. Sums are sums, I can't believe CDC making this kind of mistakes with such an international official media plus such an important matter that is reviewed million times! -.-
- Anyway, thanks. --Guarddon (talk) 17:11, 15 August 2014 (UTC)
- What do you mean the language detection didn't seem to work out properly? WP requires language to be selected specifically with
lang="zh"; I added a Chinese language version above. - Yes, the data is buggy. I'd like to include earlier points from CDC, but I'm about to give up on that data.
- The country plots are very different. I thought I could throw all of them on a semilog plot, but they ran over each other.
- Glrx (talk) 20:31, 15 August 2014 (UTC)
- What do you mean the language detection didn't seem to work out properly? WP requires language to be selected specifically with
Trend/Fit line
This is WP:OR and should be removed. Only the WP:RS data should be represented. -Oosh (talk) 07:41, 30 July 2014 (UTC)
- What is not realiable, the fit, the derivative, the the points of cases vs time or the points cases per day vs time?
- The fitting was done to the cases vs time and the derivative of this fit was shown as cases per day line, and the points are what some people is asking to add as the cases per day of each data step.--Leopoldo Martin R (talk) 10:04, 30 July 2014 (UTC)
- All of it. I'm not questioning the accuracy of your work. The problem is it is your work (WP:OR). It is not taken from a reliable source in the wiki sense of the term(WP:RS).
- I suggest you remove the fit on the cases, make it a simple scatter plot, the trend is self-evident anyway so we lose nothing and remain within the bounds of wii.
- -Oosh (talk) 23:46, 30 July 2014 (UTC)

Deseased per day Ebola 2014 - Thanks! Now I understand the issue. Please take a look to the new version and let me know if it looks suitable fow wii.--Leopoldo Martin R (talk) 17:17, 1 August 2014 (UTC)
- Where is the data for the per day chart coming from? -Oosh (talk) 11:03, 2 August 2014 (UTC)
- I think this is a poor graph. The data is discrete, so it should not use a piecewise linear graph. There's also a problem with timing. If there are no reports for 3 days, and then there's a report of 60 cases, should those cases be assigned to the day of the report or spread out over the three days? The graph has too many problems. Glrx (talk) 02:41, 6 August 2014 (UTC)
- I count two problems. That's not very many problems... and I'm not even convinced they are actually problems. I don't understand why you think a piecewise linear graph is inappropriate for discrete data. For timing, I think it's obvious that the proper thing to do is have one data point for each report, in units of new cases per day. So, 60 cases over 3 days would give you 20. I assume that is what he's been doing. I support updating the chart and putting it back in the article.--Taylornate (talk) 05:31, 6 August 2014 (UTC)
- I think this is a poor graph. The data is discrete, so it should not use a piecewise linear graph. There's also a problem with timing. If there are no reports for 3 days, and then there's a report of 60 cases, should those cases be assigned to the day of the report or spread out over the three days? The graph has too many problems. Glrx (talk) 02:41, 6 August 2014 (UTC)
- Where is the data for the per day chart coming from? -Oosh (talk) 11:03, 2 August 2014 (UTC)
- The graph is done in Mathematica using this:
DateListPlot[{Unexy[Drop[datess, 1],Differences[cases]/Differences[datess]*1.*3600*24],Unexy[Drop[datess, 1],Differences[deaths]/Differences[datess]*1.*3600*24]}, PlotRange -> All, Frame -> True, FrameLabel -> {"Date", "Casualties per day"}, LabelStyle -> {Medium}, Joined -> True, PlotLegends -> Placed[{"Cases per Day", "Deaths per day"}, Right], PlotStyle -> {Directive[Thick, Red], Directive[Black, Thick]}]
- Where Unexy just mergue x data to y data inside a single array {{x1,y1},{x2,y2},...}
- Drop delete the first point.
- Differences take the difference between consecutive data points
- And datess is the absolute timing in seconds with is the way that I like more to work with temporal data.
- All the other is just format for the plot.
- Feel free to draw it again or ask me to change it. Add it to the article if you want.--Leopoldo Martin R (talk) 12:34, 12 August 2014 (UTC)
- Be advised that this discussion has continued below under #Ambiguity_in_Timeline_Graph.--Taylornate (talk) 21:02, 14 August 2014 (UTC)
Ambiguity in Timeline Graph
As an informed layman it was not clear to me that this was a graph of total cases and not new cases. I'd like to see a little more explanatory text of precisely what measurements are depicted and I think a graph showing NEW cases per unit time in the manner of the daily cases graph on the talk page. Such a graph makes it more obvious how the outbreak is progressing. While total cases will only go up, the number of new cases will peak (perhaps already has) and begin to decline, giving a better graphic representation of the extent of the disease at any one time. Think of it like a population. The total historic population of even an extinct species cannot go down, but saying that the total historic population of dinosaurs is presently six make-a-guess-illion doesn't really help you understand that the current population is zero. (Depending a little on your cladistic definitions, of course.) The total number of cases in the outbreak thus far may well be a couple thousand, but how many people are suffering from the disease right now? (And how many were there yesterday and last week.) New cases isn't a precise measure of that, but at least it gives you an understanding of extent. (And I'd guess it's easier to measure.)
The readership thanks you for your support. — Preceding unsigned comment added by SymphonicPoet (talk • contribs) 21:10, 11 August 2014 (UTC)
- We had something a bit like that, averaging the number of cases between dates, but as it was derived from the data at hand (i.e. original research) it had to go. If you can find a reliable source providing the necessary data I'm sure it would make a re-appearance. -Oosh (talk) 00:21, 12 August 2014 (UTC)
- In the mean time I've updated the description text to "Cumulative totals of cases and deaths over time." Hopefully that's a little clearer. -Oosh (talk) 01:26, 12 August 2014 (UTC)

- (e/c) Cases per day is not a very good metric because the number is small and has a lot of variance. In two days, the cases went up by 68 (34/day); three days later, cases were up by 69 (23/day). I hope that's a tapering off, but it might be due to randomness, the way cases are discovered, or even structural timing such as the weekend (more transportation delays; some labs closed or understaffed). The thing we want to see is a slowing growth in cases (such as around May 1) rather than the horrendous exponential since June 1.
- In some ways, it would be better to show the trend on a semilog graph such as the one at right; it will also give more room for individual countries. The semilog plot shows exponential growth as a straight line and gives a better impression of the long term trend. The semilog plot, however, does not have the same impact as a linear plot. Glrx (talk) 01:28, 12 August 2014 (UTC)
- I understand what you're looking for, and agree that it is something that would be useful to have. But like Glrx indicates, the 'new cases per day' number jumps around so badly that you can't see any meaningful trend when it is plotted. Maybe if you plotted 'new cases in last three weeks' you might get something more meaningful. --Aflafla1 (talk) 15:40, 12 August 2014 (UTC)
- In my opinion a good way to reach the point would be something like a 4-week relative value. I've been doing by mind to reach the real situation of the illness developement. Just an example, 6 AUG data is 1779 cases. This numer would be checked for 3 JUL wich is not official day, i have done an aritmethical media between closer days considering same infections for those days, doing this on 3rd July there were 773 affected, this is a groth of +130%. Doing the same for the 9th Aug the data would be 1848 affected for 816 on July 6th for a total increase of +126%. Doing this calculations for all the data we have we could reach much more closer how the outbreak is moving and would give much less moving info as if we take just the last infected data. Excuse my english i'm not native ilasamper (talk) 19:38, 12 August 2014 (GMT+1)
- Interpreting and manipulating data like that represents original research in my book. -Oosh (talk) 23:46, 12 August 2014 (UTC)
- Here's a CDC bar graph for earlier numbers that uses weekly averages. The graph is not very illuminating. Even summing 2 or 3 weeks does not look like it would help.
- http://www.cdc.gov/mmwr/preview/mmwrhtml/mm6325a4.htm
- Although we can use various moving averages to smooth the data, it's not clear what such smoothed data means. Infection is something that by its nature has burst characteristics. A family member gets infected, theres some delay, and then 3 or 4 family members get infected.
- Intriguingly, the graph can supply earlier Guinea numbers for cases for the weeks ending:
- Jan 1, 2 = 2
- Jan 8,
- Jan 15,
- Jan 22,
- Jan 29, + 5 = 7
- Feb 5, + 3 = 10
- Feb 12, + 6 = 16
- Feb 19, + 2 = 18
- Feb 26, + 5 = 23
- Mar 5, +18 = 41
- Mar 12, +10 = 51
- Mar 19, +33 = 86
- Mar 26, +24 = 110
- Apr 2, +35 = 145
- Unfortunately, the data doesn't quite sync. The ending Mar 19 = 86, but 86 is Guinea cases for March 26 in the article. The ending March 26 = 110, but that does not match the article's Apr 2 value (which is 127). The Jun 18 total is 398, and that exactly matches the article's Jun 18 value. (I didn't total the 398.) The 528 number also matches Jun 18.
- What am I doing wrong? Glrx (talk) 01:33, 13 August 2014 (UTC)
- Nothing, WHO is 'numerically challanged'. Because of this you really can't take too much stock in their numbers. --Aflafla1 (talk) 11:59, 13 August 2014 (UTC)
- I can't Agree, calculating the increase of the number of infected in % is not interpreting nothing, interpreting would be to give an opinion about the outbreak is going up or down, the interpretation would be done by readers. I would agree on the minimal manipulation necessary to reach the real data of non-official-data days, but it could be unnecessary also if we do not place numbers but just a grafic calculated over estimated points, and the numbers just for the real points.Ilasamper (talk) 05:32, 13 August 2014 (UTC)
- It is irrelevant what "the minimal manipulation necessary" is, if it is more than a routine calculation, then it is synthesis, and that's classified as original research. -Oosh (talk) 07:25, 13 August 2014 (UTC)
- It is exactly the same manipulation we are doing at this moment on the graphic displayed. When we draw a line between 2 real points we are doing exactly the same i'm asking for here. If you don't agree to this then we should remove that line graphic and replace it by one representing data by dots Ilasamper (talk) 08:19, 13 August 2014 (UTC)
- Which is why I requested that one be altered to a scatter plot. See: Talk:2014_West_Africa_Ebola_virus_outbreak#Trend.2FFit_line. -Oosh (talk) 09:39, 13 August 2014 (UTC)
- Ok I agree, in my opinion is a bit extreme, but your argumentation is reasonable. I'll try to find another way to represent how the infection is advancing without using any non-official data Ilasamper (talk) 11:15, 13 August 2014 (UTC)
- Which is why I requested that one be altered to a scatter plot. See: Talk:2014_West_Africa_Ebola_virus_outbreak#Trend.2FFit_line. -Oosh (talk) 09:39, 13 August 2014 (UTC)
- I have to agree with Ilasamper here in that simple manipulations of data are not original research, as long as you're not interpreting what they mean. Calculating a % increase in a number over a previous one is not original research. WHO's numbers, though are pretty rough. They seem to be numerically challenged, unable to understand basic accounting. Hard to say how they reach their counts when the summing the 'number of new cases' doesn't add up, even closely, to the totals.--Aflafla1 (talk) 11:56, 13 August 2014 (UTC)
- It is exactly the same manipulation we are doing at this moment on the graphic displayed. When we draw a line between 2 real points we are doing exactly the same i'm asking for here. If you don't agree to this then we should remove that line graphic and replace it by one representing data by dots Ilasamper (talk) 08:19, 13 August 2014 (UTC)
- It is irrelevant what "the minimal manipulation necessary" is, if it is more than a routine calculation, then it is synthesis, and that's classified as original research. -Oosh (talk) 07:25, 13 August 2014 (UTC)
- There are more issues than just WP:OR or WP:CALC or even WP:SYN. There's editorial judgment.
- We have sources that provide data points. We can certainly plot those points (or make bar graphs). We can also plot the points on a semilog plane; that's manipulation, but it is a common practice for presenting data. Such a plot helps show a linear trend line for an exponential function.
- There's an issue about whether we can connect (interpolate) successive points with a line. I don't exactly love the practice because it is a continuous represention of a discrete process (a person is either infected or not). When the numbers get large, the effect is small, discrete processes begin to look continuous, and there is little harm. But how large is large? When we start looking at day-to-day changes, the numbers are still small.
- Instead of a piecewise linear fit, there may be some better trend lines to use. I think it is WP:CALC to make a least-squares fit of a function to a set of points. The problem is choosing which function to fit. There are plenty of functions out there, and nobody is telling us a good one. We could choose a bunch of functions, perform the fits, and select one based on its degrees of freedom and reduced chisquare. Maybe we can fit a simple function, but better fits are probably WP:OR; we'd be exercising our judgment.
- There are some simple calculations that could be done. A percentage increase over the previous value is simple enough to do. The problem is that when we do it, we get a number that jumps around and does not provide any significant insight. I would use editorial judgment to exclude such numbers rather than OR or SYN. There might be a better simple calculation, but point-to-point calculations will be noisy because the numbers are small.
- A moving average is also a simple calculation, but then we get into the same function trouble: which moving average should be used? If some RS on diseases told us a resonable calculation to make, then we might be able to do that calculation without treading too hard on WP:SYN.
- To me, the real bottom line is whether the plot or calculation provides something reasonable. If it doesn't look reasonable, then we should not put it in.
- Glrx (talk) 17:03, 13 August 2014 (UTC)
- This would be the data. Consider it and decide. In my opinion gives a lot of information. ANd working by countries more... would also avoid initial info because until spread reaches al least around 100 infections data appears to be superbig, and it's not realistic
- 11AUG -- 14 JUL (TOT)1975/949= +108% (GUI) 510/409= +25% (LIB)670/166= +303% (SIE) 783/376= +108%
- 9AUG -- 12 JUL (TOT)1848/918= +101% (GUI) 506/409= +24% (LIB)599/154= +289% (SIE) 730/357= +104%
- 6AUG -- 9 JUL (TOT)1779/866= +105% (GUI) 495/409= +21% (LIB)554/137= +304% (SIE) 717/321= +123%
- 4AUG -- 7 JUL (TOT)1711/830= +106% (GUI) 495/409= +21% (LIB)516/127= +306% (SIE) 691/294= +135%
- 1AUG -- 4 JUL (TOT)1603/787= +103% (GUI) 485/411= +18% (LIB)468/115= +307% (SIE) 646/261= +148%
- 30JUL - 2 JUL (TOT)1440/759= +90% (GUI) 472/413= +14% (LIB)391/107= +265% (SIE) 574/239= +140%
- 27JUL - 30 JUN (TOT)1323/719= +84% (GUI) 460/407= +13% (LIB)329/93= +254% (SIE) 533/219= +143%
- 23JUL - 26 JUN (TOT)1201/639= +88% (GUI) 427/396= +8% (LIB)249/65= +283% (SIE) 525/278= +194%
- 20JUL - 23 JUN (TOT)1093/587= +86% (GUI) 415/392= +6% (LIB)224/48= +366% (SIE) 454/148= +207%
- 18JUL - 21 JUN (TOT)1048/564= +86% (GUI) 410/394= +4% (LIB)196/42= +366% (SIE) 442/128= +245%
- 15JUL - 18 JUN (TOT) 964/528= +83% (GUI) 406/398= +2% (LIB)172/33= +421% (SIE) 386/97= +297%
- 10JUL - 13 JUN (TOT) 888/494= +78% (GUI) 409/382= +7% (LIB)142/20= +610% (SIE) 337/92= +266%
- 8JUL -- 11 JUN (TOT) 844/481= +75% (GUI) 408/375= +9% (LIB)131/15= +773% (SIE) 305/90= +239%
- 2JUL -- 5 JUN (TOT) 759/438= +73% (GUI) 413/344= +20% (LIB)107/13= +723% (SIE) 239/81= +195%
- 24JUN - 27 MAY (TOT) 599/309= +93% (GUI) 390/281= +38% (LIB)51/12= +325% (SIE) 158/16= +888%
- 18JUN - 21 MAY (TOT) 528/265= +99% (GUI) 398/252= +57% (LIB)33/12= +175% (SIE) NO DATA
- Can someone do my job pretty and place it in a graph to see it clearly?Ilasamper (talk) 18:37, 13 August 2014 (UTC)

The problem is that when we do it, we get a number that jumps around and does not provide any significant insight.
— User:Glrx- This is not a problem. There is no reason not to show the noisy cases per day graph, and no reason to try to smooth it out. I agree that any sort of smoothing would be WP:OR while a simple calculation of cases per day would not. I strongly disagree that the noise inherent in the data decreases its insightfulness. As I stated in the earlier discussion, I also see no problem with connecting the dots (piecewise linear). I prefer the piecewise linear plot, but I would be ok with a scatter plot. I propose we add this plot back to the article. For reference, there is some discussion higher on the page at Talk:2014_West_Africa_Ebola_virus_outbreak#Trend.2FFit_line. The author of the graph has been good about updating it, and has indicated that he is willing to make changes.--Taylornate (talk) 21:16, 13 August 2014 (UTC)
We don't have any "cases per day" data, what we have is overall figures updated every few days, it is a routine calculation but the resultant number would be an average and that would need to made clear. -Oosh (talk) 23:35, 13 August 2014 (UTC)
- Would changing to a scatter plot clear that up from your view? What else would you propose? Personally, I don't see what is unclear. Cases per day is number of cases divided by number of days. It is explicitly clear and does not imply that there is one data point per day. I wouldn't be opposed to some explanatory text as a figure caption, or to changing to a scatter. Anyway, I'm going to put it back in for now. We can continue to discuss and make improvements, but I don't see how any of this discussion implies that there are such egregious problems that it should stay out of the article for now. Looking at previous discussion, it was removed for reasons that have since been resolved.--Taylornate (talk) 00:46, 14 August 2014 (UTC)
- We may be able to come to a compromise position... please don't jeopardise that by jumping the gun and acting unilaterally. Let's get this right. -Oosh (talk) 02:34, 14 August 2014 (UTC)
- Averaging to get 'cases per day' is most certainly allowable. Your objection is totally without merit here.--Aflafla1 (talk) 00:52, 14 August 2014 (UTC)
- I wouldn't say the objection is totally without merit. It is a narrow objection because the resulting plot may not reflect the actual cases per day. I'm sympathetic to the objection, but I'm willing to accept simple averages. Glrx (talk) 01:30, 14 August 2014 (UTC)
- Please re-read what I wrote and try not to be so dismissive it's counter-productive. -Oosh (talk) 02:34, 14 August 2014 (UTC)
- Dismissive? You are the one being dismissive of this chart. You removed it because it contained a trend line that violated WP:OR. I agree with that reasoning, but the WP:OR trend line has been removed. So I added it back, with an edit summary stating that the WP:OR issue has been resolved.[1] You reverted me, stating that it has not been resolved.[2] So please tell me, what is the WP:OR issue with the current chart, or what other policy reason do you have for removing it now? I'm happy to continue to discuss and to compromise on specific details of the chart, but we can do that with the chart in place. If you remove it again, please back your reasoning with policy.--Taylornate (talk) 20:59, 14 August 2014 (UTC)
- There are many issues being addressed here. There's whether an average is appropriate (OR v CALC), the level of disclosure such a graph should make ("but the resultant number would be an average and that would need to made clear"), the appropriate presentation (scatter, piecewise linear, bar), and whether the graph is appropriate to include. I think there is consensus that providing a cases-per-day graph would be permissible, but some issues still remain as evidenced in the discussion below. We are in the discussion stage of WP:BRD. Glrx (talk) 21:49, 14 August 2014 (UTC)
- Dismissive? You are the one being dismissive of this chart. You removed it because it contained a trend line that violated WP:OR. I agree with that reasoning, but the WP:OR trend line has been removed. So I added it back, with an edit summary stating that the WP:OR issue has been resolved.[1] You reverted me, stating that it has not been resolved.[2] So please tell me, what is the WP:OR issue with the current chart, or what other policy reason do you have for removing it now? I'm happy to continue to discuss and to compromise on specific details of the chart, but we can do that with the chart in place. If you remove it again, please back your reasoning with policy.--Taylornate (talk) 20:59, 14 August 2014 (UTC)
- Oppose insertion of the cases per day graph. It has lots of noise and little insight. Even if I were to support its inclusion, then I'd want it in the form of a bar chart where the width of the bars varied to show the number of days for the data point and the area represented the new cases. Glrx (talk) 01:30, 14 August 2014 (UTC)
- Would you please explain why you think the chart is not insightful and what the noise has to do with that? I don't understand at all.--Taylornate (talk) 21:07, 14 August 2014 (UTC)
- As I've stated above, there's a lot of variance in the data. That variance is due to randomness and other factors (e.g., timing, discovery, diagnosis, or political whims). If we were to discuss the national economy, a detailed look at a day-to-day stock market index would not provide a lot of insight. The long-term trend is important. If someone looks at the current plot, he will wonder what happened around Aug 1. The chaotic jumps (noise) have too much impact. Glrx (talk) 21:49, 14 August 2014 (UTC)
- I have two separate but related points. First, people are good at pattern recognition. The average reader should have no trouble looking at this plot and recognizing the overall trends. Second, the scenario you describe will still happen without the chart, as people look at the new rows in the table coming in, and new points added to the cumulative chart. The cases per day chart won't make this worse, rather, it will help by providing context. Without the chart, someone looking at the table (and cumulative chart) when the August 1st data point came out may wonder what happened, just as you say. The cases per day chart in this scenario would show the reader that the data is noisy and that this spike may be a nonsignificant outlier. To put it another way, the noise is absolutely present in the table and cumulative chart, and the cases per day chart helps people understand it. Attempting to hide the noise just causes more confusion.--Taylornate (talk) 22:20, 14 August 2014 (UTC)
- Well put, Taylornate — I strongly agree. Long-term trends and short-term randomness are the two most-important aspects of any time series, and a straightforward graph is usually the quickest way for people to see both aspects in perspective. —Patrug (talk) 08:49, 15 August 2014 (UTC)
- I have two separate but related points. First, people are good at pattern recognition. The average reader should have no trouble looking at this plot and recognizing the overall trends. Second, the scenario you describe will still happen without the chart, as people look at the new rows in the table coming in, and new points added to the cumulative chart. The cases per day chart won't make this worse, rather, it will help by providing context. Without the chart, someone looking at the table (and cumulative chart) when the August 1st data point came out may wonder what happened, just as you say. The cases per day chart in this scenario would show the reader that the data is noisy and that this spike may be a nonsignificant outlier. To put it another way, the noise is absolutely present in the table and cumulative chart, and the cases per day chart helps people understand it. Attempting to hide the noise just causes more confusion.--Taylornate (talk) 22:20, 14 August 2014 (UTC)
- As I've stated above, there's a lot of variance in the data. That variance is due to randomness and other factors (e.g., timing, discovery, diagnosis, or political whims). If we were to discuss the national economy, a detailed look at a day-to-day stock market index would not provide a lot of insight. The long-term trend is important. If someone looks at the current plot, he will wonder what happened around Aug 1. The chaotic jumps (noise) have too much impact. Glrx (talk) 21:49, 14 August 2014 (UTC)
- Would you please explain why you think the chart is not insightful and what the noise has to do with that? I don't understand at all.--Taylornate (talk) 21:07, 14 August 2014 (UTC)
- Conditional support While I'm inclined to agree re: its (lack of) utility to the article, I'm not fundamentally opposed to its inclusion, provided it's done right. Not sure about the bar graph but I think we can hash out the details of how best to represent it BEFORE it's re-included within the article. -Oosh (talk) 02:34, 14 August 2014 (UTC)
- Conditional support.

- In the cited source (Disease Outbreak News), WHO itself is beginning each report with a sentence like: "Between 7 and 9 August 2014, a total of 69 new cases of Ebola virus disease as well as 52 deaths were reported." Surely it's a routine calculation to compute "Average Cases Per Day" and "Average Deaths Per Day" by dividing WHO's "new" reports by the number of included days. WHO and SymphonicPoet are correct that this is important and useful information. Oosh is correct that any numerical smoothing would be inappropriate original research. Taylornate is correct that the jumpiness is an important part of the data. Glrx is correct that each WHO average must be displayed for the corresponding number of days, whether it's a line graph or bar graph, so that the visual impact of 1-day averages and 9-day averages will be proportional. The simplest solution might be to repeat each average for each of the included dates. For example, the sentence that I just quoted from the WHO source could be graphed as (69÷3=) 23.0 "Average Cases Per Day" for 7 August and 8 August and 9 August. (Note that we could occasionally see negative averages, if the removal of suspected cases ever outnumbers new patients.) I would also recommend including the Cumulative graph twice, once with the linear vertical axis (which emphasizes how fast the number of cases is increasing), as we've been showing, and once with a logarithmic vertical axis (which emphasizes the proportional growth rate), as Aflafla1 helpfully plotted near the beginning of this section. The Timeline table is already large enough that there's plenty of space for displaying three thumbnail graphs to the right of the table: Cumulative (linear), Cumulative (log), and Average Per Day (linear). See what you think. —Patrug (talk) 06:41, 14 August 2014 (UTC)
- I support your proposal of having all three graphs, as they each provide their own insight. I'm undecided on how best to represent the cases per day. I think a scatter plot would be best, as a bar graph may be sort of clunky and harder to interpret visually. Though, I do understand the need to give weight based on the number of days. I oppose the idea of repeating data points, but maybe we could have heavier-looking data points for more days averaged, or have horizontal wings come out from each point.--Taylornate (talk) 22:32, 14 August 2014 (UTC)
- I'm realizing that my idea with the horizontal wings on a scatter plot is quite similar to a bar graph, except that only the tops of the bars are included. Could be a good compromise--It seems to be the best of both worlds.--Taylornate (talk) 22:37, 14 August 2014 (UTC)
- @Taylornate: Hmmmm... I'm wondering if a bubble chart is the go. With the bubble size based the number of days averaged? -Oosh (talk) 00:06, 15 August 2014 (UTC)
- I think that could work well. Regarding your use of the word average in the caption--I'm not going to revert it because I appreciate the compromise, but I don't think it is appropriate. To me, it implies that multiple data points have been averaged together, which is not the case. The units (cases per day) unambiguously explain that each data point total would be divided by number of days. Any specific frequency of data points is not implied by these units. Actually, as I think more about it, I'm not 100% sure it is inappropriate, either. I'd like to hear other people's view on this, preferably from those with backgrounds in statistics.--Taylornate (talk) 00:21, 15 August 2014 (UTC)
- After a long career in applied statistics (yes, you smoked me out), unfortunately I'm sure many casual readers assume that "cases per day" would represent an exact day-by-day count, rather than the result of a division. Even though the word "average" might not be strictly necessary, it helps reduce misunderstanding, so let's keep it as we continue to tweak the phrasing. However, the current graph still gives "undue weight" to WHO's shorter versus longer reporting periods. In choosing an appropriate graph format to convey the number of days represented by each data point, ideally we should try to keep it simple enough that multiple editors could update it without difficulty. Would this be true of your proposed bubble charts, or points with horizontal wings? If so, can someone post sample graphs of the WHO data in these formats, to see if they're visually better than simple line or bar graphs with repeated values? —Patrug (talk) 08:49, 15 August 2014 (UTC)
- I think that could work well. Regarding your use of the word average in the caption--I'm not going to revert it because I appreciate the compromise, but I don't think it is appropriate. To me, it implies that multiple data points have been averaged together, which is not the case. The units (cases per day) unambiguously explain that each data point total would be divided by number of days. Any specific frequency of data points is not implied by these units. Actually, as I think more about it, I'm not 100% sure it is inappropriate, either. I'd like to hear other people's view on this, preferably from those with backgrounds in statistics.--Taylornate (talk) 00:21, 15 August 2014 (UTC)
- @Taylornate: Hmmmm... I'm wondering if a bubble chart is the go. With the bubble size based the number of days averaged? -Oosh (talk) 00:06, 15 August 2014 (UTC)
- Conditional support.
- Same reasoning as for Oosh. As for the inclusion of the log plot, Glrx mentioned above a drawback, it doesn't have the impact of a linear plot, and I agree. But it does support that the growth in the last couple of months is exponential. I'm on the fence with it's inclusion, and leave it up to the community to decide whether or not it should be included. --Aflafla1 (talk) 12:30, 14 August 2014 (UTC)
- As an aside, one can fit a line to the data from end of May to present, and calculate the equation for the cumulative number of cases. Take the derivative of this and you get a good idea of the number of cases per day. (Turns out to be close to 50 presently, if you assume that the exponential growth rate is still continuing.) --Aflafla1 (talk) 12:30, 14 August 2014 (UTC)
- The observation from a log plot would not be cases per day but rather a ratio per unit time. Right now, the plot shows the cases are doubling every month (table above showing about 100 percent every 4 weeks). That would be a slope (increase) of 2.3 percent per day: 1.02330 = 2. Glrx (talk) 22:06, 14 August 2014 (UTC)
- As an aside, one can fit a line to the data from end of May to present, and calculate the equation for the cumulative number of cases. Take the derivative of this and you get a good idea of the number of cases per day. (Turns out to be close to 50 presently, if you assume that the exponential growth rate is still continuing.) --Aflafla1 (talk) 12:30, 14 August 2014 (UTC)
- Well, finally you added a graph. In my opinion this graph gives the same info as the cumulative one, and drives to confusion. Having a 100 new infected when the previous day they were 1000 is much worse than having 1000 when the previous day were 100000. We can't forget that the more agents infected there are, the most easy to cause more infections, so the real data to know the evolution of the spread is not the absolute number of infected but the relative. I really don't care if you want to add as the las 4 weeks as i placed before because its more stable o just add the easiest one, the refered to the previous info (11AUG would be 3,44% more infected per day than the 9 AUG) This would be real info about the spread and would allow people to realise if Ebola is spreading or fading. Ilasamper (talk) 06:25, 15 August 2014 (UTC)
- Ilasamper, a decrease in the percentage growth rate would indeed be welcome news. But Ebola won't be "fading" until the "absolute number" of new daily cases eventually trends downward, and the graph starts to become a bell curve. Almost everyone would say that 1000 cases per day are "worse" than 100, contrary to your argument. If new cases had a "relative" slowdown to a steady 1% per day, Ebola would still be "spreading", and still with exponential growth.
- Glrx, I was also thinking about the doubling time, and that it might be a simple, intuitive, and powerful item to include in the Timeline text of the article. Not a statistical fit (original research), but pure lookups from the WHO table and routine calculations of time intervals, with an academic citation confirming the concept — maybe a sentence like this:
Note that, as the WHO death toll rose past 80 (1 April) and 160 (5 May) and 320 (18 June) and 640 (20 July), each of these doublings occurred in 5 or 6 weeks, characteristic of an epidemic's exponential growth phase.<ref>{{cite web |url=http://www.bu.edu/today/2014/tracking-the-virus/ |title=Battling Ebola: Tracking the Virus |last=Seligson |first=Susan |publisher=Boston University |date=6 August 2014 |accessdate=15 August 2014}}</ref>
- What do you think? Meanwhile, great if someone is able to build & post a Log version of the Cumulative graph, matching the format of the Linear version as closely as possible, as the simplest way to graph the proportional growth that Ilasamper sensibly wants to convey. —Patrug (talk) 08:49, 15 August 2014 (UTC)
- A log plot is available. See above right. The trace colors are chosen to match the colors on the column headings in the article. Changing the one to red would be no problem. Eliminating background shade altogether also not a problem. One thing though: the graph contradicts what Susan Seligson states. An initial exponential growth segment (ending about mid April) showed much higher growth rate than 6 week doubling time. The later section (since end of May) shows a doubling time of a bit less than a month, also less than the 6 week doubling time she states. And between - it wasn't exponential at all. --Aflafla1 (talk) 18:56, 15 August 2014 (UTC)
- Yes Patrug, I agree, a doubling rate would be enough to show much more realisticly how the spread is evolving, i look at the cumulative or daily infections and I see it both exponential, and this could be too "scary" for readers. Having a Doubling time that mantains Stable will show much more clearly that the spread is not completelly "out of control" or if it is, WHERE it is will be much more clear to be seen than the other 2 graphs. This data makes real differences for each of the 3 affected countries. People should be ase Scared in Liberia than in Guinea Ilasamper (talk) 20:32, 15 August 2014 (UTC)
Semilog graphs
Ive uploaded a scatter and line-conected version of the graph. I want to upgrade it a little by tightening the margins, but please let me know if you think this row-style graph is Ok or single files are better. I´m more on the line-connected version of the graphs, its much more visual.


And this is the semiLog plot:

Im worried about the mismatch in the total vs country cases, could someone double check in the primary sources and perhaps correct it.--Leopoldo Martin R (talk) 19:01, 16 August 2014 (UTC)
- I think your row form display is too small. It also aligns the ordinates, but the ordinate scales are different. A column display would match the meaningful axis.
- I did a scatter logplot of totals and countries yesterday. I give it below and put the linear display in column below to match abscissas. There's no legend for the countries, but Guinea (green), Liberia (blue), Sierra Leone (yellow), and Nigeria (pink). It looks like Guinea and Liberia had control for awhile, but then it got away. Sierra Leone never had control. Nigeria looks like it has control.
- I thought it would be less confusing that it is; many points cover other points. Converting it to a line plot would make it less busy and possibly easier to follow. It has the problem that the low end of my log scale is a single case.


- The data errors are troubling, but the difference is large only for 18 and 24 June.
- signed later. Glrx (talk) 00:01, 17 August 2014 (UTC)


- I agree, the line-connected charts are more visually appealing and easier to read, and to me this outweighs the arguments against it, which I think are overblown. The scatter plot of cases per day is especially difficult to read.
- I think separate files arranged vertically on the page is the way to go. Vertical will fit better next to the table, and separate so they can each have their own figure text.--Taylornate (talk) 23:45, 16 August 2014 (UTC)

- Scatter plots look fine to me. As you say any crowding on per country one can be alleviated by using separate charts, if the axes ranges are kept the same they're still easily comparable.
- But if despite that any of it remains a bit of a mess I don't think that's a problem, it is instructional in the way it highlights the state of the underlying data, case in point (which I've added by way of example on the right) is a plot of results from opinion polling for the Scottish independence referendum.
- -Oosh (talk) 23:54, 17 August 2014 (UTC)

- What about just using a scatter plot but adding a trendline with the r-squared values? I'd hope that's not considered "original research." It's representing the data in a clear way. Snd0 (talk) 01:24, 17 August 2014 (UTC)
- Trendlines were discussed above; it's not clear that we should add them. Reporting R2 values does not fix the problem. How are the point variances chosen? Which function should be used for the fit? How many degrees of freedom should be used? Glrx (talk) 15:10, 17 August 2014 (UTC)
- I agree, a trend line would not be permissible under WP:OR.--Taylornate (talk) 22:05, 17 August 2014 (UTC)
- Trendlines were discussed above; it's not clear that we should add them. Reporting R2 values does not fix the problem. How are the point variances chosen? Which function should be used for the fit? How many degrees of freedom should be used? Glrx (talk) 15:10, 17 August 2014 (UTC)
Should data for Guinea/Sierra Leon/Libearia be graphed (continuation Graph discussion)
If I understand correctly Ilasamper has requested that this information be plotted on a log scale. The data that's come out of WHO for the last week doesn't look promising for getting this thing (as a whole) under control. It looks that things are ok in Guinea and Nigeria, but things are looking bad in Liberia. The rate is actually slightly worse than exponential, if you examine the data closely. The doubling time is roughly 24 days, down from around 30.66.41.154.0 (talk) 21:03, 15 August 2014 (UTC)
- I Think it's out of control everywhere, maybe Sierra Leona is starting to control it a bit, it's just that in Guinea the spread is not in the cities and their infected has never reached the exponentinal phase yet. That's Why I would like to represent this data. I would do it by myself but i'm not very good at excel work. 31.221.226.72 (talk) 06:25, 16 August 2014 (UTC)

- Yeah, the exponential line doesn't fit very well. A log scale could be useful in the near future (unfortunately). Of course the best fitting line are higher-order polynomials. Snd0 (talk) 01:43, 17 August 2014 (UTC)
- There's more to a good fit. Polynomials are poor choices for flat sections. This figure makes projections for future cases, and that treads on OR. Glrx (talk) 15:18, 17 August 2014 (UTC)
- I agree, but currently the exponential curve doesn't fit the data well. It's expected that it will eventually fit to an exponential trend (even in the Congo and Uganda outbreaks the initial growth didn't fit that line) [3]. Maybe curve fitting is premature. You're right though, I shouldn't have included any projection. Snd0 (talk) 20:27, 17 August 2014 (UTC)
- The projection certainly takes it a step further, but I think even without that, a trend line would be WP:OR.--Taylornate (talk) 22:07, 17 August 2014 (UTC)
- There's more to a good fit. Polynomials are poor choices for flat sections. This figure makes projections for future cases, and that treads on OR. Glrx (talk) 15:18, 17 August 2014 (UTC)
Type of English
I've just put {{Use British English}} in the article, as I believe it's the most appropriate, but it probably is up for debate... My case is that the language variant used falls along colonial lines, Sierra Leone & Nigeria were British, Liberia American, and Guinea French (so we can safely ignore that for the purposes of this discussion). Given it's 2 vs. 1, and there are (slightly) more cases/deaths (as of 12 August 2014[update]), UK should win out over US in this instance. -Oosh (talk) 03:45, 12 August 2014 (UTC)
- Is there such a thing as Leonese English? West African Commonwealth English? Liberian English is well recognised, but it's a weird mix of US and UK along with occasional influences from Mandingo and other native languages, and I'd advise against attempting to declare it our standard here. I've read lots of Liberian publications from the 1960s to the present (including checking the major newspapers' websites daily), but I still can't write in their style — let alone writing in a more-rustic style with vocabulary from Warren d'Azavedo's Some Terms from Liberian Speech, which I can't do at all. The best I can do is the use of occasional weird-in-other-contexts terms, such as "boss" twice in Drug Enforcement Agency, and I doubt that people less familiar with LR English could easily do better. It might be equally hard writing in Leonese English, if it's even a recognised variety. Nyttend (talk) 04:18, 12 August 2014 (UTC)
- There is an (albeit spartan) article on Sierra Leonean English, as there is for Nigerian English, but I'm not suggesting we use either (or Liberian English). This choice is, as I see it, between British and American to simply avoid "fights" over -ise/ize, -or/-our, etc. -Oosh (talk) 06:05, 12 August 2014 (UTC)
- Sorry for being unclear: I was attempting to say "I agree, and here's why". Nyttend (talk) 11:31, 12 August 2014 (UTC)
- There is an (albeit spartan) article on Sierra Leonean English, as there is for Nigerian English, but I'm not suggesting we use either (or Liberian English). This choice is, as I see it, between British and American to simply avoid "fights" over -ise/ize, -or/-our, etc. -Oosh (talk) 06:05, 12 August 2014 (UTC)
Copyright violation?
The article has material about patient 0 that is closely paraphrased from the New York Times article that was its source. Is this permitted?
- Denise Grady; Sheri Fink (Aug. 9, 2014). "Tracing Ebola's Breakout to an African 2-Year-Old". New York Times.
{{cite news}}: Check date values in:|date=(help)
- states
- Patient Zero in the Ebola outbreak, researchers suspect, was a 2-year-old boy who died on Dec. 6, just a few days after falling ill in a village in Guéckédou, in southeastern Guinea. Bordering Sierra Leone and Liberia, Guéckédou is at the intersection of three nations, where the disease found an easy entry point to the region.
- A week later, it killed the boy’s mother, then his 3-year-old sister, then his grandmother. All had fever, vomiting and diarrhea, but no one knew what had sickened them.
- Two mourners at the grandmother’s funeral took the virus home to their village.
- The WP article states
- Researchers believe that the first human case of the Ebola virus disease leading to the 2014 outbreak was a 2-year-old boy who died on 6 December a few days after falling ill in the Guinean village of Guéckédou. A week later the same illness killed his mother, then his three year-old sister became ill and died, and then his grandmother. They all had fever, vomiting, and diarrhea, but it was as yet unknown what had caused their illness. Next two people who had attended the grandmother's funeral carried the disease to their village and a health worker carried it to yet another village.
- The original insertion of the material.
Glrx (talk) 05:51, 12 August 2014 (UTC)
- It maybe could use some editing so as to reorder information or use additonal sources. --66.41.154.0 (talk) 14:24, 12 August 2014 (UTC)
Sorry... I really am... Ugh... I am so sorry... I wish i could repair it... I am so sorry... — Preceding unsigned comment added by 2600:E000:7:6680:280:AEFF:FE27:502D (talk) 09:52, 15 August 2014 (UTC)
- I've now had a go at recounting the same facts without the use of as much literal copying / close paraphrase as the previous wording. It now reads:
- Researchers believe that the first human case of the Ebola virus disease leading to the 2014 outbreak was a 2-year-old boy who died in December 2013 in Guéckédou Prefecture, Guinea.[9] His mother, sister and grandmother then died shortly afterward, after falling ill with symptoms consistent with Ebola infection. Following this, the disease was carried to other villages by people infected by this first outbreak.[1]
- The only remaining duplicated fragment, other than individual nouns, is now the text "was a 2-year-old boy", which is pretty much dictated by the combination of the facts and the constraints of normal English grammar and word ordering. Any extra sources that can be provided so that this text can be multi-sourced would be greatly appreciated. -- The Anome (talk) 16:50, 15 August 2014 (UTC)
- Looks like you accidentally reverted my addition of the actual name of the patient zero village, which I got from another source [4] -- Tim Starling (talk) 19:39, 15 August 2014 (UTC)
- @The Anome. Good job. There's no problem with repeating facts. There's a problem when the presentation follows original outline and says the same thing. Simple substitutions don't avoid copyright problems. Thanks. I think 3-year old sister is important because they probably played together. Glrx (talk) 20:10, 15 August 2014 (UTC)
- I've now had a go at recounting the same facts without the use of as much literal copying / close paraphrase as the previous wording. It now reads:
Censored news about real reasons for Liberian outbreak?
Yesterday the office of the National Chronicle of Liberia newspaper was raided by the police "Police Besiege Chronicle Newspaper". Daily Observer. and their publisher arrested "Liberia: Chronicle Publisher Arrested - Newspaper Shutdown". . Their newest articles informing about the coming coup and likely reasons for the ebola outbreak (corruption, incompetence) have been pulled down. I have quickly archived them (e.g. here) and compiled them all together here, with a quick intro: http://futurepresent-past.blogspot.com/2014/08/true-stories-about-ebola-part-4.html Do you think we should dig into such reports of the underlying cause here? National Chronicle of Liberia is not a newspaper of record by far, but e.g. the All Africa newspaper would foot the bill.
Timeline of the outbreak Table
The table in the timeline is a mess now. It seems to have too much info, plus some death and case totals have been deleted. All that really is needed is the WHO case/death totals for the countries in the different updates. A line or two at the bottom to inform people of any other information (like that some totals do not match or that some cases were reclassified, etc) would be cleaner. Rump1234 (talk) 04:59, 19 August 2014 (UTC)
- Although the table looks authoritative, it is far from it. The data is full of errors, unsourced, and some of it may be WP:SYN. Many numbers do not match the sources and do not have an explanation. Many of the notes I added show that the table fails WP:V. The data in the table needs to be fixed. Look at March 25 and 26; it looks like those rows can be fixed by just correcting some counts and sums. Jun 18 and 24 are harder; the WHO text gives some guidance for SL; the refs may provide enough to calculate better numbers from interval changes.
- Right now, there is no short answer to describe what is wrong with the data. Some of the dates are wildly off. Some of the data looks wrong. It's not clear right now. The standard way to deal with confusion is placing {{cn}} on the suspects; if it isn't dealt with, then the text/data is eventually removed.
- I've essentially been doing that. Instead of just tagging, I'm adding the citations to show from where the data came. I'm also finding a lot of bad or suspect data. The dates are also poorly tied to the data.
- I have not deleted any numbers, but I have gone through all the WHO reports in DON. I uncovered some reports that were not used, and that resulted in several new lines.
- The data is only clear after 1 July.
- In general, Guinea was reporting totals all the time, and that data seems reasonably stable. WHO was reporting no change since day X for other numbers.
- In large part, the table became ugly when auto sizing decided to make the data columns larger than they needed to be. I'm sure there is a way to shrink the fields to make the table pretty, but I'm not interested in pretty right now.
- The notes should be left in for a few days at least. Then there can be a debate about moving the data to another page, stuffing details into footnotes (possibly a special section), or employing some other method.
- However, before I go changing numbers in the table, I want the reasonableness of those changes discussed on the talk page. There have been many reasonable discussions in the sections above -- and some editors have remarked about problems with the table's data.
- Glrx (talk) 05:45, 19 August 2014 (UTC)
Date column
I as a start think altering the date field from "reported" to "as of" would be more accurate and go a long way to cleaning of the ref field. -Oosh (talk) 06:29, 19 August 2014 (UTC)
- Yes, "as of" dates make a lot more sense. The problem is what to do when a single report has several "as of" dates. I propose a narrow narrow view there because we don't know the actual value at that date. Put each "as of" date is a separate row and leave the columns for countries that don't have data for that date blank. Each ref used in multiple rows can get a name="DON 2014-xx-xx". Glrx (talk) 21:26, 19 August 2014 (UTC)
- Works for me. Although style-wise I think I'd rather have an em dash in the blank fields to indicate they've been intentionally left so. -Oosh (talk) 23:32, 19 August 2014 (UTC)
Totals
Generally, the totals are interesting, but they were only included in WHO reports starting 1 July 2014. That means that all the earlier totals are calculations done by us. I propose we keep the totals, but make the totals be the sums across the row. Blank entries would use the first number below. Then we can delete many of the warnings at the bottom of the table. Glrx (talk) 21:26, 19 August 2014 (UTC)
- Sure, it's a tad unintuitive, but I can't think of anything better right now... -Oosh (talk) 23:38, 19 August 2014 (UTC)
- On all of the above....Great work! Thank you. Juan Riley (talk) 23:50, 19 August 2014 (UTC)
- Ok for me, Ill update the graph according to the new totals when youre done. Thanks! --Leopoldo Martin R (talk) 20:21, 20 August 2014 (UTC)
outlandish opening line
How can anyone state this was a leaked bioweapon from the CIA - see second line of this article and use a crazy conspiracy web site as "the proof".
This is outrageous.
How can you state such things with no proof? — Preceding unsigned comment added by 184.14.195.81 (talk) 13:02, 21 August 2014 (UTC)
- Vandalism by an IP-hopping vandal who will be blocked in due course.--ukexpat (talk) 19:23, 21 August 2014 (UTC)
Censorship of Possible US Government Role in Ebola Outbreak!
Numerous times today, I attempted to shed some light on a very underreported yet IMPORTANT aspect of the Ebola tragedy, namely the research done by US Department of Defense agencies on Ebola vaccines and bioweapons applications. It is very unfair for close minded people to CENSOR even mentioning this possibility. It seems unlikely that the US government deliberately started the epidemic, but there are numerous indicators that they opened a Pandoras Box, and a lab accident unleashed this. Here are sources:
http://english.pravda.ru/science/earth/11-08-2014/128247-ebola_biological_weapon-0/
http://themorningconsult.com/2014/08/federal-governments-ebola-story-rife-inconsistencies/
http://www.blackherbals.com/Emerging_Viruses.html
http://www.rense.com/general96/ebostrain.html
http://www.waykiwayki.com/2014/08/ebola-man-made-biological-weapon.html
http://www.astrofreaks.net/2013/01/31/how-ebola-aids-cancer-were-created-in-the-cia-labs/
http://www.globalresearch.ca/the-troubling-truth-behind-the-ebola-outbreak/5377653
http://www.intellihub.com/u-s-government-patent-ebola-virus-2009/
http://www.breitbart.com/Big-Peace/2014/08/05/Ebola-Across-America
http://www.foxnews.com/health/2014/08/05/us-government-military-research-program-helped-identify-experimental-ebola/ — Preceding unsigned comment added by 2601:6:6F00:538:F4D4:F8C7:7239:B7E0 #talk# 20:21, 21 August 2014 #UTC#
- Hi there. The concern with this has been that these sources are not considered reliable, and that the edits appear to constitute original research or original synthesis. Cheers, Dawn Bard #talk# 20:35, 21 August 2014 #UTC#
- Or, to put it bluntly, it's conspiracy theory bullshit.--ukexpat #talk# 20:44, 21 August 2014 #UTC#
- Well, yes. That too, obviously. Cheers, Dawn Bard #talk# 20:47, 21 August 2014 #UTC#
- I'm currently not able to check the what the sources actually say, but wouldn't Fox News count as reliable? I'm just an IP, but would like to know more about our Wiki's policy. Thanks.72.224.172.14 #talk# 21:23, 21 August 2014 #UTC#
- The Fox article might be reliable, but it doesn't support the assertion that a DoD lab accident caused the current outbreak, or that the US was involved in the outbreak inany way. It seems to have been used speciously to support a conspiracy theory. Cheers, Dawn Bard (talk) 21:32, 21 August 2014 (UTC)
- Thank you. Shouldn't we have a 'Conspiracy Theory' section though?72.224.172.14 (talk) 22:02, 21 August 2014 (UTC)
- The Fox article might be reliable, but it doesn't support the assertion that a DoD lab accident caused the current outbreak, or that the US was involved in the outbreak inany way. It seems to have been used speciously to support a conspiracy theory. Cheers, Dawn Bard (talk) 21:32, 21 August 2014 (UTC)
- I'm currently not able to check the what the sources actually say, but wouldn't Fox News count as reliable? I'm just an IP, but would like to know more about our Wiki's policy. Thanks.72.224.172.14 #talk# 21:23, 21 August 2014 #UTC#
- Well, yes. That too, obviously. Cheers, Dawn Bard #talk# 20:47, 21 August 2014 #UTC#
- Or, to put it bluntly, it's conspiracy theory bullshit.--ukexpat #talk# 20:44, 21 August 2014 #UTC#
- C-Class Africa articles
- Mid-importance Africa articles
- C-Class Guinea articles
- Mid-importance Guinea articles
- WikiProject Guinea articles
- C-Class Liberia articles
- Mid-importance Liberia articles
- WikiProject Liberia articles
- C-Class Nigeria articles
- Low-importance Nigeria articles
- WikiProject Nigeria articles
- C-Class Sierra Leone articles
- High-importance Sierra Leone articles
- WikiProject Sierra Leone articles
- WikiProject Africa articles
- C-Class medicine articles
- Low-importance medicine articles
- All WikiProject Medicine pages
- C-Class virus articles
- Mid-importance virus articles
- WikiProject Viruses articles
- Wikipedia In the news articles
- Good article nominees
- Good article nominees on review