
Wikipedia talk:Graphics Lab/Map workshop
The Graphics Lab is a project to improve the graphical content of the Wikimedia projects. Requests for image improvements can be added to the workshop pages: Illustrations, Photographs and Maps. For questions or suggestions one can use the talk pages: Talk:Graphics Lab, Talk:Illustrations, Talk:Photographs and Talk:Maps.
This specific page is the discussion page for the Map workshop. Any comments or questions about this specific workshop may be made here. Note that requests for image improvement, etc. do not belong here but should go on the main requests page
This talk page aims to:
Enjoy it! |
|

Archives
With User:Dycedarg's help I've implemented auto-archiving, let me or him know if there are problems with it. Kmusser (talk) 12:52, 8 April 2009 (UTC)
Quick SVG's
Now I know that this isn't the best way to make svgs but ... you can use the site vectormagic.com to do them automatically! It is a computer that is doing the work so sometimes the results aren't just right, which makes later editing harder but for certain (generally simple) images it works fine. ChrisDHDR 17:15, 25 April 2009 (UTC)
Logged out when trying to make a map request
I clicked on the "make a request" link, and noticed I was logged out. I asked at the Help desk, and they suggested asking here. The person that suggested it tried, and did not have the same problem. I've tried several times, so it isn't a one-off glitch. I can navigate elsewhere without logging out, so I don't think it is a general cookies problem. (If someone notes I successfully filed a map request - I did it by copy and paste, not by clicking the link. Not a big deal, just wanted to see if it is a known problem with a solution. Sphilbrick (talk) 16:13, 4 May 2009 (UTC)
Use of Google Map Embed in Wikipedia
I'm a fairly new user, but I've developed some private wikis elsewhere and was curious if there is any possibility of using Google Map embeds within Wikipedia pages. Specifically, I'm looking at some sections that could be expanded, covering legislative districts. There are certainly some graphical maps that could be used for this, but I was hoping that an embed would be possible to allow for greater detail. Gregwythe (talk) 08:42, 11 May 2009 (UTC)
- I doubt it, Google Maps license is not compatible with Wikipedia. Kmusser (talk) 10:11, 11 May 2009 (UTC)
- Thanks ... I suspected there might be either a copyright or security reason for not seeing the two together. Any advice for what would be an appropriate, allowed way to incorporate a legislative district boundary map? I've been using GIS tools to convert boundary shapefiles onto Google Earth/Maps for my personal use. If I were to create a graphic with that outline on any other map, I just want to make sure I'm using something that passes copyright muster. The maps provided by the state aren't terribly great, aesthetically speaking. Gregwythe (talk) 17:28, 11 May 2009 (UTC)
- Assuming we're talking the U.S. here you should be able to put together a decent map using entirely U.S. government sources which avoids any copyright issues. I use GIS files from the Census and the National Atlas which is USGS. Kmusser (talk) 19:21, 11 May 2009 (UTC)
- Thanks ... I suspected there might be either a copyright or security reason for not seeing the two together. Any advice for what would be an appropriate, allowed way to incorporate a legislative district boundary map? I've been using GIS tools to convert boundary shapefiles onto Google Earth/Maps for my personal use. If I were to create a graphic with that outline on any other map, I just want to make sure I'm using something that passes copyright muster. The maps provided by the state aren't terribly great, aesthetically speaking. Gregwythe (talk) 17:28, 11 May 2009 (UTC)
sources for a map request
Hello, not sure who is watching the page but I have a query. I need a map for the range of the subspecies of the Australian Magpie, and I have taken photos of the relevant pages in the two books which have the source material. I was about to upload and post here when I had doubts about what licence to place on them. Are they for me to label as own work, as I took the photo, or Fair Use? But using he range is altering, isn't it? Shall I upload them here or ask to send to someone? The reason there are two maps is one covers the range in Australia and the other has southern New Guinea. Casliber (talk · contribs) 12:02, 28 May 2009 (UTC)
- That would be Fair Use if anything, but the rationale would be a little sketchy, e-mailing them to whoever takes your map request would probably be better. Kmusser (talk) 12:55, 28 May 2009 (UTC)
ArcMap styles
The convention set is really fine, congrats.
I wonder if some of you using ArcMap have prepared and/or shared style elements in respect to these conventions. phme (talk) 14:21, 4 June 2009 (UTC)
SVG errors
I've created a map with Adobe Illustrator CS2, but I'm having trouble opening/uploading the resulting SVG file when I export. When I upload to Wikimedia Commons, it says the file is corrupted. When I attempt to open it with Firefox, I get an XML parsing error. Any suggestions? JKBrooks85 (talk) 04:57, 24 July 2009 (UTC)
- I've had problems with Illustrator's SVG export as well. Sometimes you can fix it just by running it through Inkscape (open and save as simple SVG), if that doesn't work you usually have to edit the SVG file in a text editor to find the offending code. Kmusser (talk) 12:34, 24 July 2009 (UTC)
- Firefox is usually good at pinpointing SVG errors within the file. Search the source with a text editor or use View → Page Source (Ctrl-U) + Find (Ctrl-F) in Firefox to locate the text mentioned in the error message. (If it occurs multiple times, the line number should narrow it down.) If the quoted text seems correct, it may be worth studying the line or two above it: perhaps a previous tag was not terminated properly. Certes (talk) 14:25, 24 July 2009 (UTC)
- Thanks for the suggestions. I got it to work by running it through Inkscape after creating it in Illustrator. JKBrooks85 (talk) 22:39, 24 July 2009 (UTC)
Map request - Norfolk Broads
I need a map of the Norfolk Broads area creating for use on the List of drainage windmills in Norfolk. I tried using the existing Norfolk map with this result. I can lose #57 from the map as it was a pumping windmill rather than a drainage windmill. Can someone create a map just showing the Norfolk Broads area please?
Projected SVG maps direct from Shapefiles


I've recently created these maps using a command-line tool that I wrote to project multiple shapefiles directly into an SVG file. The bits are barely dry on the program, but you can see that it has a certain level of functionality. I am mentioning it here in case others could find it useful for their projects, and because I would appreciate cogent feedback. It is written in Perl, and I've developed and used it on Linux. It should be able to run on Windows if the Perl module Geo::Proj4 can be installed there.
The project is available for download along with some basic documentation and an example of its use (to produce the first map shown here). It's probably not for those who shy away from the command line -- it's syntax is a doozy. Among the list of possible enhancements I'm considering are either a separate config file to specify the rendering information for a map, or a GUI, or both.
In the interest of full disclosure, some post-processing in Inkscape was required for these, as is documented in the project. Most notably, all text is added manually. --Kbh3rdtalk 04:18, 8 August 2009 (UTC)
- Very interesting ! I'm interesting to know clearly : for these maps, what made your soft ? what made you yourself in Inkscape ?
- May you create a tutorial such as :
- Introduction/description ;
- what system/packages are need ;
- how to install + download link ;
- how to use (list of functions) ;
- gallery of examples.
- I encourage you to put this there: Wikipedia:Graphic_Lab/Resources/Software/Kbh SVG script. Keep me aware of your progression ;) Yug (talk) 13:08, 4 November 2009 (UTC)
- Note1: I don't understand clearly what make this script, and if it apply to world wide or USA only.
- Note2: Your script may maybe help the large German map project there de:Wikipedia:Kartenwerkstatt/Positionskarten/Europa.
- Please keep me informed. ;) Yug (talk) 13:08, 4 November 2009 (UTC)
- I think that this perl script is fairly well documented on its github wiki pages, though of course improvements are possible. There is full parameter coverage, an example script, and a gallery of maps with a brief discussion of how each was made, albeit without the full command line. I think I chose the BSD license for it, so you can do whatever you want with it, and of course it adds no encumbrance to what you produce with it.
- Apart from some external Perl packages (and that libproj library) that it depends on, there is no installation required for this program itself. I have intentionally architected it as a monolithic script that includes no modules of its own that need installing -- just run it from wherever you downloaded it to. Dependencies are listed there, but the list might not be 100% complete -- many perl packages came pre-installed with the Linux distribution that I use, and cpan installs other dependencies with little effort, so I probably missed some third-party packages required by the modules that I directly import.
- Having used it a bit more myself, I have in mind a longer to-do list than what is shown, to make it more useful in more situations. I'd like to add data filtering by numerical comparison, e.g., which cannot currently be done with the regular expression matching that it has. I'd also like to color object based on numeric ranges. Getting the bounding box right should be made a higher priority, too, though it can be corrected afterwards with Inkscape. I really should get around to removing the SVG package to avoid its errors, minimize external dependencies, and streamline operation.
- If this tool is not polished enough for your use, or if you require a point-and-click GUI, you might want to investigate Quantum GIS. It is supposed to have the capability to "print" directly to an SVG file. My inability to make that work with the current version was part of the impetus behind this project.
Move to commons tag for other-language Wikipedias?
Sorry, I know this is probably not the right place to put this, but is there an international {{Move to commons}} tag for other-language Wikipedias? I've found some images on other Wikis that are free-use, but don't know how to tag them properly. --Chris (クリス • フィッチュ) (talk) 17:35, 20 February 2010 (UTC)
Can someone help me out on this? Or at least explain the map in its current form. Thanks 81.68.255.36 (talk) 10:30, 14 March 2010 (UTC)
Colourised data maps
I don't know if there is a tool exits already for this (probably there is - for JPEGs there is anyway) but I've cobbled together a website to generate SVG maps to show colourised data e.g. the typical GDP per capita maps, etc.. The site takes CSV data info form of ISO country code [comma] value and currently can generate a world or Europe map.
Based on feedback from here, I will (or not) add other maps and features. Link to site. Some sample data is provided. --RA (talk) 00:48, 18 March 2010 (UTC)
- (I have revised county to country.)
- What tools exists already for JPEGs? installed on the internet like this one?
- Are there freely available tools to combine user-provided country-level data, a single numeric variable keyed by the ISO country code, with political outline data (shapefile?) provided by some geographic organization? And to select a region such as the European countries from the world political map? Or have you written those parts yourself? --P64 (talk) 13:45, 12 July 2010 (UTC)
- This is amazing. Over at commons there are all kinds of requests all the time for maps showing diplomatic relationships etc - they take a graphist 10m to do, but it's time that could be spent on other things. You tool can give the non-graphists exactly what they need. Thumbs up! Jon C (talk) 22:59, 28 December 2010 (UTC)
- JC, thanks. --RA (talk) 18:09, 13 February 2011 (UTC)
Afghanistan map help needed
Please see:
- commons:Commons talk:Map resources#I need some advice --Timeshifter (talk) 09:25, 20 March 2010 (UTC)
- The set of maps J.Wales is talking about seems really high level. I answered on the page, and messaged to him. Hope he will forward the message. Yug (talk) 17:44, 14 April 2010 (UTC)
Maps, Maps, Maps ! Call for mapmakers !
Later correction: we later decided to rather focus on SVG map making tutorial. See this section. And to make some contributors calls. Yug (talk) 11:06, 1 February 2012 (UTC)
Is there some map makers ?? I was astonished to see that 90% of maps requests don't get neither comments, neither satisfied. We really need some users to come on the Wikipedia:Graphic Lab/Map workshop. People interested, please come ! Map making is a specific skill, almost easy to do, while maps, or relate technical diagrams are wonderful tools to explain and illustrate articles and knowledges. Inkscape (Download!) is a nice free software to create SVG maps. So come, come, come, choice one, and give a try ! We need MAPMAKERS there !!! :] --Yug (talk) 04:28, 13 April 2010 (UTC)
- Might be better to post this at teh village pump then to generate interest. Casliber (talk · contribs) 00:35, 27 April 2010 (UTC)
 Done ! Village pump 2011/06/10 Yug (talk) 18:26, 9 June 2011 (UTC)
- It might help if the map tutorials were complete and/or in English. For a long time I was stuck at a halfway point on a number of maps until I played around and got the results I wanted. Matthewedwards : Chat 23:53, 30 May 2010 (UTC)
- Done for topo maps! See Wikipedia:Graphic Lab/Resources/QGis lesson 1: Create a topographic background Yug (talk) 18:28, 9 June 2011 (UTC)
Curious about auto-generation of previews in wikipedia for large commons image
I uploaded a fairly large (53Mb) image to commons, Greater_Jerusalem_May_2006_CIA_remote-sensing_map_.jpg. Actually the orginal jp2 format image is much smaller than that but I converted it to jpg assuming that was a current requirement. The auto-generated preview (463 × 599 pixels) works fine in commons but not in wikipedia. The software in wikipedia seems to be trying to generate a 7,726 × 10,000 pixel preview. Seems odd. Should I do something about it and if so, what ? I'm not sure that it matters since the link to the commons file is there but I thought I should ask. I wasn't planning to reduce the resolution of the commons file since the full resolution is required and complies with policy. Sean.hoyland - talk 08:57, 26 April 2010 (UTC)
- Looks fine to me, I'm seeing it's default preview size as 791 × 1,024. Kmusser (talk) 10:03, 26 April 2010 (UTC)
- In wikipedia ? The plot thickens. I'm still seeing 'Size of this preview: 7,726 × 10,000 pixels' and no preview. Maybe there's a setting somewhere... ? Or perhaps it's client dependent. I use Internet Explorer. Oddly the image is fine when used in wiki articles. Sean.hoyland - talk 10:15, 26 April 2010 (UTC)
- ah got it. there a preview limit setting under my prefs. That fixed it. Thanks. Sean.hoyland - talk 10:18, 26 April 2010 (UTC)
might want to make this more prominent
Wikipedia:Graphic Lab/Resources/Tutorials
Shapefile manipulation
Using shapefiles and R statistical software, I know how to do some statistical analysis and generate some maps of area data (eg "Colourised data maps" above). What tools are available for these more basic tasks?
- selecting a shapefile subset, such as sub-Saharan Africa from Africa or from the World? or New England counties from a county map of the United States? At wikipedia we have zillions of maps of the United States, and of individual states, but few or no regional maps.
- extending a shapefile to incorporate user-provided fields of numeric data, such as every country's number of participations in the World Cup tournament? --P64 (talk) 14:02, 12 July 2010 (UTC)
- I have learned more about R's own capabilities (not yet the hoped for answers). After reading some articles on geographic software and data, and some project pages on maps and graphs, some of my searches are more effective. Even writing my preceding note has been some help (eg, shapefile subset, there's a concept). --P64 (talk) 21:59, 13 July 2010 (UTC)
Category:Map images that should use vector graphics
I'm interested in creating new .svg files from raster maps. But i have some doubts, mostly because i don't know what to do after the file has been created.
- I have to copy all the features (colours, font size ec.), or may i use the ones suggested by Wikipedia:WikiProject Maps/Conventions?
- How to load file in Commons? Do i have to use a new name for file, or just upload in the parent one?
- How to categorize the "new" file? Do i have to place in same category of the parent file, or do i put it in the "generic" category SVG maps?
- What to do with the parent file? Has it to be purposed for deletion or not? Thanks a lotCiaurlec (talk) 21:17, 29 October 2010 (UTC)
- I’m pretty new at this but here’s my 2¢ worth:
- I think for any current informational map it would be best to use the standard formats as much as possible. Illustrated maps and historical ‘replicas’ might be exceptions. (Thanks for pointing out that template BTW—I hadn’t come across it yet!)
- If you choose the “derivative work” link from the Upload page, you’re passed to a helper script that copies the description & licence info from the original file into your new one. It also lets you choose from a list of categories it’s guessed, based on the original description, and checks for filename conflicts. Unless the original name is excessively long or short, uninformative, misleading, or in another language perhaps, you might as well keep it the same: note that foo.svg is considered different from foo.jpg and foo.png.
- Outside my experience, apart from the above. But if the upload helper doesn’t come up with any good ones, you might look at how the original was categorized.
- I just tag it with Template:Vector version available; this template includes a note implying that keeping the original is sometimes necessary for licensing reasons. I presume there are bots that delete redundant images once they’ve been orphaned, but I don’t know much about the deletion process(es).
- —Odysseus1479 (talk) 01:04, 30 October 2010 (UTC)
Request withdrawal
I'd like to withdraw my request for a route of the Wallkill Valley Rail Trail. I've just discovered OpenStreetMap, which can create such maps under a free license.
--Gyrobo (talk) 15:32, 12 January 2011 (UTC)
Countries within EU (rendering error)
The .svg maps of countries within the EU, such as [[File:EU-United Kingdom.svg|600px], are not displaying properly. Can someone here help sort it out? Ghmyrtle (talk) 09:34, 15 February 2011 (UTC)
I'm having the same problem when viewing File:EU-Hungary.svg via the English Wikipedia. Curiously enough this problem seems to be limited to EN Wiki only, as the same files are rendered correctly when viewed in Commons and other language Wikipedias as well. There seems to be some problem in the coding that retrieves the files and their respective info from the Commons, because the PNG "previews"/thumbnails of the files are replaced with a placeholder icon and the image dimensions are given as 0 x 0, while their size is given correctly (2.61 MB for EU-Hungary.svg). This seems to point to a permission problem within the EN Wikipedia itself (with the script having either insufficient permissions or lack of membership in the appropriate group). Could any of the admins (not the sysops, but guys who have the capabilities and privileges to actually "look under the hood") take a look at this? CoolKoon (talk) 17:59, 15 February 2011 (UTC)
I've done some research as far as the EU maps are concerned and found out that it's the EU maps of the following countries that don't work: Belgium, Bulgaria, Cyprus, Finland, Germany, Hungary, Italy, Lithuania, Luxembourg, Malta, Netherlands, Poland, Slovakia, Slovenia, Spain, Sweden, United Kingdom. All of the files use the naming convention EU-Country_Name.svg (e.g. File:EU-United_Kingdom.svg, File:EU-Slovenia.svg etc.), none of these are displayed correctly (at least the PNG files derived from them), all of them use a placeholder icon instead and basically have the same issues as the File:EU-Hungary.svg mentioned above. CoolKoon (talk) 19:12, 15 February 2011 (UTC)
- Has someone changed the underlying coding or something? Sounds strange that it has just decided to develop this error. Jamesinderbyshire (talk) 14:54, 16 February 2011 (UTC)
Same problem with File:Europe-Georgia.svg Chipmunkdavis (talk) 06:49, 17 February 2011 (UTC)
- I saw someone say that changing a thumb600px to 599px (or 601px) got around a problem they had with thumbs not refreshing. I don't know if that helps EdwardLane (talk) 09:52, 16 July 2011 (UTC)
Quality push: GIS mapmaking ! Call for mapmakers !
Hello ! I'm looking for partners to push toward GIS mapmaking, GRASS GIS, QGis ! Who have some basis in this ? which software ? Please let me know below ! Yug (talk) 16:31, 9 June 2011 (UTC)
Quality push: QGIS lesson 1: Create a topographic background
Later correction: we later decided to rather focus on SVG map making tutorial. See this section. And to make some contributors calls. Yug (talk) 11:06, 1 February 2012 (UTC)
|
Dear Map makers ! |
|
|


- If you are nearby London, there will also be some 'free*' GIS/QGis courses. (* = £15 for food/facilities)
- http://www.faunalia.co.uk/en/courses
- 12th July 2011 - Beginning Computer Mapping (Dauntsey, Wilts, UK)
- 19th September 2011 - Quantum GIS (Reading, Berks, UK)
- 20th September 2011 - Advanced Quantum GIS (Reading, Berks, UK)
- Would be nice if some of us go there, for learning and networking. Yug (talk) 16:27, 9 June 2011 (UTC)
- I'd be willing to copy-edit the tutorial. Speaking of copy-editing, you may want to be a little more inclusive in your message ("a tester and his feedbacks, installing the QGis on his computer" [emphasis mine]); although Wikipedia sadly skews quite heavily toward male editors, there is the occasional female ones around too. ;) -MissMJ (talk) 01:45, 10 June 2011 (UTC)
We continue to push ! Lesson 1, lesson 2, and the major GIS sources are available :
We are exploring and finding ways within QGis. If you want to join and explore, let's go. Download QGis, follow the toturials, find new ways to do things, and share what you find ! Lesson 1, lesson 2, /QGis mapcolor files & GIS sources, a Todo list are available, and lesson 3 have an outline to complete. Fresh explorers/sharers welcome ! Yug (talk) 08:46, 16 June 2011 (UTC)
Inkscape to Illustrator : SVG ? any experience or comment ?
Inkscape⇔Adobe Illustrator[1] : Inkscape's native format is SVG, ant it's also a format supported by AI, but the two implementations are not 100% compatible. Inkscape can also export into PS, EPS and PDF, that Illustrator recognize.[clarification needed] It is also advice to stay working on illustrator if you start do do so, since illustrator openning a SVG translate some of the SVG code, and will then just focus and work on this, while Inkscape will keep working on the standard SVG code.
|
Hello, a friend complained he can't use my SVG in illustrator. Did someone had troubles to open complex file to export from Inkscape into Adobe Illustrator ? Should I export to him with SVG, PS, PDF, EPS ? Did you made some tests ? some failures ? what are your experience and Is there a section about this on the graphic lab ? and in the whole, is Adobe Illustrator code fine wiki wikipedia and its collaborative approach ? Yug (talk) 06:01, 17 June 2011 (UTC)
- After 3 hours of testing, it appears that the bug was not Inkscape's SVG code, it's Illustrator itself, which crash when the SVG (one path) is too heavy. Some other experiences ? Yug (talk) 14:08, 17 June 2011 (UTC)
Animated China Map - Urgently Needs Replacing
See: Wikipedia:Graphic_Lab/Map_workshop/China/Github Yug (talk) 14:31, 25 January 2012 (UTC)
South Sudan
So now that South Sudan has become a country, there are about a gazillion maps that need to be changed reflecting its borders. I'm wondering if it would be beneficial to create a different section of the workshop, or a separate category, or something, anything, where all the maps that need editing could be added to avoid swamping the main workshop page with a metric ton of requests relating to South Sudan. Or maybe just one monster request tacked at the top of the page where people can add a list (not thumbnails) of files that need to be modified? -MissMJ (talk) 20:24, 12 July 2011 (UTC)
- I am sure the vast majority need to be changed, but would counsel that some maps may be used in history-based articles and should not have the borders changed. Also, the impression I have is that S Sudan will be widely recognized, but we should just wait and see that has happened. When I looked a day ago, there were only a couple countries that had done so and not UN yet. We should make sure our political boundaries follow general consensus.TCO (reviews needed) 20:48, 12 July 2011 (UTC)e
- MissMJ, QGis may help greatly in this project of serial creation of locator maps. Naturalearthdata have a file about 'disputed territories', maybe south sudan is there. Yug (talk) 23:26, 12 July 2011 (UTC)(I'm going to bed)
- Would it be possible to tag the images with "Categories: South Sudan map update project". Then the tag can be removed once the image has been updated. This would create a thorough list as people tag maps that are likely to be in need of an update. Delusion23 (talk) 12:22, 13 July 2011 (UTC)
- Okay I've created commons:Category:Maps_needing_South_Sudan_political_boundaries. Any images that need South Sudan added that are on Commons should be tagged with [[Category:Maps needing South Sudan political boundaries]]. Anyone wishing to work on a map can then go there. There's already some good bases in commons:Category:Maps of South Sudan. Add a {{Warning|When updating this map with the borders of South Sudan, please upload a separate version.}} to any maps that shouldn't be overwritten. -MissMJ (talk) 21:07, 13 July 2011 (UTC)
- MissMJ, QGis may help greatly in this project of serial creation of locator maps. Naturalearthdata have a file about 'disputed territories', maybe south sudan is there. Yug (talk) 23:26, 12 July 2011 (UTC)(I'm going to bed)
Manager need ! People need !
- Done: to do list updated. New SVG exercices for mapmaking (to open in Inkscape) published + stated the need for new editors. Non-free softs tutorial + QGIS unclear/unfinished tutorial issue : stale.
Extended content
|
|---|
|
Hello, we clearly need more management on this English workshop. Challenging map requests are there, but we manage just 20% of them O.O ! We need more map makers, we need to push toward better maps (GIS - shapefile / QGIS), we need more reactive talks (have fun !), and to summarize them better, we need people, and to call for them. I will continue to push as I can toward these inspiring directions, but we need more overview than just me : a French mapmaker. The English workshop need leadership and initiative ! There is a lot to learn, Let's explore, let's Have fun !Yug (talk) 14:36, 25 January 2012 (UTC)
|
Marcus, I also started a clean up for the QGIS tutorial. It's not the priority, but the lesson 1 need a full rewriting, that's true. Yug (talk) 21:52, 1 February 2012 (UTC)
SVG tutorial finished !
- SVG exercices for mapmaking (v. 12/01/30: to open in Inkscape). Try it : )
According to previous feedbacks, I pushed toward the publication of this much need basic SVG mapmaking tutorial (rather than the too-high-level GIS tutorials). Review/copyedit welcome ! If feedbacks are positive, we can increase sharply its visibility. I also updated our "road map/priority list" : /to do, so we have a guideline to how to improve the project. Graphism is a slow, precise work. We mainly need more people, and more people digging in SVG mapmaking. So if you are interested ! Yug (talk) 11:26, 30 January 2012 (UTC)
QGIS Raster Calculator
Can anyone give me an example of how to stitch SRTM3 tiles using the raster calculator in QGIS, please? Cheers, Ma®©usBritish[chat] 10:03, 14 February 2012 (UTC)
- Hello Marcus, nice to see you are exploring GIS map making. We still have a long way to go. Your question is out of my current knowledge, but I can redirect you toward the QGIS forum :
| If you encounter any issues, you can browse and ask questions at the QGis Forum > Help using QGIS (very active, will generally answer in ~6 hours). |
- You have to create an account in 5 mins. Then go, say you are from wikipedia, and put your question very clearly (they are busy professionals) :) . For me, 2 questions failed so I did without, but I solved more than half dozen big troubles by asking them. That's a place to know. Best wishes~~ --Yug (talk) 17:38, 15 February 2012 (UTC)
- If you have too many tiles, then just prefert this source :
 NASA / USGS: SRTM3 (2000, Public domain). Specifics: topography layer(s), 1px= 93m (3"arch), 60⁰N-56⁰S (landmass only), datum WGS 84. Files: on command, 1 tiles.
- --Yug (talk) 17:56, 15 February 2012 (UTC)
- Merci beaucoup! Ma®©usBritish[chat] 10:47, 16 February 2012 (UTC)
- QGIS is tiresome, is it not? I went to great lengths to Merge many SRTM3 tiles into 5x5 size tiles, to ease raster loading, only to find that the Shaded Relief plugin cannon handle the new size file (most ~50–100Mb) and gives a Python MemoryError. I hope the next version of QGIS deals with memory handling, or supports x64-bit better.. I have 4Gb RAM, it should have been sufficient, so this is a disappointing setback. Ma®©usBritish[chat] 13:14, 18 February 2012 (UTC)
- 1. Hello Marcus, first and for convenience, did you used the new NASA website for GIS, so you just have one big tile ? nb: I update the tutorial accordingly. Thanks for your feedback : )
- 2. What is your OS ? Linux, Windows, Mac ? I use Ubuntu. I will ask around, I think some other GIS mapmakers use Windows.
- 3. For shaded relief I met the same memory issue but I then believed it was my computer. Anyway, I see two ways to bypass it :
- as I did, by using Galdem (see tutorial section for installation and use). I got better result with Galdem: about 5-10 times faster. (!) And never bugging. I use Ubuntu, Galdem should be available on other OS, tell me your OS, I will ask for help.
- getting smaller GIS source. If the plugin crash, I guess it's because your .tiff is too big, too precise, for a too large area. If you use SRTM3, then move to a lower quality datum : ETOP01. I never tried, but that should reduce the tiff file by 10, so the plugin *may* handle it successfully.
- 4. Do you use SimpleSVG (plugin), will be need soon I guess. Or are you creating a png map ?
- 5. Yes, QGIS is tiresome, GIS mapmaking is tiresome to learn. Just a small dozen of wikipedian do it. I personnally learned from Sting, NNW, Sémhur, Bourrichon how they create great maps : slowly, carefully. You are progressing : keep asking questions when you need, I will answer to as much as I can. You can also upload a svg/png of your current work so I/we can follow your situation.
- Best wishes ! Yug (talk) 14:38, 18 February 2012 (UTC)
- Thanks, I'm using Windows 7 on my PC and laptop, I don't use any other OS. The NASA site works for me, but I often get errors such as "The Device is Full" (what device?). Is ASTER GDEM V2 the same quality detail as SRTM3? But I don't see how downloading the data as 1 large tile, which can be upto 20 tiles in area helps, as it also causes a MemoryError when creating Shading Relief. I have no problem with the tiles per se (SRTM3s atop a ETOPO1 basemap to hide the voids), I've passed learning that stage.
- I'm now at the Shading Relief part, I'm upto trying en masse: I'm using Azimuth 320°, Elevation 60° with 0.000009 exaggeration, which works fine for individual SRTM3 tiles, although I have to convert them from TIFF to PNG in Photoshop, in order to completely remove the white alpha transparency which adds a faint but irritating tint. Not sure if there's any other way than this? It's a shame QGIS can't handle larger areas without memory issues. And the properties should be easier to apply to multiple tiles, without repeating long-winded processes. Some kind of "Select All" and "Apply to Selected" would be great addition to the software. QGIS needs an Adobe CS-style application to shake it up.. if QGIS was as friendly to use as Photoshop CS it'd be amazing. I wonder when QGIS 2.0 is due. Cheers, Ma®©usBritish[chat] 16:26, 18 February 2012 (UTC)
- (please put numbers and line jump between your issues, that ease reading / answering)
- Aster and SRTM3 have about the same quality : 1px = 31m. See our page "/GIS sources..." But GTOPO/ETOPO are far lighter, since 1px = 930m.
- Ok, you know merging, good. : ) If you work fine with SRTM3's tiles, continue.
- Yes, I did the same : I had to convert to PNG for the GIMP/Photoshop clean up, you do it right : )
- I agree for the need of grouping. I ignore if there is a way to group them without merging them.
- QGIS is already a major improvement for the free GIS softs, but It also still have a long way to go on the accessibility/functionality side. I'm actively involve in the SimpleSVG plugin development, which may one day be include in QGIS, thus adding a lot of convenience for SVG mapping. : ) From what I see, you manage well, you took the initiative to bypass some issues which is always the way to do : "find a way". Good. PS: if you learn some tips, consider sharing. Yug (talk) 17:13, 18 February 2012 (UTC)
- Thanks. I'm aware that SRTM1 provides very high detail DEMs but only for the USA. I was wondering if there have ever been any high detail tiles produced for the UK/Europe, beyond SRTM3? I notice that even with shaded relief applied, a lot of the hill ranges in certain UK regions lack detail.. e.g. Cumbria, which means small area maps are not easy to produce without appearing somewhat inaccurate. Cheers, Ma®©usBritish[chat] 07:32, 20 February 2012 (UTC)
- The ASTER DEM provides a global 30m resolution (the same as SRTM1). However, it is not in the public domain, see the terms and conditions. OSM isn't sure if it can use it, and the reviews of ASTER linked there indicate its actually not any better than SRTM3(!)
- For the UK, OS OpenData provides a DTM. File:Central Cairngorms UK relief map.png shows its limit, which is about double the resolution of SRTM3. Tile merging will be a nuisance though.--Nilfanion (talk) 12:17, 21 February 2012 (UTC)
- Thanks for the info! Ma®©usBritish[chat] 13:18, 21 February 2012 (UTC)
- @Nilfanion, you do GIS mapmaking.... @____@ (I almost killed myself to open this GIS/QGIS way for the English wikigraphists)
- @Marcus, tell me when you upload on commons. Even a draft. Cheer ! Yug (talk) 21:32, 25 February 2012 (UTC)
- No - I clearly have nothing to do with GIS. I'll have a look over the tutorials sometime and see if any work is needed ;)--Nilfanion (talk) 11:54, 26 February 2012 (UTC)
- Thanks for the info! Ma®©usBritish[chat] 13:18, 21 February 2012 (UTC)
- Thanks. I'm aware that SRTM1 provides very high detail DEMs but only for the USA. I was wondering if there have ever been any high detail tiles produced for the UK/Europe, beyond SRTM3? I notice that even with shaded relief applied, a lot of the hill ranges in certain UK regions lack detail.. e.g. Cumbria, which means small area maps are not easy to produce without appearing somewhat inaccurate. Cheers, Ma®©usBritish[chat] 07:32, 20 February 2012 (UTC)
- Okay, will do.. have been busy with other things lately, and am a bit side-tracked from Wikipedia and QGIS, but will get back into the swing of things. On a side note, I'm confused by the SimpleSVG plugin hype. I saved two test files, one via SimpleSVG, one via regular "Save As Image". They both saved an identical quality 553Kb PNG image based on what was in the main frame (i.e a screenshot), and SimpleSVG also produced an additional .svg file which appears to be little more than an XML wrapper that embeds the raster. I had expected, from the plugin name, for it to output some form of pure (bit simple) vector code of the map; sort of a Raster > Vector converter. Maybe I'm missing the point of this plugin, as I don't have Inkscape (I have Illustrator), but when I loaded the .svg file in my browser it just shows a red outline, the raster doesn't show. I use the "Print screen" method to get a custom sized raster output, though I would prefer SVG. Should I be outputting maps as a raster and using dedicated software like Illustrator to redraw it as a vector? Cheers, Ma®©usBritish[chat] 23:49, 25 February 2012 (UTC)
Example of nice raster topographic background for wikipedia use : fine : ) - SimpleSVG: If you use both shape files and raster files in QGIS —which I assumed—, SimpleSVG is helpful. If you just use raster layer, then there is no special advantage over the print composer (which even provide more control for the output).
- Until now, SimpleSVG point is to cleanly convert ShapeFile to clean SVG files, outputting a clean, well structured SVG to edit in Inkscape.
- SimpleSVG haven't raster2SVG converter... yet. That may come soon (some few months?) I'm in contact with the programmer for that. That would be wonderful.
- Second point. Currently, to convert from raster to SVG, it's an handcraft job. Based on a same main frame, we create a serie of black/white raster output with different altitude level :
- white < 0m < black
- white < 100m < black
- white < 200m < black
- Then vectorize in Illustrator/Inkscape each black shape, thus creating the different topographic layers to color accordingly. It's in my opinion more fun and interesting than useful (for wikipedia usage). Full vectorization become a 'must have' if your usage is real-world professional publishing or conference's projection. Let's me add this to my to do list for the QGIS tutorials. ; ) Yug (talk) 09:42, 26 February 2012 (UTC)
- Ah, I see. No I didn't test the plugin with anything but rasters; I have some shapefiles but they were not used. Seems like a fairly long process to go through each altitude, export it, vectorise it, colour it, make it a layer until all the levels form a purely vectorised basemap on which to apply geological features, locations, etc. I'm sure the end result can be brilliant, but it's a shame there is no automated process to do this far faster. I have yet to understand how the Raster Calculator works apart from a couple of very basic tasks. GIS is somewhat specialised work, and as is often the case with such software the pros don't like to publish too many tutorials/guides for amateurs to learn the job and risk taking away their work, as I expect they can charge quite a high price for well produced maps/terrain images, etc. Any guides, tutorials or information you publish is appreciated however. Cheers, Ma®©usBritish[chat] 10:00, 26 February 2012 (UTC)
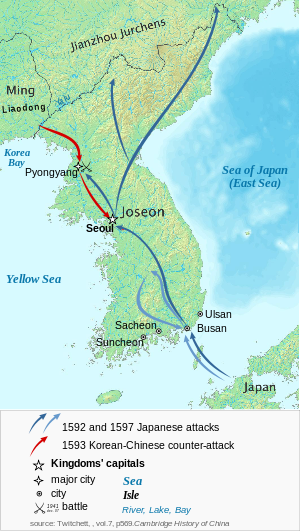
- Incidentally, the map of Korea is not a full vectorisation; as it still contains a raster element (the relief shading). It would be good if the tutorials provided a mechanism for vectorising that too - I'd imagine a similar process to that above but even more tedious (unless automated somehow).--Nilfanion (talk) 11:54, 26 February 2012 (UTC)
- There is a plugin, SimpleSVG, which may include this function soon. We need to push the programmers into this direction. Yug (talk) 15:18, 26 February 2012 (UTC)
- I agree with that, I find it irritating that we have to have one raster layer in an otherwise pure vector image.--Nilfanion (talk) 17:17, 26 February 2012 (UTC)
- @Marcus, as always, you can explore around if there is an other solution or a new plug in. What I got 6 months ago was a 'Line creator', a function creating a line for all point with an altitude of 200m. This was actually not helpful, especially since most of these lines were open. Yug (talk) 18:48, 26 February 2012 (UTC)
- The main benefit of Open Source is, of course, that it is free and often involves a lot of developers directing the software to suit many applications based on demand for greater functionality. The downside is that it only goes as fast as those developers can be bothered to work.. being unpaid means they don't necessarily reel out new updates weekly/monthly/quarterly, and the lack of commercial income, i.e. funding, means they don't always have the same interest in providing dedicated support, because the loss of a user isn't a lost paying customer. So it can be hard to press programmers into volunteering their efforts to making plugins, etc when other members of the team are not pulling their weight to develop the core, other plugins, etc at the same pace. I notice QGIS has a roughly "once a year" major release pattern, which is about the same as Adobe CS products, but imo quite slow when you consider how quickly hardware, OSs, and other technology moves. QGIS seems good at first, but feels very slow and lacking in many areas which I'm sure could be improved a great deal. I just noticed, whilst writing this, that version 1.7.4 was released a week ago.. so I need to update. Ma®©usBritish[chat] 19:22, 26 February 2012 (UTC)
- @Marcus, as always, you can explore around if there is an other solution or a new plug in. What I got 6 months ago was a 'Line creator', a function creating a line for all point with an altitude of 200m. This was actually not helpful, especially since most of these lines were open. Yug (talk) 18:48, 26 February 2012 (UTC)
- I agree with that, I find it irritating that we have to have one raster layer in an otherwise pure vector image.--Nilfanion (talk) 17:17, 26 February 2012 (UTC)
- There is a plugin, SimpleSVG, which may include this function soon. We need to push the programmers into this direction. Yug (talk) 15:18, 26 February 2012 (UTC)
- Incidentally, the map of Korea is not a full vectorisation; as it still contains a raster element (the relief shading). It would be good if the tutorials provided a mechanism for vectorising that too - I'd imagine a similar process to that above but even more tedious (unless automated somehow).--Nilfanion (talk) 11:54, 26 February 2012 (UTC)
- Ah, I see. No I didn't test the plugin with anything but rasters; I have some shapefiles but they were not used. Seems like a fairly long process to go through each altitude, export it, vectorise it, colour it, make it a layer until all the levels form a purely vectorised basemap on which to apply geological features, locations, etc. I'm sure the end result can be brilliant, but it's a shame there is no automated process to do this far faster. I have yet to understand how the Raster Calculator works apart from a couple of very basic tasks. GIS is somewhat specialised work, and as is often the case with such software the pros don't like to publish too many tutorials/guides for amateurs to learn the job and risk taking away their work, as I expect they can charge quite a high price for well produced maps/terrain images, etc. Any guides, tutorials or information you publish is appreciated however. Cheers, Ma®©usBritish[chat] 10:00, 26 February 2012 (UTC)

.svg)
Shaded relief plugin to test
I just remember this : http://www.sourcepole.com/2012/1/16/shaded-relief-maps-with-qgis :
- > QGIS 1.7.4+ > Plugin > Plugin manager > enable 'Raster terrain analysis plugin’
- >> QGIS > Raster->Terrain Analysis->Relief
- >>> Follow the tutorials n⁰1 and n⁰2
- "Also you need to have a very recent build of the QGIS master branch."
- Never tested here (1.7.3), feedbacks welcome ! Yug (talk) 22:22, 26 February 2012 (UTC)
- If you test this way, please add your feedback to its tutorial section, here. Yug (talk) 10:30, 27 February 2012 (UTC) (I'm unable to upgrade to 1.7.4 and to test it myself)
"Lord of the Rings"-like maps
That's also a long work, as for every beautiful work, but if someone is interested to create a "Lord of the Rings"-like map, there are some tutorials :
Have fun : ) Yug (talk) 17:51, 17 February 2012 (UTC)
- Map analysis (layers) & Reflexion:
- Background:
- Water seawave : drawing one seawave, then use Cloning ? Pattern ?
- MapBackgroud: Rectagle minus Planisphere. Pattern ?
- Old paper pattern.
- Landmass :
- Landmass shape: from natural fractal object photograph + black/white contrast.
- Landmass border: 2px, black. +Below: blur black duplicata
- Surrounding waves effects: expand Landmass, empty fill, border 1px, black
- Topographic and climate:
- Guess the Tectonic moves → mountains → hydrographic → rivers ; +world winds & rain shadow → deserts ; sea streams → sailors and fishes.
- Mountains (5 kinds) : Volcanic, Fault-block, Complex/folded, Erosional, Upward → drawing one of each, then use Cloning
- Rivers: ?
- Icons
- Borders (2 kinds) :
- inter-kingdoms → draw all the borders, group (Ctrl+G), make 2 more duplicata (Ctrl+D). Bottom: large 4px, blur, black, line. Middle: 2px, blur, white, line. Top: 1px, no blur, black/brown, doted.
- smaller border → Top: 0.5px, no blur, black/brown, doted.
- Cities: small circle.
- Borders (2 kinds) :
- Labels
- Font ?
- Legend
- Wind rose: to create, brown.
Interesting !! Yug (talk) 18:20, 17 February 2012 (UTC)
- I get a 403 error on the example. Wait.. it works if you go through the directory. --Golbez (talk) 21:50, 17 February 2012 (UTC)
- Should be fixed. In the dir look at the largest one for more details. The PDF is really interesting, especially the images where we see step by step differences. so nice : ) Yug (talk) 21:54, 17 February 2012 (UTC)
- I spent the last two days browsing deviantart.com's Cartography guild, there are a lot of ways to have more creativity and fun with maps. Yug (talk) 12:15, 18 February 2012 (UTC)
- Should be fixed. In the dir look at the largest one for more details. The PDF is really interesting, especially the images where we see step by step differences. so nice : ) Yug (talk) 21:54, 17 February 2012 (UTC)
Template {{Cite GIS}} voted for deletion. Help welcome !
There is a discussion to delete our project template {Cite GIS}. This template is useful for us, supporting our GIS mapmaking push by organizing systematically our GIS/satelite/NASA sources on the Wikipedia:Graphic Lab/Resources/Gis sources and palettes page. These sources make mapmaking a reliable science, with realistic topographic background, and systematically well geo-localized items (see GIS). From what I know, no other {Cite} template can do the job we, mapmakers, request here: introduce systematically these GIS sources and the usefulness for wikimapmakers. 8 fields which are not in {Cite map}. Namely: covered area, datum, projection, size_compressed, size uncompressed (world GIS are about 20 to 100Go files), tile size, tiles total, comments (for mapmakers), editor notes (for the dataset known bugs, limits). These fields are specific to raw materials, to databases files which can reach 100 Go, not to end products that are maps (a 2D drawing file). Currently, the fate of this template is voted by NON-cartographer. Also, your input will be welcome ! Yug (talk) 20:43, 3 March 2012 (UTC)
- PS: they suggest merging with {{cite map}}, which may be considered, but not workable right now. Also, deletion is NOT acceptable. Yug (talk) 20:45, 3 March 2012 (UTC)
SVG and GIS tutorials push : news
Cheers, the tutorial for basic SVG mapmaking is ready : File:Tutorial-cartography_(basic).svg , that allow people with basic or no SVG skills to do nice SVG maps, and the first feedbacks are enthousiastic : ) It would be nice to tell people interested by cartography read it. What else on GIS push side ? Marcus launched an interesting talk and we thus made some progress. We are now about 5 graphists (--slowly--) who recently dogged into GIS mapmaking, that's good. I also saw GIS maps made by non-Graphic Lab users, so I started to invite them here and encourage them to give us their input. We need their advices ! If you meet some great mapmaker, drop them an invitation to join us on the WP:GL/MAP. This is to build a great cartographer team. Next, it will be need to move on the real battle field, there are many requests to check and to try. We will do a part of them ! and improve that way : ) That sound good. Cheers ! Yug (talk) 09:51, 18 March 2012 (UTC)
Need Help with Distribution Maps for Wikiproject Birds
Few WP articles on migratory birds of the western hemisphere have adequate distribution maps per the project's guidelines. I am updating articles on American swallows and swifts beginning with the Chimney Swift. Distribution maps are relatively simple, outlines of the continents and countries/states/provinces with the breeding and wintering ranges of a bird species highlighted in standard colors. Most print and on-line bird guides contain distribution maps. An example is the AllAboutBirds Chimney Swift article. Most of the print and on-line maps were produced in the mid to late 20th century and, for the species in which I am most interested, are out of date. If you go to the AllAboutBirds Chimney Swift article, click on "View dynamic map of eBird sightings" just below the map that is included. Note that Chimney Swifts are now commonly sited in Idaho, Arizona and parts of California. That breeding distribution is confirmed by the USGS Breeding bird survey data. In addition, the South American distribution is wider than previously shown. Creating an accurate distribution map that is current based on raw data should violate neither WP:SYNTH nor WP:NOR, in my opinion. Please correct me if I'm wrong.
I have no background in cartography. If someone here can point me to large outline maps of the western hemisphere that include outlines of countries/provinces/states, I may be able to use the GIMP to trace outlines and fill in distribution maps. A revision of the Chimney Swift article is slowly growing in my sandbox. I would appreciate help from those more experienced dealing with maps. Thanks in advance, DocTree (talk) 04:23, 2 June 2012 (UTC)
Standards for location maps
I put in a request a few months ago for a location map for the USSR, which wasn't fulfilled. Meanwhile someone has made one on commons, but it hasn't been done using GIS software, doesn't have co-ordinates and probably isn't right. I really need a location map for the Main Centre for Missile Attack Warning article so I've sat down and tried to work out how to make one. The tutorials don't cover these and I cannot find the standards anywhere, never mind a tutorial. Is this key in German the standard to follow? Does anyone know how the differing line widths are defined? Is there a tutorial on making location maps anywhere, even in French or German? I'm finding this really frustrating! Thanks. Secretlondon (talk) 22:04, 23 June 2012 (UTC)
- Any map can be used as a location map. The secret is in the Wikipedia template and not in the map itself. You basically define the longitudes and latitudes that match the maps edges and the template will automatically calculate the x,y when you enter the coordinates for a city. The only catch is, this will work only for maps with cylindrical projection, which keeps the parallels and meridians as straight horizontal and vertical lines. For Canada, Russia and the USSR, very large countries at very high latitudes, cylindrical projection creates extreme distortion, that's why other types of projection are usually used for these countries. This complicates the calculation process, See for example the difference in the formula between Template:Location map Russia and Template:Location map Spain. Apparently users still active here cannot help you.
- I'd suggest you post your request to the German Map Workshop or directly ask one of the regular contributors there (you can try User:NordNordWest who's one of the active regulars). The German workshop have more mappers and excellent ones at that. Most probably you'll have more luck there and they might be able to provide both political and relief maps. If for some reason you don't find a response there, you can come back here or post on my talk page and I'll try to concoct something for you using available Commons maps (not a location map, a normal one just for the missile warning article).
- It seems, by the way, that most of the USSR maps we have now are of low quality and even wrong (esp. historical borders of East Germany, Czechoslovakia, Yugoslavia, and the extent of Aral sea) so any good quality map will be a huge improvement.
- Hope that helps. Cheers! -- Orionist ★ talk 13:36, 24 June 2012 (UTC)
- Thanks for your help. By following the tutorial I've got a vector map out of QGIS (and should be able to do a relief map too). It's how to work with it that I'm stuck with now. Secretlondon (talk) 20:14, 24 June 2012 (UTC)
- I see you went with equirectangular projection (which is easier to implement but very distorted). But your map is messing the parts east of 180 long. For that, you might want to have a look at Template:Location_map_Russia_(equirectangular), it has some instructions on how to get a 180 crossing template to work. You might also want to remove administrative divisions of neighboring countries, as the map looks very crowded.-- Orionist ★ talk 08:20, 25 June 2012 (UTC)
- Thanks again! It looks like the current maps we have are using the edcp projection - do you know how to select that in QGIS? There's nothing in the list of projections - does it have another name? I'd modify File:Russia edcp location map.svg but it misses out some of Ukraine, and some of the south. I've no idea where the formulas come from so borrowing them from another template is appealing. Secretlondon (talk) 04:08, 26 June 2012 (UTC)
- I see you went with equirectangular projection (which is easier to implement but very distorted). But your map is messing the parts east of 180 long. For that, you might want to have a look at Template:Location_map_Russia_(equirectangular), it has some instructions on how to get a 180 crossing template to work. You might also want to remove administrative divisions of neighboring countries, as the map looks very crowded.-- Orionist ★ talk 08:20, 25 June 2012 (UTC)
- Thanks for your help. By following the tutorial I've got a vector map out of QGIS (and should be able to do a relief map too). It's how to work with it that I'm stuck with now. Secretlondon (talk) 20:14, 24 June 2012 (UTC)
Stale tag
What does it mean when a request is tagged by a bot as Stale? --DThomsen8 (talk) 17:22, 28 October 2012 (UTC)
- Qualitatively: that means no one have edited the request for a while, so the request is not progressing. That's a soft encouragement to take the request.
- Quantitatively, I don't remember after how many days of inactivity this template is pasted in. Yug (talk) 20:02, 28 October 2012 (UTC)
Individual Engagement Grant Notification
Hello! I have posted a draft of an Individual Engagement Grant titled GIS and Cartography in Wikimedia. The grant calls for increased contributions of map content to Wikimedia projects through outreach to GIS and cartography communities that are currently not exposed to the idea and practice of contributing content to Wikimedia. This will be led by Darin Jensen, the Department Cartographer and a Continuing Lecturer in UC Berkeley’s geography department and Evelyn Hammid (myself), a UC Berkeley geography student and Wikipedia editor. We will recruit GIS and cartography courses in colleges, universities and possibly high schools into the US Education Program and assist these classes in contributing their projects to Wikimedia. We will also conduct outreach to GIS and cartography communities outside of schools to encourage freely licensed map contributions. If you are interested in this project or have any questions or concerns, please take a look at the draft and comment on the discussion page. Thank you and I look forward to hearing from you. EHammid (talk) 04:49, 16 February 2013 (UTC)
M4 motorway
Over at Talk:M4 motorway there is a discussion (between non-graphics experts) on how best to show the episodic construction of the motorway, in non-continuous stretches over time. At present there is a blocky, some would say confusing and valueless, diagram attempting to show this. I have suggested an animated map, which would require an expert here to devise it - something like this would do the job. It would be very helpful if a graphics expert or two could input to that discussion, with some ideas as to what best could be done. Thanks. Ghmyrtle (talk) 10:31, 16 March 2013 (UTC)
Firenze position map
Hi! Can anyone make a position map about Firenze? - Hujber Tünde (talk) 20:06, 23 March 2013 (UTC)
- I think you're talking about the city of Florence? If so you can find many maps in the related Commons category Category:Maps of Florence. If you meant the Province of Florence then you can find a location map in its article. If you can't find what you need in those places, can you be more specific, or give us an example of the type of map you want? Cheers! -- Orionist ★ talk 04:08, 24 March 2013 (UTC)
- Sorry! Of course I talk about the city of Florence, in Italy. I need a map I can use in the infobox of buildings, statues, squares, etc. located in this town. Can you help me? - Hujber Tünde (talk) 13:05, 24 March 2013 (UTC)
- Why don't you take a map from openstreetmap.org. You can download it in png. or svg. Wereldburger758 (talk) 13:50, 24 March 2013 (UTC)
- Because I don't know that site and I don't know how to use it and how to make a position map. - Hujber Tünde (talk) 18:49, 24 March 2013 (UTC)
- Why don't you take a map from openstreetmap.org. You can download it in png. or svg. Wereldburger758 (talk) 13:50, 24 March 2013 (UTC)
- Sorry! Of course I talk about the city of Florence, in Italy. I need a map I can use in the infobox of buildings, statues, squares, etc. located in this town. Can you help me? - Hujber Tünde (talk) 13:05, 24 March 2013 (UTC)
- This request is now at the workshop page. I moved it there to work on it properly. -- Orionist ★ talk 22:04, 24 March 2013 (UTC)
Overland Trail and two spurs through Colorado
I'm new to the map world, and I'm not ready to make an official map request just yet. What I'd love to know is if it would be possible to make a fairly simple map of the state of Colorado (File:USA Colorado location map.svg) that has the path shown in this photo: here. I apologize for it being so tiny, it's from a 1964 document on JStor and is probably copyrighted. Please note that only the dotted trail (not the dashed) would be required, and I've shown more of the surrounding states than needed to give the mapmaker a sense of direction. I've seen the cool location maps with floating dots on them, but I wasn't sure how an actual trail would be produced. Is this feasible? Again, not a formal request just yet. – Kerαunoςcopia◁galaxies 19:05, 8 April 2013 (UTC)
SMOM Map Colours (SMOM_relations.svg)
In the map at http://upload.wikimedia.org/wikipedia/commons/7/77/SMOM_relations.svg, Canada is coloured orange based on relations with SMOM other than diplomatic (e.g., postal system cooperation). The English article on SMOM mentions that this situation exists for both Canada and Mongolia. Therefore, should Mongolia not also be coloured orange?
Jeff in CA 18:47, 22 April 2013 (UTC)
Base map of Asia with countries grouped for easy colouring
I am looking for a .svg map of Asia with countries grouped for easy colouring (Philippines is a pain to do manually). The following map uses th
http://commons.wikimedia.org/wiki/File:Location_Map_Asia.svg
However, countries don't appear to be grouped. I found one which has countries grouped, but it isn't the same projection or look.
http://commons.wikimedia.org/wiki/File:Asia_countries-gray.svg
Are you aware of any other .svg maps of Asia with countries grouped for easy colouring?
Thank you.
Anyanghaseyo (talk) 19:43, 30 May 2013 (UTC)
- What's wrong with Asia_countries-gray.svg? Its projection actually looks much better than Location_Map_Asia.svg (which seems to be cut from the world map in Robinson projection). Hellerick (talk) 09:01, 3 June 2013 (UTC)
Has the Map workshop shut down?
Nothing has been produced for months - what's the problem here? Roger (Dodger67) (talk) 10:26, 5 August 2013 (UTC)
- The problem is that we don't have any cartographers, we've never had more than 1 or 2 at a time. I've been too busy to take requests. Kmusser (talk) 14:34, 5 August 2013 (UTC)
Are all of the Cartographers gone or something?
Ok! So about a five days ago I put a request in for a new map of the Sasanian Empire or at least an improved version of my map of the Sasanian Empire that I made. See here:http://en.wikipedia.org/wiki/Wikipedia:Graphics_Lab/Map_workshop#New_Sasanian_Empire_Map.21 So far no Graphist has responded to the request at all. I am not sure if the Graphists are supposed to make a response and the Cartographers make the maps after the response or if the Cartographers make see the request and make decide to go ahead and make the map while leaving no response to the user who requested it. I do not mean to sound rude if I am, but I was just wondering why no one has responded to my map request. Regards. Keeby101 (talk) 05:54, 20 August 2013 (UTC)
Summer 2013 call for cartograpahers !
|
As noticed upper, we lack PNG or SVG cartographers ! It's time to call for users, graphists, who may be interested in map making and to get some graphic competences ! Images, maps are one of Wikipedia's sides where we can contribute with fun while getting graphist skills. We do have ressources (location maps! SVG map tutorial) which allow to satisfy most requests. Yet, we have to connect them more with potential cartographers. Let's push for more clarity while calling for graphists to get involve. If need, let's reset the list of requests, wipe it, keep a hand of successful and pretty cases, so we restart on a fresh and clean ground. Yug (talk) 06:07, 21 August 2013 (UTC) |
Just updated these {{User_WikiProject_Maps}} and {User:Scepia/maps} templates. Could be improve ! |
- My push: 1. Map conventions -- I will continue the push in accordance with current and emerging best practices. The toolkit will thus be more coherent and handy. 2. WikiProject Maps main page will get a clean up. Yug (talk) 06:07, 21 August 2013 (UTC)
Thank you so much for getting new cartographers together. I see that they are responding to new requests on the Project page :D . However, sadly there is still no response to my request that I put in... :( Keeby101 (talk) 05:50, 25 August 2013 (UTC)
Are Cartographers on the Map Workshop capable of making pretty maps ?

I was just curious if the cartographers on the Map Workshop were capable of making a map like the one I linked in the title of this topic, or a map like the File:Kievan_Rus_en.jpg ?

These maps were created with the Generic Mapping Tools: http://gmt.soest.hawaii.edu/ using one or more of these public domain datasets for the relief:
- ETOPO2 (topography/bathymetry): http://www.ngdc.noaa.gov/mgg/global/global.html
- GLOBE (topography): http://www.ngdc.noaa.gov/mgg/topo/gltiles.html
- SRTM (topography): http://www2.jpl.nasa.gov/srtm/
- NaturalEarthData.com/Feature/#Raster Data Themes > 50m-bathymetry
Regards. Keeby101 (talk) 08:10, 27 August 2013 (UTC)
- Yes, a hand non-english Graphic Lab editors are able to design such maps: NordNordWest, Sting, Bourrichon, Séhmur, myself. There are also a hand of native English speaking cartographers who are able to design such maps but for some reasons they are upload maps on their side, without joining up and showing up their work on the lab. These maps are indeed very elegant and charming, but also quite time consuming depending on both the technology you use and the details you input. I heard some cartographers saying that GMT is quite convenient and rapid to produce such maps. I myself use other ways (QGIS, console : gdal, Gimp for image processing, inkscape) which give more control but need 2 working days do design a such maps. There are lot of trial, fail, redo.
- It would be good to know is those independant cartographers may jump in to share their tips for faster GMT mapmaking. Google may also help you, there are tutorials around. Just need the will to invest a weekend in it for a map which look like you wanted. Yug (talk) 08:49, 29 August 2013 (UTC)
- I suspect these guys to be professional cartographers who sometime come to drop a map on commons. Yug (talk) 08:51, 29 August 2013 (UTC)
- Héhé ! Profitant de visiter un peu par hasard cette page et de voir ton msg, je te souhaite un petit bonjour à toi Yug depuis mes contrées lointaines ! Toujours pas le temps de me remettre à la carto mais je garde toujours un œil sur WP ! Comment vont les choses sur WP-fr (section carto / vos didacticiels) ? Um abraço do país do samba ! Sting (talk) 23:21, 29 August 2013 (UTC)
- PS : À voir le sujet précédent je constate avec plaisir que les conventions cartos et les didacticiels ont fait des émules (Ikonact, p.ex.). C'est très bien ! — Preceding unsigned comment added by Sting (talk • contribs) 23:24, 29 August 2013 (UTC)
- I suspect these guys to be professional cartographers who sometime come to drop a map on commons. Yug (talk) 08:51, 29 August 2013 (UTC)
- @Keeby: Oh! Your background data, already processed, is actually already available online :
- Download: NaturalEarthData.com/Feature/#Raster Data Themes > 50m-bathymetry.
- Open in some GIS software (QGIS)
- Export the area you want as png
- Open png in Inkscape (preferably a vector editor to ease reuse/translations)
- Complete, and send to commons.
- The natural earth data processing should largely speed up your map making. : ]
- Yug (talk) 02:55, 30 August 2013 (UTC)
Ok, on regards to this part:
- Open in some GIS software (QGIS)
I am having the biggest trouble with that.. Do I open it with the apps, bin, icons, lib, share or etc part of the QGIS Lisboa? I have WinRar and I can't open this damn Natural Earth Data as long as it is stuck in a zipped file called BATH_50M... I need help! :( Keeby101 (talk) 18:46, 31 August 2013 (UTC)
- Oh.
- 1. You indeed need to unzip first.
- 2. BATH_50M.zip unzip > BATH_50M.psd in Photoshop. (see webpage saying: Rasterized 10m vector polygons in a layered Photoshop file that you can manipulate for color and then save a GeoTIF —use with the provided TFW world file. Optional reference layers include an ocean mask and land shaded relief.)
- Note: The image is very, very, very big. My 2Ghz CPU + Gimp has difficulties to handle it.
- 3. Which OS do you have? Do you have Photoshop ?
- 4. Are you familar the Console ? (may sometimes be easier)
- 5. What are the W,S,E,N border of your area of interest on an plate carrée map ? Yug (talk) 06:45, 1 September 2013 (UTC)
I do not have Photoshop. I have Quantum GIS Lisbona. I know how to use Photoshop very well and I might just download it because Quantum GIS Lisbona is not working out quite the way I planned. I am not familiar with Console. On regards to the W,S,E,N border of my area of interest on a plate carree map, It would be the entire Middle-east/Central Asia area that would also include Egypt.
Also, do I need Photoshop to create the type of maps that I want to make? Do I need Photoshop to unzip BATH_50M.zip? Is it easier to create these advanced maps with Photoshop?
Regards. :) Keeby101 (talk) 03:16, 2 September 2013 (UTC)
Nevermind, I got it on Photoshop and unzipped. All that I am asking is how did you all make the colors so bright on the Khazar map? I try using yellow, orange and red and all that I can get is dark yellow, semi-dark red and dark orange.... Can anyone help? What tools on Photoshop did you all use to create the countries on those maps? I really need to know! Regards. --Keeby101 (talk) 15:43, 2 September 2013 (UTC)
P.S. Yug, I took your advice and went on to Google images as well as looked at sources such as Cambridge Ancient History. They were very reliable, but none of the less, I need a response to what I posted above soon. Cheers! :) Keeby101 (talk) 07:29, 5 September 2013 (UTC)
SVG locator maps (all of them)...
I hope I'm not opening up a can of worms here... In investigating a map request, I checked a couple SVG locator maps in Illinois. While the PNG thumbnails for these images worked, opening the SVG only produced the red box of the located county, with no other county outlines or state outlines. I expanded my search further out, and found that all the county locator maps of all (so far as I've checked) would not render properly. Since I use Chrome, I decided to check other browsers. Firefox also produced the bad image, while IE did produce a fully rendered SVG image. So I decided to check the images with the W3C validator, and the SVGs are not properly formatted. Do these ALL need to be corrected? As a test case, I worked up an updated SVG image: file:Jo Daviess County Illinois map test.svg, to compare with the old version: file:Map of Illinois highlighting Jo Daviess County.svg.
- Since our objective is to provide in-article maps, I would say we don't *have to* fix that. Maps are properly rendered in PNG, end users are satisfied, priority is low. There is also a US location maps guideline & project designed by user:Shereth which was planing to programmatically redraw all these maps. It may be good to support and complete this last project, so all these maps are updated. Yug (talk) 11:56, 11 September 2013 (UTC)
- ^ http://wiki.inkscape.org/wiki/index.php/Inkscape_for_Adobe_Illustrator_users#Formats
- ^ http://webcache.googleusercontent.com/search?q=cache:iCK4i1ItCPYJ:un.regne.net/dotclear/index.php/2006/01/25/70-from-inkscape-to-illustrator+inkscape+svg+to+illustrator&cd=17&hl=fr&ct=clnk&client=ubuntu&source=www.google.com