Jiangchuan, Yuxi
Jiangchuan
江川区 | |
|---|---|
 A sculpture in Jiangchuan | |
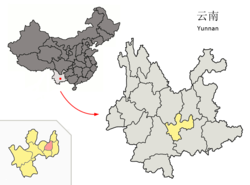
 Location of Jiangchuan (pink) and Yuxi Prefecture (yellow) within Yunnan province of China | |
| Country | People's Republic of China |
| Province | Yunnan |
| Prefecture-level city | Yuxi |
| Area | |
| • Total | 850 km2 (330 sq mi) |
| Population (2000) | |
| • Total | 260,000 |
| • Density | 310/km2 (790/sq mi) |
| Time zone | UTC+8 (CST) |
| Postal code | 652600 |
| Area code | 0877 |
| Website | www |
Jiangchuan District (Chinese: 江川区; pinyin: Jiāngchuān Qū) is located in Yuxi, Yunnan, China.
Marks of fire use in Gantangjing Paleolithic site, showing bite marks of carnivorous fauna and rodents as well as traces of industry.[1]
Climate
| Climate data for Jiangchuan (1981−2010) | |||||||||||||
|---|---|---|---|---|---|---|---|---|---|---|---|---|---|
| Month | Jan | Feb | Mar | Apr | May | Jun | Jul | Aug | Sep | Oct | Nov | Dec | Year |
| Record high °C (°F) | 23.8 (74.8) |
26.2 (79.2) |
29.6 (85.3) |
31.5 (88.7) |
32.7 (90.9) |
32.2 (90.0) |
32.1 (89.8) |
31.0 (87.8) |
31.8 (89.2) |
28.2 (82.8) |
26.4 (79.5) |
24.6 (76.3) |
32.7 (90.9) |
| Mean daily maximum °C (°F) | 17.2 (63.0) |
19.3 (66.7) |
22.5 (72.5) |
25.6 (78.1) |
25.8 (78.4) |
25.9 (78.6) |
25.6 (78.1) |
25.7 (78.3) |
24.3 (75.7) |
22.2 (72.0) |
19.3 (66.7) |
16.7 (62.1) |
22.5 (72.5) |
| Daily mean °C (°F) | 8.7 (47.7) |
10.6 (51.1) |
14.0 (57.2) |
17.9 (64.2) |
20.1 (68.2) |
21.0 (69.8) |
20.8 (69.4) |
20.4 (68.7) |
18.9 (66.0) |
16.7 (62.1) |
12.5 (54.5) |
8.9 (48.0) |
15.9 (60.6) |
| Mean daily minimum °C (°F) | 2.8 (37.0) |
3.8 (38.8) |
6.8 (44.2) |
11.1 (52.0) |
15.4 (59.7) |
17.5 (63.5) |
17.5 (63.5) |
16.9 (62.4) |
15.5 (59.9) |
13.3 (55.9) |
8.0 (46.4) |
3.8 (38.8) |
11.0 (51.8) |
| Record low °C (°F) | −4.0 (24.8) |
−1.9 (28.6) |
−2.3 (27.9) |
2.1 (35.8) |
6.8 (44.2) |
11.3 (52.3) |
12.6 (54.7) |
11.5 (52.7) |
7.6 (45.7) |
4.9 (40.8) |
−1.9 (28.6) |
−5.9 (21.4) |
−5.9 (21.4) |
| Average precipitation mm (inches) | 13.5 (0.53) |
17.4 (0.69) |
19.4 (0.76) |
35.5 (1.40) |
88.4 (3.48) |
137.3 (5.41) |
167.3 (6.59) |
154.8 (6.09) |
93.3 (3.67) |
66.5 (2.62) |
41.0 (1.61) |
14.5 (0.57) |
848.9 (33.42) |
| Average relative humidity (%) | 74 | 68 | 62 | 60 | 68 | 78 | 82 | 82 | 80 | 80 | 78 | 78 | 74 |
| Source: China Meteorological Data Service Center | |||||||||||||
References
External links
24°19′04″N 102°45′11″E / 24.31778°N 102.75306°E
