
Demographics of Glasgow

Glasgow is the most populous city in Scotland and the fourth most populous city in the United Kingdom.
Population
Glasgow's total population, according to the 2011 UK census, was 593,245. The population density was 3,289 people per square km.
Ethnicity
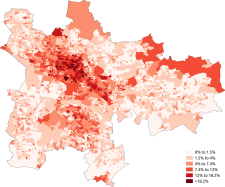
The following table shows the ethnic group of respondents in the 2001 and 2011 censuses in Glasgow.
| Ethnic Group | 2001[1] | 2011[2] | ||
|---|---|---|---|---|
| Number | % | Number | % | |
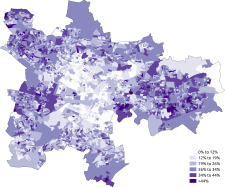
| White: Scottish | 503,614 | 87.15% | 466,241 | 78.59% |
| White: Other British | 20,934 | 3.62% | 24,154 | 4.07% |
| White: Irish | 11,467 | 1.98% | 11,228 | 1.89% |
| White: Gypsy/Traveller[note 1] | 407 | 0.07% | ||
| White: Polish[note 2] | 8,406 | 1.42% | ||
| White: Other | 10,344 | 1.79% | 14,125 | 2.38% |
| White: Total | 546,359 | 94.55% | 524,561 |
88.42% |
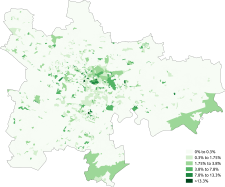
| Asian, Asian Scottish or Asian British: Indian | 4,173 | 0.72% | 8,640 | 1.46% |
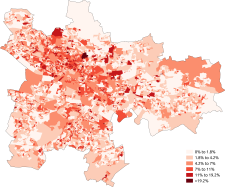
| Asian, Asian Scottish or Asian British: Pakistani | 15,330 | 2.65% | 22,405 | 3.78% |
| Asian, Asian Scottish or Asian British: Bangladeshi | 237 | 0.04% | 458 | 0.08% |
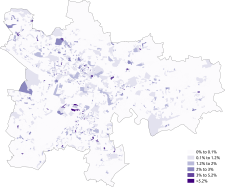
| Asian, Asian Scottish or Asian British: Chinese | 3,876 | 0.67% | 10,689 | 1.80% |
| Asian, Asian Scottish or Asian British: Asian Other | 2,020 | 0.35% | 5,566 | 0.94% |
| Asian, Asian Scottish or Asian British: Total | 25,636 | 4.44% | 47,758 | 8.05% |
| Black, Black Scottish or Black British[note 3] | 1,792 | 0.31% | ||
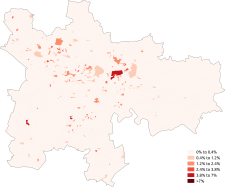
| African: African, African Scottish or African British | 12,298 | 2.07% | ||
| African: Other African | 142 | 0.02% | ||
| African: Total | 12,440 |
2.10% | ||
| Caribbean | 783 | 0.13% | ||
| Black | 820 | 0.14% | ||
| Caribbean or Black: Other | 203 | 0.03% | ||
| Caribbean or Black: Total | 1,806 | 0.30% | ||
| Mixed or multiple ethnic groups: Total | 2,046 | 0.35% | 2,879 | 0.49% |
| Other: Arab[note 4] | 2,631 | 0.44% | ||
| Other: Any other ethnic group | 2,036 | 0.35% | 1,170 | 0.20% |
| Other: Total | 2,036 | 0.35% | 3,801 | 0.64% |
| Total | 577,869 | 100.00% | 593,245 | 100.00% |
Distribution of ethnic groups in Glasgow according to the 2011 census.
-
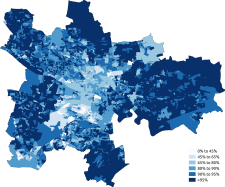 White
White -
 White-Scottish
 -
 White-Other British
 -
 White-Irish
 -
 White-Polish
 -
 White-Other
 -
 Asian
Asian -
 Asian-Indian
 -
 Asian-Pakistani
 -
 Asian-Bangladeshi
 -
 Asian-Chinese
 -
 African
 -
 Caribbean or Black
 -
 Other-Arab


Languages
The languages other than English used at home in Glasgow according to the 2011 census are shown below.[3]
| Language | Usual residents aged 3+ | Proportion |
|---|---|---|
| English only | 496,027 | 86.62% |
| Gaelic | 2,305 | 0.40% |
| Scots | 2,826 | 0.49% |
| British Sign Language | 1,717 | 0.30% |
| Polish | 7,379 | 1.29% |
| Other | 62,379 | 10.89% |
Religion
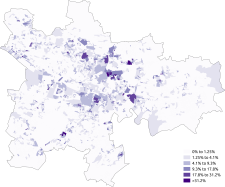
The following table shows the religion of respondents in the 2001 and 2011 censuses in Glasgow.
| Current religion | 2001[1] | 2011[4] | ||
|---|---|---|---|---|
| Number | % | Number | % | |
| Church of Scotland | 182,172 | 31.52% | 136,889 | 23.07% |
| Roman Catholic | 168,733 | 29.20% | 161,685 | 27.25% |
| Other Christian | 23,488 | 4.06% | 24,380 | 4.11% |
| Total Christian | 374,393 | 64.79% | 322,954 | 54.44% |
| Islam | 17,792 | 3.08% | 32,117 | 5.41% |
| Hinduism | 1,209 | 0.21% | 4,074 | 0.69% |
| Buddhism | 1,194 | 0.21% | 2,570 | 0.43% |
| Sikhism | 2,374 | 0.41% | 3,149 | 0.53% |
| Judaism | 1,083 | 0.19% | 897 | 0.15% |
| Other religion | 3,799 | 0.66% | 1,599 | 0.27% |
| No religion | 131,189 | 22.70% | 183,835 | 30.99% |
| Religion not stated | 44,836 | 7.76% | 42,050 | 7.09% |
| No religion/Not stated total | 176,025 | 30.46% | 225,885 | 38.08% |
| Total population | 577,869 | 100.00% | 593,245 | 100.00% |
Distribution of religions in Glasgow according to the 2011 census.
-
 Christianity
 -
 Church of Scotland
 -
 Roman Catholic
 -
 Other Christian
 -
 Islam
Islam -
 Judaism
 -
 Hinduism
 -
 Sikhism
 -
 Buddhism
 -
 Other religion
 -
 No religion


See also
- Demography of the United Kingdom
- Demography of Scotland
- Demography of London
- Demography of Birmingham
- Demography of Greater Manchester
- List of towns and cities in Scotland by population
- List of Scottish council areas by population
- List of Scottish council areas by area
- List of Scottish council areas by population density
References
- ^ a b "Briefing Paper 2011 Census – Release 2A – Results for Glasgow City". Glasgow City Council. 17 October 2013.
- ^ "Scotland's Census 2011 – Table KS201SC". scotlandscensus.gov.uk. Retrieved 3 November 2015.
- ^ "Scotland's Census 2011 – Table DC2119SC". scotlandscensus.gov.uk. Retrieved 3 November 2015.
- ^ "Scotland's Census 2011 – Table KS209SCb". scotlandscensus.gov.uk. Retrieved 3 November 2015.
