
Eglinton—Lawrence (federal electoral district)
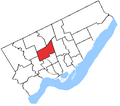
.png) Eglinton—Lawrence in relation to other electoral districts in Toronto (2015 boundaries) | |||
| Federal electoral district | |||
| Legislature | House of Commons | ||
| MP |
Liberal | ||
| District created | 1976 | ||
| First contested | 1979 | ||
| Last contested | 2015 | ||
| District webpage | profile, map | ||
| Demographics | |||
| Population (2011)[1] | 113,150 | ||
| Electors (2015) | 76,739 | ||
| Area (km²)[2] | 22.67 | ||
| Pop. density (per km²) | 4,991.2 | ||
| Census division(s) | Toronto | ||
| Census subdivision(s) | Toronto | ||
.gif)
Eglinton—Lawrence is a federal electoral district in Ontario, Canada, that has been represented in the House of Commons of Canada since 1979.
It covers a portion of Toronto northwest of downtown. It stretches from Yonge Street in the east to Caledonia in the west and from Highway 401 in the north to Eglinton Avenue in the south. Lawrence Avenue runs through the centre of the riding. Neighbourhoods in the riding include Bedford Park, Lawrence Manor, Lawrence Heights, the southwestern part of York Mills and the western part of Lawrence Park. The riding includes portions of the former cities of North York, Toronto, and York.
As per the 2016 Census, Eglinton—Lawrence is the City of Toronto riding with the highest percentage of people of Polish ethnic origin (12.0%) and the second-highest percentage of people of Jewish ethnic origin (5.1%). In the 2011 National Household Survey more than 15% of the residents of Eglinton—Lawrence filled in a Jewish ethnic origin.
The riding was created in 1976 from parts of Eglinton, York Centre, York South, and York West. Federally, it was represented by Liberal Joe Volpe from 1988 to 2011, by Conservative Joe Oliver from 2011 to 2015, and by Liberal Marco Mendicino since the 2015 federal election.
History
This riding's boundaries were not changed during the 2012 electoral redistribution.
Former boundaries
-
 1979 to 1988
 -
 1988 to 1997
 -
 1997 to 2004
 -
 2004 to present


Members of Parliament
This riding has elected the following Members of Parliament:
| Parliament | Years | Member | Party | |
|---|---|---|---|---|
| Eglinton—Lawrence Riding created from Eglinton, York Centre, York South and York West |
||||
| 31st | 1979–1980 | Roland de Corneille | Liberal | |
| 32nd | 1980–1984 | |||
| 33rd | 1984–1988 | |||
| 34th | 1988–1993 | Joe Volpe | ||
| 35th | 1993–1997 | |||
| 36th | 1997–2000 | |||
| 37th | 2000–2004 | |||
| 38th | 2004–2006 | |||
| 39th | 2006–2008 | |||
| 40th | 2008–2011 | |||
| 41st | 2011–2015 | Joe Oliver | Conservative | |
| 42nd | 2015–present | Marco Mendicino | Liberal | |
Election results
| 2015 Canadian federal election | ||||||||
|---|---|---|---|---|---|---|---|---|
| Party | Candidate | Votes | % | ±% | Expenditures | |||
| Liberal | Marco Mendicino | 27,278 | 48.89 | +10.47 | $155,849.60 | |||
| Conservative | Joe Oliver | 23,788 | 42.64 | -4.18 | $183,256.52 | |||
| New Democratic | Andrew Thomson | 3,505 | 6.28 | -5.32 | $114,205.95 | |||
| Green | Matthew Chisholm | 799 | 1.43 | -1.74 | $217.60 | |||
| Libertarian | Ethan Buchman | 308 | 0.55 | – | – | |||
| Animal Alliance | Rudy Brunell Solomonvici | 114 | 0.20 | – | $5,129.72 | |||
| Total valid votes/Expense limit | 55,792 | 100.00 | $210,250.86 | |||||
| Total rejected ballots | 328 | 0.58 | ||||||
| Turnout | 56,120 | 72.45 | ||||||
| Eligible voters | 77,463 | |||||||
| Liberal gain from Conservative | Swing | +7.32 | ||||||
| Source: Elections Canada[3][4] | ||||||||
| 2011 Canadian federal election | ||||||||
|---|---|---|---|---|---|---|---|---|
| Party | Candidate | Votes | % | ±% | Expenditures | |||
| Conservative | Joe Oliver | 22,652 | 46.81 | +7.56 | ||||
| Liberal | Joe Volpe | 18,590 | 38.42 | -5.57 | ||||
| New Democratic | Justin Chatwin | 5,613 | 11.60 | +3.18 | ||||
| Green | Paul Baker | 1,534 | 3.17 | -5.17 | ||||
| Total valid votes | 48,389 | 100.00 | ||||||
| Total rejected ballots | 302 | 0.62 | +0.12 | |||||
| Turnout | 48,691 | 68.02 | +8.27 | |||||
| Conservative gain from Liberal | Swing | +6.57 | ||||||
Source: Elections Canada
| 2008 Canadian federal election | ||||||||
|---|---|---|---|---|---|---|---|---|
| Party | Candidate | Votes | % | ±% | Expenditures | |||
| Liberal | Joe Volpe | 19,133 | 43.99 | -8.90 | $46,582 | |||
| Conservative | Joe Oliver | 17,073 | 39.25 | +9.00 | $82,193 | |||
| New Democratic | Justin Chatwin | 3,663 | 8.42 | -3.07 | $4,729 | |||
| Green | Andrew James | 3,629 | 8.34 | +3.22 | $6,136 | |||
| Total valid votes/Expense limit | 43,498 | 100.00 | $82,294 | |||||
| Total rejected ballots | 219 | 0.50 | ||||||
| Turnout | 43,717 | 59.75 | ||||||
| Liberal hold | Swing | -8.95 | ||||||
Template:Canadian federal election, 2006/Electoral District/Eglinton—Lawrence
Template:Canadian federal election, 2004/Electoral District/Eglinton—Lawrence
Template:Canadian federal election, 2000/Electoral District/Eglinton—Lawrence
Template:Canadian federal election, 1997/Electoral District/Eglinton—Lawrence
Template:Canadian federal election, 1993/Electoral District/Eglinton—Lawrence
Template:Canadian federal election, 1988/Electoral District/Eglinton—Lawrence
| 1984 Canadian federal election | ||||||||
|---|---|---|---|---|---|---|---|---|
| Party | Candidate | Votes | % | ±% | ||||
| Liberal | Roland de Corneille | 18,645 | 42.98 | -7.49 | ||||
| Progressive Conservative | Dan La Caprara | 17,476 | 40.29 | +6.46 | ||||
| New Democratic | Marlene Miller | 6,458 | 14.89 | +0.19 | ||||
| Libertarian | Linda Cain | 362 | 0.83 | 0.00 | ||||
| Independent | Ken Kirk | 219 | 0.50 | |||||
| Communist | Nan McDonald | 219 | 0.50 | |||||
| Total valid votes | 43,379 | 100.00 | ||||||
| 1980 Canadian federal election | ||||||||
|---|---|---|---|---|---|---|---|---|
| Party | Candidate | Votes | % | ±% | ||||
| Liberal | Roland de Corneille | 20,861 | 50.47 | +7.59 | ||||
| Progressive Conservative | Rob Parker | 13,985 | 33.83 | -5.35 | ||||
| New Democratic | Graham Murray | 6,077 | 14.70 | -1.70 | ||||
| Libertarian | Linda Cain | 343 | 0.83 | -0.47 | ||||
| Marxist–Leninist | Iqbal S. Sumbal | 71 | 0.17 | -0.08 | ||||
| Total valid votes | 41,337 | 100.00 | ||||||
| 1979 Canadian federal election | ||||||||
|---|---|---|---|---|---|---|---|---|
| Party | Candidate | Votes | % | |||||
| Liberal | Roland de Corneille | 19,270 | 42.88 | |||||
| Progressive Conservative | Rob Parker | 17,605 | 39.18 | |||||
| New Democratic | Leo Heaps | 7,368 | 16.40 | |||||
| Libertarian | Linda Cain | 585 | 1.30 | |||||
| Marxist–Leninist | Iqbal S. Sumbal | 111 | 0.25 | |||||
| Total valid votes | 44,939 | 100.00 | ||||||
Toronto Council Wards 15 and 16
Eglinton - Lawrence is also the name for two wards on Toronto City Council each represented by a city councillor:
- (Ward 15) Eglinton - Lawrence - current councillor Josh Colle
- (Ward 16) Eglinton - Lawrence - current councillor Christin Carmichael Greb
The combined ward boundaries roughly corresponds to the federal electoral district.
See also
References
- "Eglinton—Lawrence (federal electoral district) (Code 35019) Census Profile". 2011 census. Government of Canada - Statistics Canada. Retrieved 2012-03-02.