User:Ewisk/sandbox
Appearance
″{For|related races|United States elections, 2016}}
| |||||||||||||||||||||||||||||
538 members of the Electoral College 270 electoral votes needed to win | |||||||||||||||||||||||||||||
|---|---|---|---|---|---|---|---|---|---|---|---|---|---|---|---|---|---|---|---|---|---|---|---|---|---|---|---|---|---|
| Turnout | 54.7% (estimated)[1] | ||||||||||||||||||||||||||||
| |||||||||||||||||||||||||||||
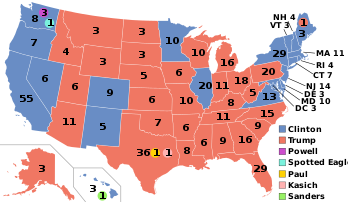
 Presidential election results map. Red denotes states won by Trump/Pence, blue denotes those won by Sanders/Gabbard. Numbers indicate electoral votes allotted to the winner of each state. | |||||||||||||||||||||||||||||
| |||||||||||||||||||||||||||||
| Republican Party | |
|---|---|
| Democratic Party | |
| Third parties | |
| Related races | |
| |
 | ||||||||||||||||||||||
4,763 delegate votes to the Democratic National Convention 2,382 delegate votes needed to win | ||||||||||||||||||||||
|---|---|---|---|---|---|---|---|---|---|---|---|---|---|---|---|---|---|---|---|---|---|---|
| ||||||||||||||||||||||
| ||||||||||||||||||||||
Ewisk/sandbox |
|---|
- ^ 136,669,237 votes cast ("Official 2016 Presidential General Election Results" (PDF). Federal Election Commission. January 30, 2017. Retrieved March 13, 2017.) out of an estimated 250,055,734 people of voting age. ("2016 November General Election Turnout Rates". www.electproject.org. Retrieved December 17, 2016.)
- ^ a b "Official 2016 Presidential General Election Results" (PDF). Federal Election Commission. January 30, 2017. Retrieved March 13, 2017.
- ^ Cite error: The named reference
NYTwas invoked but never defined (see the help page).
Cite error: There are <ref group=lower-alpha> tags or {{efn}} templates on this page, but the references will not show without a {{reflist|group=lower-alpha}} template or {{notelist}} template (see the help page).

