
Sagbayan
Sagbayan
Borja | |
|---|---|
| Municipality of Sagbayan | |
.jpg) San Agustin | |
 Flag | |
 Map of Bohol with Sagbayan highlighted | |
OpenStreetMap  | |
.svg) Sagbayan Location within the Philippines | |
| Coordinates: 9°55′N 124°06′E / 9.92°N 124.1°E | |
| Country | Philippines |
| Region | Central Visayas |
| Province | Bohol |
| District | 2nd district |
| Barangays | 24 (see Barangays) |
| Government | |
| • Type | Sangguniang Bayan |
| • Mayor | Restituto Q. Suarez III |
| • Vice Mayor | Asuncion B. Ybañez |
| • Representative | Erico Aristotle C. Aumentado |
| • Municipal Council | Members |
| • Electorate | 16,758 voters (2022) |
| Area | |
| • Total | 69.61 km2 (26.88 sq mi) |
| Elevation | 424 m (1,391 ft) |
| Highest elevation | 327 m (1,073 ft) |
| Lowest elevation | 47 m (154 ft) |
| Population (2020 census)[3] | |
| • Total | 24,335 |
| • Density | 350/km2 (910/sq mi) |
| • Households | 5,897 |
| Economy | |
| • Income class | 4th municipal income class |
| • Poverty incidence | 25.05 |
| • Revenue | ₱ 113.5 million (2020) |
| • Assets | ₱ 337.3 million (2020) |
| • Expenditure | ₱ 137 million (2020) |
| • Liabilities | ₱ 45.93 million (2020) |
| Service provider | |
| • Electricity | Bohol 1 Electric Cooperative (BOHECO 1) |
| Time zone | UTC+8 (PST) |
| ZIP code | 6331 |
| PSGC | |
| IDD : area code | +63 (0)38 |
| Native languages | Boholano dialect Cebuano Tagalog |
Sagbayan, officially the Municipality of Sagbayan (Cebuano: Munisipyo sa Sagbayan; Tagalog: Bayan ng Sagbayan), is a 4th class municipality in the province of Bohol, Philippines. According to the 2020 census, it has a population of 24,335 people.[3]
Sagbayan means "place for hanging", coming from the root word sagbay, which means "to hang" and referred to the practice of hanging deer hides on trees to dry after hunting expeditions.[5]
Its main attraction is Sagbayan Peak, a tourism site overlooking a scenic valley with an observation platform and children's playground.[6] While some similar hill formations are visible, it is not within the main Chocolate Hills area.
The town of Sagbayan, Bohol celebrates its feast on May 4/August 28, to honor the town patron San Agustin.[7]
History
Sagbayan was formerly part of the surrounding municipalities of Clarin, Inabanga, Carmen, and Catigbian. It was formed into a separate town by an Executive Order of President Elpidio Quirino on 9 February 1949, and named Borja,[8] in honor of Salustiano Borja, the first elected civil governor of the Province of Bohol.[5] It reverted to its original name in 1957.[9]
In October 2013, Sagbayan was close to the epicenter of a magnitude 7.2 earthquake. The town suffered 12 fatalities and damage to almost 1,000 homes, as well as total destruction of its town hall.[10]
Geography
Barangays
Sagbayan comprises 24 barangays:
| PSGC | Barangay | Population | ±% p.a. | |||
|---|---|---|---|---|---|---|
| 2020[3] | 2010[11] | |||||
| 071236001 | Calangahan | 3.9% | 957 | 910 | 0.50% | |
| 071236002 | Canmano | 3.9% | 947 | 1,006 | −0.60% | |
| 071236003 | Canmaya Centro | 6.0% | 1,448 | 1,317 | 0.95% | |
| 071236004 | Canmaya Diot | 5.0% | 1,221 | 1,161 | 0.51% | |
| 071236005 | Dagnawan | 3.5% | 842 | 525 | 4.84% | |
| 071236006 | Kabasacan | 2.2% | 539 | 490 | 0.96% | |
| 071236007 | Kagawasan | 1.5% | 376 | 370 | 0.16% | |
| 071236008 | Katipunan | 2.4% | 591 | 600 | −0.15% | |
| 071236009 | Langtad | 2.2% | 530 | 570 | −0.72% | |
| 071236010 | Libertad Norte | 1.5% | 353 | 316 | 1.11% | |
| 071236011 | Libertad Sur | 0.5% | 117 | 184 | −4.43% | |
| 071236012 | Mantalongon | 3.9% | 952 | 707 | 3.02% | |
| 071236013 | Poblacion | 17.1% | 4,154 | 3,945 | 0.52% | |
| 071236014 | Sagbayan Sur | 4.8% | 1,170 | 1,011 | 1.47% | |
| 071236015 | San Agustin | 4.3% | 1,037 | 867 | 1.81% | |
| 071236016 | San Antonio | 4.0% | 966 | 852 | 1.26% | |
| 071236017 | San Isidro | 3.6% | 882 | 736 | 1.83% | |
| 071236018 | San Ramon | 2.3% | 563 | 405 | 3.35% | |
| 071236019 | San Roque | 1.8% | 434 | 420 | 0.33% | |
| 071236020 | San Vicente Norte | 3.2% | 789 | 715 | 0.99% | |
| 071236021 | San Vicente Sur | 1.2% | 302 | 290 | 0.41% | |
| 071236022 | Santa Catalina | 4.7% | 1,136 | 721 | 4.65% | |
| 071236023 | Santa Cruz | 3.8% | 920 | 985 | −0.68% | |
| 071236024 | Ubojan | 4.6% | 1,113 | 988 | 1.20% | |
| Total | 24,335 | 20,091 | 1.93% | |||
Climate
| Climate data for Sagbayan, Bohol | |||||||||||||
|---|---|---|---|---|---|---|---|---|---|---|---|---|---|
| Month | Jan | Feb | Mar | Apr | May | Jun | Jul | Aug | Sep | Oct | Nov | Dec | Year |
| Mean daily maximum °C (°F) | 26 (79) |
27 (81) |
28 (82) |
29 (84) |
30 (86) |
29 (84) |
28 (82) |
29 (84) |
29 (84) |
28 (82) |
27 (81) |
27 (81) |
28 (83) |
| Mean daily minimum °C (°F) | 21 (70) |
21 (70) |
21 (70) |
22 (72) |
23 (73) |
23 (73) |
22 (72) |
22 (72) |
22 (72) |
22 (72) |
22 (72) |
22 (72) |
22 (72) |
| Average precipitation mm (inches) | 98 (3.9) |
82 (3.2) |
96 (3.8) |
71 (2.8) |
104 (4.1) |
129 (5.1) |
101 (4.0) |
94 (3.7) |
99 (3.9) |
135 (5.3) |
174 (6.9) |
143 (5.6) |
1,326 (52.3) |
| Average rainy days | 18.0 | 14.1 | 17.1 | 16.8 | 23.7 | 25.7 | 25.8 | 23.3 | 24.2 | 25.9 | 24.0 | 20.6 | 259.2 |
| Source: Meteoblue [12] | |||||||||||||
Demographics
| Year | Pop. | ±% p.a. |
|---|---|---|
| 1960 | 8,720 | — |
| 1970 | 10,822 | +2.18% |
| 1975 | 12,500 | +2.93% |
| 1980 | 12,703 | +0.32% |
| 1990 | 15,364 | +1.92% |
| 1995 | 16,488 | +1.33% |
| 2000 | 18,346 | +2.32% |
| 2007 | 19,399 | +0.77% |
| 2010 | 20,091 | +1.28% |
| 2015 | 22,339 | +2.04% |
| 2020 | 24,335 | +1.70% |
| Source: Philippine Statistics Authority[13][11][14][15] | ||
Economy
Poverty incidence of Sagbayan
10
20
30
40
50
60
2006
57.10 2009
48.78 2012
24.01 2015
23.90 2018
21.50 2021
25.05 Source: Philippine Statistics Authority[16][17][18][19][20][21][22][23] |
Gallery
-
 Municipal Building (totally destroyed in the 2013 earthquake)
 -
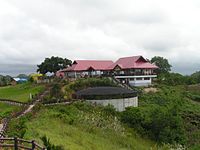 Sagbayan Peak
 -
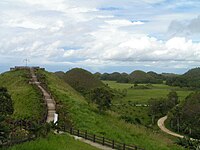 View of the Chocolate Hills from Sagbayan Peak


See also
References
- ^ Municipality of Sagbayan | (DILG)
- ^ "2015 Census of Population, Report No. 3 – Population, Land Area, and Population Density" (PDF). Philippine Statistics Authority. Quezon City, Philippines. August 2016. ISSN 0117-1453. Archived (PDF) from the original on May 25, 2021. Retrieved July 16, 2021.
- ^ a b c Census of Population (2020). "Region VII (Central Visayas)". Total Population by Province, City, Municipality and Barangay. Philippine Statistics Authority. Retrieved 8 July 2021.
- ^ "PSA Releases the 2021 City and Municipal Level Poverty Estimates". Philippine Statistics Authority. 2 April 2024. Retrieved 28 April 2024.
- ^ a b "Municipality of Sagbayan". Province of Bohol. Retrieved 2012-09-20.
- ^ "Best of Bohol Attractions". www.bohol-philippines.com. Retrieved 2019-02-21.
- ^ "Bohol Festivals Timetable". www.bohol-philippines.com. Retrieved 2019-04-01.
- ^ Executive Order No. 1949 (9 February 1949), Organizing certain barrios and sitios of the municipalities of Clarin, Inabanga and Balilihan, province of Bohol, into an independent municipality under the name of Borja
- ^ Republic Act No. 1741 (21 June 1957), An Act Changing the Name of the Municipality of Borja, Province of Bohol, to Sagbayan
- ^ "SitRep No. 35 re Effects of Magnitude 7.2 Sagbayan, Bohol Earthquake" (PDF). National Disaster Risk Reduction and Management Council. November 3, 2013. Retrieved November 7, 2013.
- ^ a b Census of Population and Housing (2010). "Region VII (Central Visayas)" (PDF). Total Population by Province, City, Municipality and Barangay. National Statistics Office. Retrieved 29 June 2016.
- ^ "Sagbayan: Average Temperatures and Rainfall". Meteoblue. Retrieved 9 May 2020.
- ^ Census of Population (2015). "Region VII (Central Visayas)". Total Population by Province, City, Municipality and Barangay. Philippine Statistics Authority. Retrieved 20 June 2016.
- ^ Censuses of Population (1903–2007). "Region VII (Central Visayas)". Table 1. Population Enumerated in Various Censuses by Province/Highly Urbanized City: 1903 to 2007. National Statistics Office.
- ^ "Province of Bohol". Municipality Population Data. Local Water Utilities Administration Research Division. Retrieved 17 December 2016.
- ^ "Poverty incidence (PI):". Philippine Statistics Authority. Retrieved December 28, 2020.
- ^ "Estimation of Local Poverty in the Philippines" (PDF). Philippine Statistics Authority. 29 November 2005.
- ^ "2003 City and Municipal Level Poverty Estimates" (PDF). Philippine Statistics Authority. 23 March 2009.
- ^ "City and Municipal Level Poverty Estimates; 2006 and 2009" (PDF). Philippine Statistics Authority. 3 August 2012.
- ^ "2012 Municipal and City Level Poverty Estimates" (PDF). Philippine Statistics Authority. 31 May 2016.
- ^ "Municipal and City Level Small Area Poverty Estimates; 2009, 2012 and 2015". Philippine Statistics Authority. 10 July 2019.
- ^ "PSA Releases the 2018 Municipal and City Level Poverty Estimates". Philippine Statistics Authority. 15 December 2021. Retrieved 22 January 2022.
- ^ "PSA Releases the 2021 City and Municipal Level Poverty Estimates". Philippine Statistics Authority. 2 April 2024. Retrieved 28 April 2024.
External links
- Philippine Standard Geographic Code
- Sagbayan
- Municipality of Sagbayan
- Sagbayan Peak Viewdeck - overlooking Chocolate hills