
User:DukeOfDelTaco/sandbox/Results of the 2012 United States presidential election
| This is not a Wikipedia article: This is a workpage, a collection of material and work in progress that may or may not be incorporated into an article. It should not necessarily be considered factual or authoritative. |
| |||||||||||||||||||||||||||||
538 members of the Electoral College 270 electoral votes needed to win | |||||||||||||||||||||||||||||
|---|---|---|---|---|---|---|---|---|---|---|---|---|---|---|---|---|---|---|---|---|---|---|---|---|---|---|---|---|---|
| |||||||||||||||||||||||||||||
| |||||||||||||||||||||||||||||
_4.jpg)

2012 U.S. presidential election | |
|---|---|
| Democratic Party | |
| Republican Party | |
| Related races | |
| |
This workpage details the results of the 2012 United States presidential election, which was the 57th quadrennial presidential election held on November 6, 2012. Incumbent Democratic president Barack Obama won re-election to a second term against Republican nominee Mitt Romney, the former governor of Massachusetts.
Obama won a majority of both the Electoral College and the popular vote. Obama was the first incumbent since Franklin D. Roosevelt in 1944 to win reelection with fewer electoral votes and a smaller popular vote margin than had been won in the previous election, and was also the first two-term president since Ronald Reagan to win both his presidential bids with a majority of the nationwide popular vote, and the first Democrat to do so since Franklin D. Roosevelt. This was also the first presidential election since 1944 in which neither the Republican nor the Democratic nominee had military experience.
Obama did not hold onto Indiana, North Carolina, or Nebraska's 2nd congressional district, but crucially won the "blue wall" states and defeated Romney in other swing states the Republicans had won in 2000 and 2004, most notably Colorado, Florida, Ohio, and Virginia. Ultimately, of the nine swing states identified by The Washington Post in the 2012 election, Obama won eight, losing only North Carolina. This is the most recent presidential election when the Democratic candidate won the states of Iowa, Ohio, and Florida, along with Maine's 2nd congressional district.
This was the first election in which a major party nominee lost his home state since Al Gore lost Tennessee in 2000, as Mitt Romney lost his home state of Massachusetts.
Overview[edit]
-

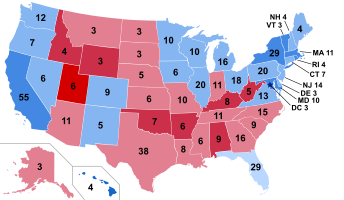
Presidential election results map. Blue denotes those won by Obama/Biden and red denotes states won by Romney/Paul. Numbers indicate electoral votes cast by each state and the District of Columbia. -
 Results by state, shaded according to winning candidate's percentage of the vote.
 -
 Results by county, shaded according to winning candidate's percentage of the vote.
 -
 Change in popular vote margins at the county level from the 2008 election to the 2012 election. Blue denotes counties that voted more Democratic. Red denotes counties that voted more Republican. Romney's strongest improvements over McCain were in Utah and Appalachia, while Obama's strongest gains were in Alaska, the New York area, and the Gulf states.


Results[edit]
| 332 | 206 |
| Barack Obama | Mitt Romney |
| Presidential candidate | Party | Home state | Popular vote | Electoral vote |
Running mate | |||
|---|---|---|---|---|---|---|---|---|
| Count | Percentage | Vice-presidential candidate | Home state | Electoral vote | ||||
| Barack Obama | Democratic | Illinois | 65,915,795 | 51.06% | 332 | Joe Biden | Delaware | 332 |
| Mitt Romney | Republican | Massachusetts | 60,933,504 | 47.20% | 206 | Paul Ryan | Wisconsin | 206 |
| Gary Johnson | Libertarian | New Mexico | 1,275,971 | 0.99% | 0 | Jim Gray | California | 0 |
| Jill Stein | Green | Massachusetts | 469,627 | 0.36% | 0 | Cheri Honkala | Minnesota | 0 |
| Virgil Goode | Constitution | Virginia | 122,389 | 0.09% | 0 | Jim Clymer | Pennsylvania | 0 |
| Roseanne Barr | Peace and Freedom | Utah | 67,326 | 0.05% | 0 | Cindy Sheehan | California | 0 |
| Rocky Anderson | Justice | Utah | 43,018 | 0.03% | 0 | Luis J. Rodriguez | California | 0 |
| Tom Hoefling | American Independent | Iowa | 40,628 | 0.03% | 0 | Jonathan D. Ellis | Tennessee | 0 |
| Randall Terry | Independent | West Virginia | 13,107 | 0.01% | 0 | Marjorie Smith | – | 0 |
| Richard Duncan | Independent | Ohio | 12,557 | 0.01% | 0 | Ricky Johnson | Pennsylvania | 0 |
| Peta Lindsay | Socialism and Liberation | Pennsylvania | 7,791 | 0.01% | 0 | Yari Osorio | – | 0 |
| Other | 183,697 | 0.14% | — | Other | — | |||
| Total | 129,085,410 | 100% | 538 | 538 | ||||
| Needed to win | 270 | 270 | ||||||
Summary table[edit]
State or
district |
Barack Obama Democratic |
Mitt Romney Republican |
Gary Johnson Libertarian |
Jill Stein Green |
Others | Margin | Margin swing |
Total votes | |||||||||||
|---|---|---|---|---|---|---|---|---|---|---|---|---|---|---|---|---|---|---|---|
| Votes | % | EV
|
Votes | % | EV
|
Votes | % | EV
|
Votes | % | EV
|
Votes | % | EV
|
Votes | % | % | ||
| Alabama | 795,696 | 38.36% | – | 1,255,925 | 60.55% | 9 | 12,328 | 0.59% | – | 3,397 | 0.16% | – | 6,992 | 0.34% | – | -460,229 | -22.19% | -0.61% | 2,074,338 |
| Alaska | 122,640 | 40.81% | – | 164,676 | 54.80% | 3 | 7,392 | 2.46% | – | 2,917 | 0.97% | – | 2,870 | 0.96% | – | -42,036 | -13.99% | 7.54% | 300,495 |
| Arizona | 1,025,232 | 44.59% | – | 1,233,654 | 53.65% | 11 | 32,100 | 1.40% | – | 7,816 | 0.34% | – | 452 | 0.02% | – | -208,422 | -9.06% | -0.54% | 2,299,254 |
| Arkansas | 394,409 | 36.88% | – | 647,744 | 60.57% | 6 | 16,276 | 1.52% | – | 9,305 | 0.87% | – | 1,734 | 0.16% | – | -253,335 | -23.69% | -3.84% | 1,069,468 |
| California | 7,854,285 | 60.24% | 55 | 4,839,958 | 37.12% | – | 143,221 | 1.10% | – | 85,638 | 0.66% | – | 115,445 | 0.88% | – | 3,014,327 | 23.12% | -0.94% | 13,038,547 |
| Colorado | 1,323,102 | 51.49% | 9 | 1,185,243 | 46.13% | – | 35,545 | 1.38% | – | 7,508 | 0.29% | – | 18,124 | 0.70% | – | 137,859 | 5.36% | -3.59% | 2,569,522 |
| Connecticut | 905,083 | 58.06% | 7 | 634,892 | 40.73% | – | 12,580 | 0.81% | – | 863 | 0.06% | – | 5,542 | 0.35% | – | 270,191 | 17.33% | -5.04% | 1,558,960 |
| Delaware | 242,584 | 58.61% | 3 | 165,484 | 39.98% | – | 3,882 | 0.94% | – | 1,940 | 0.47% | – | 31 | 0.01% | – | 77,100 | 18.63% | -6.37% | 413,921 |
| D.C. | 267,070 | 90.91% | 3 | 21,381 | 7.28% | – | 2,083 | 0.71% | – | 2,458 | 0.84% | – | 772 | 0.26% | – | 245,689 | 83.63% | -2.29% | 293,764 |
| Florida | 4,237,756 | 50.01% | 29 | 4,163,447 | 49.13% | – | 44,726 | 0.53% | – | 8,947 | 0.11% | – | 19,303 | 0.23% | – | 74,309 | 0.88% | -1.94% | 8,474,179 |
| Georgia | 1,773,827 | 45.48% | – | 2,078,688 | 53.30% | 16 | 45,324 | 1.16% | – | 1,516 | 0.04% | – | 695 | 0.02% | – | -304,861 | -7.82% | -2.61% | 3,900,050 |
| Hawaii | 306,658 | 70.55% | 4 | 121,015 | 27.84% | – | 3,840 | 0.88% | – | 3,184 | 0.73% | – | – | – | – | 185,643 | 42.71% | -2.55% | 434,697 |
| Idaho | 212,787 | 32.62% | – | 420,911 | 64.53% | 4 | 9,453 | 1.45% | – | 4,402 | 0.67% | – | 4,721 | 0.72% | – | -208,124 | -31.91% | -6.48% | 652,274 |
| Illinois | 3,019,512 | 57.60% | 20 | 2,135,216 | 40.73% | – | 56,229 | 1.07% | – | 30,222 | 0.58% | – | 835 | 0.02% | – | 884,296 | 16.87% | -8.27% | 5,242,014 |
| Indiana | 1,152,887 | 43.93% | – | 1,420,543 | 54.13% | 11 | 50,111 | 1.91% | – | 625 | 0.02% | – | 368 | 0.01% | – | -267,656 | -10.20% | -11.23% | 2,624,534 |
| Iowa | 822,544 | 51.99% | 6 | 730,617 | 46.18% | – | 12,926 | 0.82% | – | 3,769 | 0.24% | – | 12,324 | 0.78% | – | 91,927 | 5.81% | -3.72% | 1,582,180 |
| Kansas | 440,726 | 37.99% | – | 692,634 | 59.71% | 6 | 20,456 | 1.76% | – | 714 | 0.06% | – | 5,441 | 0.47% | – | -251,908 | -21.72% | -6.76% | 1,159,971 |
| Kentucky | 679,370 | 37.80% | – | 1,087,190 | 60.49% | 8 | 17,063 | 0.95% | – | 6,337 | 0.35% | – | 7,252 | 0.40% | – | -407,820 | -22.69% | -6.56% | 1,797,212 |
| Louisiana | 809,141 | 40.58% | – | 1,152,262 | 57.78% | 8 | 18,157 | 0.91% | – | 6,978 | 0.35% | – | 7,527 | 0.38% | – | -343,121 | -17.21% | 1.42% | 1,994,065 |
| Maine | 401,306 | 56.27% | 4 | 292,276 | 40.98% | – | 9,352 | 1.31% | – | 8,119 | 1.14% | – | 2,127 | 0.30% | – | 109,030 | 15.29% | -2.03% | 713,180 |
| Maryland | 1,677,844 | 61.97% | 10 | 971,869 | 35.90% | – | 30,195 | 1.12% | – | 17,110 | 0.63% | – | 10,309 | 0.38% | – | 705,975 | 26.08% | 0.64% | 2,707,327 |
| Massachusetts | 1,921,290 | 60.65% | 11 | 1,188,314 | 37.51% | – | 30,920 | 0.98% | – | 20,691 | 0.65% | – | 6,552 | 0.21% | – | 732,976 | 23.14% | -2.67% | 3,167,767 |
| Michigan | 2,564,569 | 54.21% | 16 | 2,115,256 | 44.71% | – | 7,774 | 0.16% | – | 21,897 | 0.46% | – | 21,465 | 0.45% | – | 449,313 | 9.50% | -6.97% | 4,730,961 |
| Minnesota | 1,546,167 | 52.65% | 10 | 1,320,225 | 44.96% | – | 35,098 | 1.20% | – | 13,023 | 0.44% | – | 22,048 | 0.75% | – | 225,942 | 7.69% | -2.55% | 2,936,561 |
| Mississippi | 562,949 | 43.79% | – | 710,746 | 55.29% | 6 | 6,676 | 0.52% | – | 1,588 | 0.12% | – | 3,625 | 0.28% | – | -147,797 | -11.50% | 1.67% | 1,285,584 |
| Missouri | 1,223,796 | 44.38% | – | 1,482,440 | 53.76% | 10 | 43,151 | 1.56% | – | – | – | – | 7,936 | 0.29% | – | -258,644 | -9.38% | -9.25% | 2,757,323 |
| Montana | 201,839 | 41.70% | – | 267,928 | 55.35% | 3 | 14,165 | 2.93% | – | – | – | – | 116 | 0.02% | – | -66,089 | -13.65% | -11.39% | 484,048 |
| Nebraska | 302,081 | 38.03% | – | 475,064 | 59.80% | 5 | 11,109 | 1.40% | – | – | – | – | 6,125 | 0.77% | – | -172,983 | -21.78% | -6.85% | 794,379 |
| Nevada | 531,373 | 52.36% | 6 | 463,567 | 45.68% | – | 10,968 | 1.08% | – | – | – | – | 9,010 | 0.89% | – | 67,806 | 6.68% | -5.81% | 1,014,918 |
| New Hampshire | 369,561 | 51.98% | 4 | 329,918 | 46.40% | – | 8,212 | 1.16% | – | 324 | 0.05% | – | 2,957 | 0.42% | – | 39,643 | 5.58% | -4.02% | 710,972 |
| New Jersey | 2,125,101 | 58.38% | 14 | 1,477,568 | 40.59% | – | 21,045 | 0.58% | – | 9,888 | 0.27% | – | 6,690 | 0.18% | – | 647,533 | 17.79% | 2.22% | 3,640,292 |
| New Mexico | 415,335 | 52.99% | 5 | 335,788 | 42.84% | – | 27,788 | 3.55% | – | 2,691 | 0.34% | – | 2,156 | 0.27% | – | 79,547 | 10.15% | -4.98% | 783,758 |
| New York | 4,485,741 | 63.35% | 29 | 2,490,431 | 35.17% | – | 47,256 | 0.67% | – | 39,982 | 0.56% | – | 17,749 | 0.25% | – | 1,995,310 | 28.18% | 1.32% | 7,081,159 |
| North Carolina | 2,178,391 | 48.35% | – | 2,270,395 | 50.39% | 15 | 44,515 | 0.99% | – | – | – | – | 12,071 | 0.27% | – | -92,004 | -2.04% | -2.37% | 4,505,372 |
| North Dakota | 124,827 | 38.69% | – | 188,163 | 58.32% | 3 | 5,231 | 1.62% | – | 1,361 | 0.42% | – | 3,045 | 0.94% | – | -63,336 | -19.63% | -11.00% | 322,627 |
| Ohio | 2,827,709 | 50.67% | 18 | 2,661,437 | 47.69% | – | 49,493 | 0.89% | – | 18,573 | 0.33% | – | 23,635 | 0.42% | – | 166,272 | 2.98% | -1.61% | 5,580,847 |
| Oklahoma | 443,547 | 33.23% | – | 891,325 | 66.77% | 7 | – | – | – | – | – | – | – | – | – | -447,778 | -33.54% | -2.25% | 1,334,872 |
| Oregon | 970,488 | 54.24% | 7 | 754,175 | 42.15% | – | 24,089 | 1.35% | – | 19,427 | 1.09% | – | 21,091 | 1.18% | – | 216,313 | 12.09% | -4.26% | 1,789,270 |
| Pennsylvania | 2,990,274 | 51.97% | 20 | 2,680,434 | 46.59% | – | 49,991 | 0.87% | – | 21,341 | 0.37% | – | 11,630 | 0.20% | – | 309,840 | 5.38% | -4.94% | 5,753,670 |
| Rhode Island | 279,677 | 62.70% | 4 | 157,204 | 35.24% | – | 4,388 | 0.98% | – | 2,421 | 0.54% | – | 2,359 | 0.53% | – | 122,473 | 27.46% | -0.35% | 446,049 |
| South Carolina | 865,941 | 44.09% | – | 1,071,645 | 54.56% | 9 | 16,321 | 0.83% | – | 5,446 | 0.28% | – | 4,765 | 0.24% | – | -205,704 | -10.47% | -1.49% | 1,964,118 |
| South Dakota | 145,039 | 39.87% | – | 210,610 | 57.89% | 3 | 5,795 | 1.59% | – | – | – | – | 2,371 | 0.65% | – | -65,571 | -18.02% | -9.61% | 363,815 |
| Tennessee | 960,709 | 39.08% | – | 1,462,330 | 59.48% | 11 | 18,623 | 0.76% | – | 6,515 | 0.26% | – | 10,400 | 0.42% | – | -501,621 | -20.40% | -5.33% | 2,458,577 |
| Texas | 3,308,124 | 41.38% | – | 4,569,843 | 57.17% | 38 | 88,580 | 1.11% | – | 24,657 | 0.31% | – | 2,647 | 0.03% | – | -1,261,719 | -15.78% | -4.01% | 7,993,851 |
| Utah | 251,813 | 24.75% | – | 740,600 | 72.79% | 6 | 12,572 | 1.24% | – | 3,817 | 0.38% | – | 8,638 | 0.85% | – | -488,787 | -48.04% | -19.86% | 1,017,440 |
| Vermont | 199,239 | 66.57% | 3 | 92,698 | 30.97% | – | 3,487 | 1.17% | – | 594 | 0.20% | – | 3,272 | 1.09% | – | 106,541 | 35.60% | -1.41% | 299,290 |
| Virginia | 1,971,820 | 51.16% | 13 | 1,822,522 | 47.28% | – | 31,216 | 0.81% | – | 8,627 | 0.22% | – | 20,304 | 0.53% | – | 149,298 | 3.87% | -2.43% | 3,854,489 |
| Washington | 1,755,396 | 56.16% | 12 | 1,290,670 | 41.29% | – | 42,202 | 1.35% | – | 20,928 | 0.67% | – | 16,320 | 0.52% | – | 464,726 | 14.87% | -2.31% | 3,125,516 |
| West Virginia | 238,269 | 35.54% | – | 417,655 | 62.30% | 5 | 6,302 | 0.94% | – | 4,406 | 0.66% | – | 3,806 | 0.57% | – | -179,386 | -26.76% | -13.64% | 670,438 |
| Wisconsin | 1,620,985 | 52.83% | 10 | 1,407,966 | 45.89% | – | 20,439 | 0.67% | – | 7,665 | 0.25% | – | 11,379 | 0.37% | – | 213,019 | 6.94% | -6.96% | 3,068,434 |
| Wyoming | 69,286 | 27.82% | – | 170,962 | 68.64% | 3 | 5,326 | 2.14% | – | – | – | – | 3,487 | 1.40% | – | -101,676 | -40.82% | -8.59% | 249,061 |
| Total | 65,915,795 | 51.06% | 332 | 60,933,504 | 47.20% | 206 | 1,275,971 | 0.99% | – | 469,627 | 0.36% | – | 490,513 | 0.38% | – | 4,982,291 | 3.86% | -3.41% | 129,085,410 |
| Barack Obama Democratic |
Mitt Romney Republican |
Gary Johnson Libertarian |
Jill Stein Green |
Others | Margin | Margin swing |
Total votes | ||||||||||||
Close states[edit]
States where the margin of victory was under 1% (29 electoral votes):
- Florida, 0.88% (74,309 votes)
States where the margin of victory was under 5% (46 electoral votes):
- North Carolina, 2.04% (92,004 votes)
- Ohio, 2.98% (166,272 votes)
- Virginia, 3.87% (149,298 votes)
States where the margin of victory was under 10% (117 electoral votes):
- Colorado, 5.36% (137,859 votes)
- Pennsylvania, 5.38% (309,840 votes)
- New Hampshire, 5.58% (39,643 votes)
- Iowa, 5.81% (91,927 votes)
- Nevada, 6.68% (67,806 votes)
- Wisconsin, 6.94% (213,019 votes)
- Minnesota, 7.69% (225,942 votes)
- Georgia, 7.82% (304,861 votes)
- Arizona, 9.06% (208,422 votes)
- Missouri, 9.38% (258,644 votes)
- Michigan, 9.50% (449,313 votes)
Results by state[edit]
Alabama[edit]

- Romney: 50–60% 60–70% 70–80% 80–90%
- Obama: 50–60% 60–70% 70–80% 80–90%
| Party | Candidate | Votes | % | ±% | |
|---|---|---|---|---|---|
| Republican | Mitt Romney | 1,255,925 | 60.55% | ||
| Democratic | Barack Obama (incumbent) | 795,696 | 38.36% | ||
| Independent | Gary Johnson | 12,328 | 0.59% | ||
| Independent | Jill Stein | 3,397 | 0.16% | N/A | |
| Independent | Virgil Goode | 2,981 | 0.14% | ||
| Write-in | 4,011 | 0.19% | |||
| Margin of victory | 460,229 | 22.19% | |||
| Turnout | 2,074,338 | 69.66% | |||
| Registered electors | 2,977,718 | ||||
| Republican win | |||||
Arizona[edit]

- Romney: 50–60% 60–70%
- Obama: 50–60% 60–70%
| Party | Candidate | Votes | % | ±% | |
|---|---|---|---|---|---|
| Republican | Mitt Romney | 1,233,654 | 53.48% | ||
| Democratic | Barack Obama (incumbent) | 1,025,232 | 44.45% | ||
| Libertarian | Gary Johnson | 32,100 | 1.39% | ||
| Green | Jill Stein | 7,816 | 0.34% | ||
| Write-in | 452 | 0.02% | |||
| Margin of victory | 208,422 | 9.06% | |||
| Turnout | 2,299,254 | 73.58% | |||
| Registered electors | 3,124,712 | ||||
| Republican win | |||||
Colorado[edit]

- Obama: 40–50% 50–60% 60–70% 70–80%
- Romney: 50–60% 60–70% 70–80% 80–90%
- Democratic: Chaffee
| Party | Candidate | Votes | % | ±% | |
|---|---|---|---|---|---|
| Democratic | Barack Obama (incumbent) | 1,323,102 | 51.45% | ||
| Republican | Mitt Romney | 1,185,243 | 46.09% | ||
| Libertarian | Gary Johnson | 35,545 | 1.38% | ||
| Green | Jill Stein | 7,508 | 0.29% | ||
| American Constitution | Virgil Goode | 6,234 | 0.24% | ||
| Peace and Freedom | Roseanne Barr | 5,059 | 0.20% | N/A | |
| Independent | Jill Ann Reed | 2,589 | 0.10% | N/A | |
| Justice | Rocky Anderson | 1,260 | 0.05% | N/A | |
| We the People | Sheila Tittle | 792 | 0.03% | N/A | |
| America's | Tom Hoefling | 679 | 0.03% | N/A | |
| Socialism and Liberation | Peta Lindsay | 317 | 0.01% | ||
| Socialist | Stewart Alexander | 308 | 0.01% | ||
| American Freedom | Merlin Miller | 266 | 0.01% | N/A | |
| Objectivist | Tom Stevens | 235 | 0.01% | ||
| Socialist Workers | James Harris | 192 | 0.01% | ||
| Socialist Equality | Jerry White | 189 | 0.01% | N/A | |
| Write-in | 4 | 0.09% | |||
| Margin of victory | 137,859 | 5.36% | |||
| Turnout | 2,569,522 | 70.38% | |||
| Registered electors | 3,651,137 | ||||
| Democratic win | |||||
Delaware[edit]

- Obama: 50–60% 60–70%
- Romney: 50–60%
| Party | Candidate | Votes | % | ±% | |
|---|---|---|---|---|---|
| Democratic | Barack Obama (incumbent) | 242,584 | 58.61% | ||
| Republican | Mitt Romney | 165,484 | 39.98% | ||
| Libertarian | Gary Johnson | 3,882 | 0.94% | ||
| Green | Jill Stein | 1,940 | 0.47% | ||
| Write-in | 31 | 0.01% | |||
| Margin of victory | 77,100 | 18.63% | |||
| Turnout | 413,921 | 65.47% | |||
| Registered electors | 632,261 | ||||
| Democratic win | |||||
Hawaii[edit]

- Obama: 60–70% 70–80%
| Party | Candidate | Votes | % | ±% | |
|---|---|---|---|---|---|
| Democratic | Barack Obama (incumbent) | 306,658 | 70.55% | ||
| Republican | Mitt Romney | 121,015 | 27.84% | ||
| Libertarian | Gary Johnson | 3,840 | 0.88% | ||
| Green | Jill Stein | 3,184 | 0.73% | ||
| Margin of victory | 185,643 | 42.71% | |||
| Turnout | 434,697 | 61.60% | |||
| Registered electors | 705,668 | ||||
| Democratic win | |||||
Illinois[edit]

- Obama: 40–50% 50–60% 60–70% 70–80%
- Romney: 40–50% 50–60% 60–70% 70–80%
| Party | Candidate | Votes | % | ±% | |
|---|---|---|---|---|---|
| Democratic | Barack Obama (incumbent) | 3,019,512 | 57.60% | ||
| Republican | Mitt Romney | 2,135,216 | 40.73% | ||
| Libertarian | Gary Johnson | 56,229 | 1.07% | ||
| Green | Jill Stein | 30,222 | 0.58% | ||
| Write-in | 835 | 0.02% | |||
| Margin of victory | 884,296 | 16.87% | |||
| Turnout | 5,242,014 | N/A | |||
| Registered electors | |||||
| Democratic win | |||||
Kansas[edit]

- Romney: 40–50% 50–60% 60–70% 70–80% 80–90% 90–100%
- Obama: 60–70%
- Republican: Crawford
| Party | Candidate | Votes | % | ±% | |
|---|---|---|---|---|---|
| Republican | Mitt Romney | 692,634 | 59.71% | ||
| Democratic | Barack Obama (incumbent) | 440,726 | 37.99% | ||
| Libertarian | Gary Johnson | 20,456 | 1.76% | ||
| Reform | Chuck Baldwin | 5,017 | 0.43% | ||
| Write-in | 1,138 | 0.10% | |||
| Margin of victory | 249,901 | 21.54% | |||
| Turnout | 1,159,971 | 65.49% | N/A | ||
| Registered electors | 1,771,252 | ||||
| Republican win | |||||
Louisiana[edit]

- Romney: 50–60% 60–70% 70–80% 80–90%
- Obama: 50–60% 60–70% 80–90%
| Party | Candidate | Votes | % | ±% | |
|---|---|---|---|---|---|
| Republican | Mitt Romney | 1,152,262 | 57.78% | ||
| Democratic | Barack Obama (incumbent) | 809,141 | 40.58% | ||
| Libertarian | Gary Johnson | 18,157 | 0.91% | N/A | |
| Green | Jill Stein | 6,978 | 0.35% | ||
| Constitution | Virgil Goode | 2,508 | 0.13% | ||
| We the People | Sheila Tittle | 1,767 | 0.09% | N/A | |
| Justice | Rocky Anderson | 1,368 | 0.07% | N/A | |
| Socialism and Liberation | Peta Lindsay | 622 | 0.03% | ||
| Prohibition | Jack Fellure | 518 | 0.03% | ||
| Socialist Workers | James Harris | 389 | 0.02% | ||
| Socialist Equality | Jerry White | 355 | 0.02% | N/A | |
| Margin of victory | 343,121 | 17.21% | |||
| Turnout | 1,994,065 | 67.30% | |||
| Registered electors | 2,962,999 | ||||
| Republican win | |||||
Massachusetts[edit]

- Obama: 50–60% 60–70% 70–80%
| Party | Candidate | Votes | % | ±% | |
|---|---|---|---|---|---|
| Democratic | Barack Obama (incumbent) | 1,921,290 | 60.65% | ||
| Republican | Mitt Romney | 1,188,314 | 37.51% | ||
| Libertarian | Gary Johnson | 30,920 | 0.98% | ||
| Green-Rainbow | Jill Stein | 20,691 | 0.65% | ||
| Write-in | 6,552 | 0.21% | |||
| Margin of victory | 732,976 | 23.14% | |||
| Turnout | 3,167,767 | 72.94% | |||
| Registered electors | 4,342,841 | ||||
| Democratic win | |||||
Montana[edit]

- Romney: 50–60% 60–70% 70–80% 80–90%
- Obama: 40–50% 50–60% 60–70%
- Republican: Cascade, Gallatin, Lake, Lewis and Clark, Rosebud
| Party | Candidate | Votes | % | ±% | |
|---|---|---|---|---|---|
| Republican | Mitt Romney | 267,928 | 55.35% | ||
| Democratic | Barack Obama (incumbent) | 201,839 | 41.70% | ||
| Libertarian | Gary Johnson | 14,165 | 2.93% | ||
| Write-in | 116 | 0.02% | |||
| Margin of victory | 66,089 | 13.65% | |||
| Turnout | 484,048 | 71.08% | |||
| Registered electors | 681,608 | ||||
| Republican win | |||||
Nevada[edit]

- Obama: 50–60%
- Romney: 50–60%60–70%70–80%80–90%
- Republican: Carson City
| Party | Candidate | Votes | % | ±% | |
|---|---|---|---|---|---|
| Democratic | Barack Obama (incumbent) | 531,373 | 52.36% | ||
| Republican | Mitt Romney | 463,567 | 45.68% | ||
| Libertarian | Gary Johnson | 10,968 | 1.08% | ||
| None of These Candidates | 5,770 | 0.57% | |||
| Independent American Party (Nevada) | Virgil Goode | 3,240 | 0.32% | ||
| Margin of victory | 67,806 | 6.68% | |||
| Turnout | 1,014,918 | 67.62% | |||
| Registered electors | 1,500,818 | ||||
| Democratic win | |||||
New Mexico[edit]

- Obama: 40–50% 50–60% 60–70% 70–80%
- Romney: 40–50% 50–60% 60–70% 70–80%
- Republican: Luna
| Party | Candidate | Votes | % | ±% | |
|---|---|---|---|---|---|
| Democratic | Barack Obama (incumbent) | 415,335 | 52.99% | ||
| Republican | Mitt Romney | 335,788 | 42.84% | ||
| Libertarian | Gary Johnson | 27,788 | 3.55% | ||
| Green | Jill Stein | 2,691 | 0.34% | ||
| Justice | Rocky Anderson | 1,174 | 0.15% | N/A | |
| Constitution | Virgil Goode | 982 | 0.13% | ||
| Margin of victory | 79,547 | 10.15% | |||
| Turnout | 783,758 | 62.44% | |||
| Registered electors | 1,255,273 | ||||
| Democratic win | |||||
Oklahoma[edit]

- Romney: 50–60% 60–70% 70–80% 80–90% 90–100%
| Party | Candidate | Votes | % | ±% | |
|---|---|---|---|---|---|
| Republican | Mitt Romney | 891,325 | 66.77% | ||
| Democratic | Barack Obama (incumbent) | 443,547 | 33.23% | ||
| Margin of victory | 447,778 | 33.54% | |||
| Turnout | 1,334,872 | 63.12% | |||
| Registered electors | 2,114,713 | ||||
| Republican win | |||||
South Dakota[edit]

- Romney: 40–50% 50–60% 60–70% 70–80% 80–90%
- Obama: 50–60% 60–70% 70–80% 90–100%
| Party | Candidate | Votes | % | ±% | |
|---|---|---|---|---|---|
| Republican | Mitt Romney | 210,610 | 57.89% | ||
| Democratic | Barack Obama (incumbent) | 145,039 | 39.87% | ||
| Libertarian | Gary Johnson | 5,795 | 1.59% | ||
| Constitution | Virgil Goode | 2,371 | 0.65% | ||
| Margin of victory | 65,571 | 18.02% | |||
| Turnout | 363,815 | 62.54% | |||
| Registered electors | 581,753 | ||||
| Republican win | |||||
Virginia[edit]

- Obama: 40–50%50–60%60–70%70–80%80–90%
- Romney: 40–50%50–60%60–70%70–80%
- Republican: King and Queen, Montgomery
| Party | Candidate | Votes | % | ±% | |
|---|---|---|---|---|---|
| Democratic | Barack Obama (incumbent) | 1,971,820 | 51.16% | ||
| Republican | Mitt Romney | 1,822,522 | 47.28% | ||
| Libertarian | Gary Johnson | 31,216 | 0.81% | ||
| Constitution | Virgil Goode | 13,058 | 0.34% | ||
| Green | Jill Stein | 8,627 | 0.22% | ||
| Write-in | 7,246 | 0.19% | |||
| Margin of victory | 149,298 | 3.87% | |||
| Turnout | 3,854,489 | 71.00% | |||
| Registered electors | 5,428,833 | ||||
| Democratic win | |||||
See also[edit]
References[edit]
- ^ https://www.sos.la.gov/ElectionsAndVoting/Pages/RegistrationStatisticsStatewide.aspx
- ^ "Voter Registration Statistics". Nevada Secretary of State.