Rong'an County
Rong'an County
融安县 · Yungz'anh Yen Jungan | |
|---|---|
| Coordinates: 25°13′26″N 109°23′56″E / 25.224°N 109.399°E[1] | |
| Country | People's Republic of China |
| Autonomous region | Guangxi |
| Prefecture-level city | Liuzhou |
| Area | |
| • Total | 2,904 km2 (1,121 sq mi) |
| Population (2010)[3] | |
| • Total | 285,641 |
| • Density | 98/km2 (250/sq mi) |
| Time zone | UTC+8 (China Standard) |
| Postal code | 5454XX |
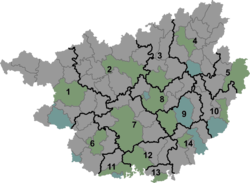
Rong'an County (simplified Chinese: 融安县; traditional Chinese: 融安縣; pinyin: Róng'ān Xiàn; Standard Zhuang: Yungz'anh Yen) is under the administration of Liuzhou, Guangxi Zhuang Autonomous Region, China. It borders the prefecture-level city of Guilin to the east.
Climate
| Climate data for Rong'an (1981−2010) | |||||||||||||
|---|---|---|---|---|---|---|---|---|---|---|---|---|---|
| Month | Jan | Feb | Mar | Apr | May | Jun | Jul | Aug | Sep | Oct | Nov | Dec | Year |
| Record high °C (°F) | 25.9 (78.6) |
30.0 (86.0) |
35.1 (95.2) |
35.7 (96.3) |
34.9 (94.8) |
37.0 (98.6) |
38.9 (102.0) |
38.0 (100.4) |
37.5 (99.5) |
35.5 (95.9) |
31.2 (88.2) |
27.0 (80.6) |
38.9 (102.0) |
| Mean daily maximum °C (°F) | 12.0 (53.6) |
14.0 (57.2) |
17.9 (64.2) |
23.7 (74.7) |
27.5 (81.5) |
30.1 (86.2) |
31.9 (89.4) |
32.6 (90.7) |
30.4 (86.7) |
25.6 (78.1) |
20.6 (69.1) |
15.3 (59.5) |
23.5 (74.2) |
| Daily mean °C (°F) | 7.9 (46.2) |
10.0 (50.0) |
13.6 (56.5) |
18.8 (65.8) |
22.6 (72.7) |
25.4 (77.7) |
26.8 (80.2) |
26.6 (79.9) |
24.1 (75.4) |
19.7 (67.5) |
14.8 (58.6) |
9.8 (49.6) |
18.3 (65.0) |
| Mean daily minimum °C (°F) | 5.2 (41.4) |
7.4 (45.3) |
10.6 (51.1) |
15.5 (59.9) |
19.1 (66.4) |
22.2 (72.0) |
23.5 (74.3) |
23.1 (73.6) |
20.3 (68.5) |
16.1 (61.0) |
11.1 (52.0) |
6.3 (43.3) |
15.0 (59.1) |
| Record low °C (°F) | −2.9 (26.8) |
−1.9 (28.6) |
−1.2 (29.8) |
4.2 (39.6) |
9.3 (48.7) |
12.5 (54.5) |
17.1 (62.8) |
17.6 (63.7) |
12.4 (54.3) |
4.1 (39.4) |
0.6 (33.1) |
−3.7 (25.3) |
−3.7 (25.3) |
| Average precipitation mm (inches) | 58.8 (2.31) |
80.0 (3.15) |
106.1 (4.18) |
151.7 (5.97) |
262.2 (10.32) |
282.2 (11.11) |
213.4 (8.40) |
150.6 (5.93) |
71.0 (2.80) |
66.2 (2.61) |
66.6 (2.62) |
41.6 (1.64) |
1,550.4 (61.04) |
| Average relative humidity (%) | 80 | 80 | 80 | 81 | 83 | 84 | 84 | 83 | 80 | 80 | 78 | 77 | 81 |
| Source: China Meteorological Data Service Center | |||||||||||||
References
- ^ Google (2014-07-02). "Rong'an" (Map). Google Maps. Google. Retrieved 2014-07-02.
- ^ Liuzhou City Land Use Plan (2006–20)/《柳州市土地利用总体规划(2006-2020年)》.(in Chinese) Accessed 8 July 2014.
- ^ 《中国2010年人口普查分县资料》 (in Chinese). 中国统计出版社. December 2012. ISBN 978-7-5037-6659-6.

