Foreign trade of South Africa
| Part of a series on |
| World trade |
|---|
 |

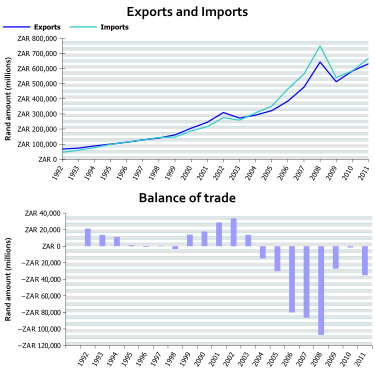
Since the end of apartheid foreign trade in South Africa has increased, following the lifting of several sanctions and boycotts which were imposed as a means of ending apartheid.
South Africa is the second largest producer of gold and is the world's largest producer of chrome, manganese, platinum, vanadium and vermiculite, the second largest producer of ilmenite, palladium, rutile and zirconium.[1] It is also the world's third largest coal exporter.[2] Although, mining only accounts for 3% of the GDP, down from around 14% in the 1980s.[3] South Africa also has a large agricultural sector and is a net exporter of farming products.
Principal international trading partners of South Africa—besides other African countries—include Germany, the United States, China, Japan, the United Kingdom and Spain.[4] Chief exports include corn, diamonds, fruits, gold, metals and minerals, sugar, and wool. Machinery and transportation equipment make up more than one-third of the value of the country’s imports. Other imports include chemicals, manufactured goods, and petroleum.
History
This section needs expansion. You can help by adding to it. (June 2011) |
During apartheid, South Africa's foreign trade and investment were affected by sanctions and boycotts by other countries ideologically opposed to apartheid. In 1970, the United Nations Security Council, adopted resolution 282 imposing a voluntary arms embargo upon South Africa, and which was extended by subsequent resolutions 418 and 591, declaring the embargo mandatory. In 1978, South Africa was prohibited loans from the Export-Import Bank of the United States which was later followed by a prohibition on IMF loans in 1983. An oil embargo was imposed by OPEC in 1983 which was strengthened by Iran in 1979.

Imports and exports
South Africa's main export trading partners are the European Union, the United States, Japan. China's share in exports is increasing, and has risen from 1.7% in 1994 to nearly 11% in 2007.[citation needed]
|
| ||||||||||||||||||||||||||||||||||||||||||||||||||||||
|
| ||||||||||||||||||||||||||||||||||||||||||||||||||||||
Attention: SARS presents completely different figures! http://www.sars.gov.za/home.asp?pid=211
African trade
Almost 90% of South Africa's exports to rest of Africa go to the SADC economies. In 2011, South Africa’s trade with the rest of Africa exceeded R220 billion (approx. USD30bn) which amounted to 17% of SA’s total trade with the world. This amounted to a ZAR40bn trade surplus for South Africa compared to a ZAR68bn deficit with Asia. South African exports to the rest of Africa are predominantly of value-added goods. The country's investment stock in Africa has increased from R14.7 billion in 2001 to R121 billion in 2010, amounting to 21% of its total outward Foreign Direct Investment.[7]
Trade agreements
The following includes a list of existing trade agreements signed by South Africa.
- The African Growth and Opportunity Act (AGOA)
 European Union: Trade Agreement between the European Union (EU) and South Africa
- The Southern African Development Community (SADC) Trade Agreement
- The Generalized System of Preferences
 Zimbabwe: Trade Agreement between Zimbabwe and South Africa
- Trade Agreement between Southern African Customs Union (SACU) and European Free Trade Association (EFTA) states
- Rules of Origin Guides / Trade Agreements
- Approved Exporter (SAEU, SACU EFTA)
Currently UAE is also one of the most important trade partners with African buyers/importers.
Proposed free trade agreements
- US-Southern African Customs Union Free Trade Agreement: (US-SAUC; incl.
 South Africa,
  Botswana,
  Lesotho,
  Eswatini, and
  Namibia; on hold since 2006 due to US demands on intellectual property rights, government procurement rights and investment)
- Cape to Cairo free trade area: In June 2011, South Africa and 25 other heads of state in Africa began negotiating the establishment of a free trade area (FTA) which would extend trade concessions beyond the Southern Africa Development Community, opening a trade pathway along the east coast of Africa to Egypt.[8][9] The FTA would include about half of Africa's countries but would not include the Economic Community of West African States.
See also
References
- ^ Mineral Commodity summaries
- ^ South Africa's coal future looks bright
- ^ South Africa, Jobless growth – The Economist
- ^ "South Africa". The World Factbook. CIA.
- ^ a b c d "South African EXPORT by Codes". Department of Trade and Industry. 2012. Retrieved 3 April 2012.
- ^ a b "Rand/US$ exchange value in July 2011". Retrieved 4 April 2012.
- ^ Simon Freemantle & Jeremy Stevens (12 June 2012). "EM10 and Africa: South Africa in Africa - a steady, yet narrow, ascent". Standard Bank. Retrieved 13 June 2012.
- ^ "SA hosts 26 heads of state for 'Cape to Cairo' free trade area". Independent Online. 10 June 2011. Retrieved 10 June 2011.
- ^ "Free trade zone envisioned from Egypt to South Africa, Angola across to Madagascar". Washington Post. 10 June 2011. Retrieved 10 June 2011.

