
North Lincolnshire Council elections
North Lincolnshire Council is the local authority for the unitary authority of North Lincolnshire in Lincolnshire, England. It was created on 1 April 1996 replacing Glanford, Scunthorpe, part of Boothferry and Humberside County Council.
Council elections
[edit]- 1995 North Lincolnshire Council election
- 1999 North Lincolnshire Council election
- 2003 North Lincolnshire Council election (New ward boundaries)[1]
- 2007 North Lincolnshire Council election
- 2011 North Lincolnshire Council election
- 2015 North Lincolnshire Council election
- 2019 North Lincolnshire Council election
- 2023 North Lincolnshire Council election (New ward boundaries)[2]
Election results
[edit]| Overall control | Conservative | Labour | Lib Dems | Independent | |||||
| 2023 | Conservative | 27 | 16 | 0 | 0 | ||||
| 2019 | Conservative | 27 | 16 | 0 | 0 | ||||
| 2015 | Conservative | 26 | 17 | 0 | 0 | ||||
| 2011 | Conservative | 23 | 20 | 0 | 0 | ||||
| 2007 | Labour | 19 | 22 | 1 | 1 | ||||
| 2003 | Conservative | 22 | 21 | 0 | 0 | ||||
District result maps
[edit]-
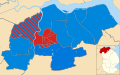 2011 results map
 -
 2015 results map
 -
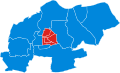 2019 results map
 -
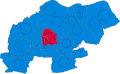 2023 results map


By-election results
[edit]1995–1999
[edit]| Party | Candidate | Votes | % | ±% | |
|---|---|---|---|---|---|
| Labour | 889 | 72.4 | −11.7 | ||
| Conservative | 252 | 20.5 | +4.6 | ||
| Liberal Democrats | 87 | 7.1 | +7.1 | ||
| Majority | 637 | 51.9 | |||
| Turnout | 1,228 | 15.6 | |||
| Labour hold | Swing | ||||
1999–2003
[edit]| Party | Candidate | Votes | % | ±% | |
|---|---|---|---|---|---|
| Conservative | Tracy Muir | 854 | 52.0 | −0.7 | |
| Labour | David Oldfield | 631 | 38.5 | −8.8 | |
| Independent | Frank Bottamley | 156 | 9.5 | +9.5 | |
| Majority | 223 | 13.5 | |||
| Turnout | 1,641 | 31.5 | |||
| Conservative hold | Swing | ||||
2003–2007
[edit]| Party | Candidate | Votes | % | ±% | |
|---|---|---|---|---|---|
| Conservative | Ivan Glover | 891 | 49.1 | +0.9 | |
| Labour | Ken Edgell | 790 | 43.6 | +2.3 | |
| Liberal Democrats | Val Margetts | 132 | 7.3 | −3.2 | |
| Majority | 101 | 5.5 | |||
| Turnout | 1,813 | 35.6 | |||
| Conservative hold | Swing | ||||
| Party | Candidate | Votes | % | ±% | |
|---|---|---|---|---|---|
| Labour | Christine O'Sullivan | 1,044 | 54.9 | −4.4 | |
| Liberal Democrats | Neil Poole | 414 | 21.8 | +8.8 | |
| Conservative | Michael Sykes | 258 | 13.5 | −1.1 | |
| BNP | Robert Bailey | 186 | 9.8 | +9.8 | |
| Majority | 630 | 33.1 | |||
| Turnout | 1,902 | 22.6 | |||
| Labour hold | Swing | ||||
| Party | Candidate | Votes | % | ±% | |
|---|---|---|---|---|---|
| Labour | Michael Collinson | 1,151 | 68.0 | +14.7 | |
| Conservative | Alec Readhead | 328 | 19.4 | −5.8 | |
| Liberal Democrats | John Thompson | 213 | 12.6 | −8.9 | |
| Majority | 823 | 48.6 | |||
| Turnout | 1,692 | 23.2 | |||
| Labour hold | Swing | ||||
| Party | Candidate | Votes | % | ±% | |
|---|---|---|---|---|---|
| Labour | Leonard Foster | 796 | 66.5 | +6.3 | |
| Conservative | Lawrence Chapman | 249 | 20.8 | −1.3 | |
| Liberal Democrats | Adrian Holmes | 152 | 12.7 | −5.0 | |
| Majority | 547 | 45.7 | |||
| Turnout | 1,197 | 14.3 | |||
| Labour hold | Swing | ||||
| Party | Candidate | Votes | % | ±% | |
|---|---|---|---|---|---|
| Conservative | Trevor Foster | 1,154 | 37.4 | −13.3 | |
| Liberal Democrats | Neil Poole | 1,102 | 35.7 | +9.1 | |
| Labour | Alan May | 656 | 21.3 | −1.5 | |
| Independent | Andrew Talliss | 175 | 5.7 | +5.7 | |
| Majority | 52 | 1.7 | |||
| Turnout | 3,087 | 31.5 | |||
| Conservative hold | Swing | ||||
2007–2011
[edit]| Party | Candidate | Votes | % | ±% | |
|---|---|---|---|---|---|
| Conservative | Paul Vickers | 1,576 | 64.35 | −0.52 | |
| Labour | Sue Turner | 653 | 26.66 | +6.18 | |
| Liberal Democrats | Richard Alan Nixon | 220 | 8.98 | +1.93 | |
| Majority | 873 | 35.65 | |||
| Turnout | 2,449 | ||||
| Conservative hold | Swing | ||||
2011–2015
[edit]| Party | Candidate | Votes | % | ±% | |
|---|---|---|---|---|---|
| Labour | Haque Kataria | 1,141 | 50.9 | +1.4 | |
| Conservative | Abdul Wadud | 956 | 42.7 | +5.3 | |
| BNP | Douglas Ward | 143 | 6.4 | +6.4 | |
| Majority | 185 | 8.3 | |||
| Turnout | 2,240 | ||||
| Labour hold | Swing | ||||
2015–2019
[edit]| Party | Candidate | Votes | % | ±% | |
|---|---|---|---|---|---|
| Labour | Stephen Swift | 2,428 | 56.5 | +3.2 | |
| Conservative | Janet Longcake | 1,356 | 31.5 | +31.5 | |
| UKIP | Dave Carswell | 270 | 6.3 | −28.7 | |
| Independent | Paul Elsom | 177 | 4.1 | +4.1 | |
| Independent | Graham Wagstaffe | 70 | 1.6 | +1.6 | |
| Majority | 1,072 | 24.9 | |||
| Turnout | 4,301 | ||||
| Labour hold | Swing | ||||
2019–2023
[edit]| Party | Candidate | Votes | % | ±% | |
|---|---|---|---|---|---|
| Conservative | Joanne Saunby | 1,137 | 50.8 | +19.1 | |
| Labour | Christopher Skinner | 980 | 43.8 | −24.5 | |
| Green | Peter Dennington | 119 | 5.3 | +5.3 | |
| Majority | 157 | 7.0 | |||
| Turnout | 2,236 | ||||
| Conservative gain from Labour | Swing | ||||
| Party | Candidate | Votes | % | ±% | |
|---|---|---|---|---|---|
| Conservative | Janet Longcake | 2,084 | 73.3 | +16.5 | |
| Labour | Glyn Williams | 1,088 | 26.7 | −16.5 | |
| Majority | 1,896 | 46.6 | |||
| Turnout | 4,072 | ||||
| Conservative hold | Swing | ||||
| Party | Candidate | Votes | % | ±% | |
|---|---|---|---|---|---|
| Conservative | Carol Ross | 1,217 | |||
| Conservative | Janet Lee | 1,141 | |||
| Labour | Graham Ladlow | 412 | |||
| Labour | Lucy Watson | 450 | |||
| Green | Jo Baker | 99 | |||
| Green | Amie Watson | 82 | |||
| For Britain | Mike Speakman | 34 | |||
| Turnout | 3353 | ||||
| Conservative hold | Swing | ||||
| Conservative hold | Swing | ||||
2023–2027
[edit]| Party | Candidate | Votes | % | ±% | |
|---|---|---|---|---|---|
| Conservative | Ian Bint | 901 | 66.9 | ||
| Labour | Lara Chaplin | 378 | 28.1 | ||
| Liberal Democrats | Alan Kelly | 67 | 5.0 | ||
| Majority | 523 | 38.9 | |||
| Turnout | 1,346 | ||||
| Conservative hold | Swing | ||||
| Party | Candidate | Votes | % | ±% | |
|---|---|---|---|---|---|
| Labour | Daniel Hart | 616 | 61.5 | ||
| Conservative | Alan Cook | 294 | 29.3 | ||
| Green | Peter Dennington | 49 | 4.9 | ||
| Liberal Democrats | Robin Abram | 43 | 4.3 | ||
| Majority | 322 | 32.1 | |||
| Turnout | 1,002 | ||||
| Labour hold | Swing | ||||
References
[edit]- ^ legislation.gov.uk – The Borough of North Lincolnshire (Electoral Changes) Order 2001. Retrieved on 4 October 2015.
- ^ "The North Lincolnshire (Electoral Changes) Order 2022". Legislation.gov.uk. Retrieved 17 February 2024.
- ^ "Local Elections Archive Project — Town Ward". www.andrewteale.me.uk. Retrieved 12 July 2023.
- ^ "Local Elections Archive Project — Brumby Ward". www.andrewteale.me.uk. Retrieved 12 July 2023.
- ^ "Local Elections Archive Project — Ashby Ward". www.andrewteale.me.uk. Retrieved 1 November 2024.
- ^ "Local Elections Archive Project — Bottesford Ward". www.andrewteale.me.uk. Retrieved 1 November 2024.
- ^ "Local Elections Archive Project — Broughton and Appleby Ward". www.andrewteale.me.uk. Retrieved 1 November 2024.
- ^ "Local Elections Archive Project — Axholme North Ward". www.andrewteale.me.uk. Retrieved 1 November 2024.
- ^ "Local Elections Archive Project — Brumby Ward". www.andrewteale.me.uk. Retrieved 1 November 2024.
External links
[edit]| Areas |
|  |
|---|---|---|
| Councils |
| |
| Elections |
| |