From Wikipedia, the free encyclopedia
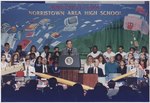 Bush on campaign. Seen here speaking at the Norristown, Pennsylvania High School, September, 1992.
The 1992 United States presidential election in Pennsylvania took place on November 3, 1992, and was part of the 1992 United States presidential election. Voters chose 23 representatives, or electors to the Electoral College, who voted for president and vice president.
Pennsylvania was won by Governor Bill Clinton (D) by a margin of 9.02 percentage points.[1] Billionaire businessman Ross Perot (I-TX) finished in third, with a significant 18.20 percent of Pennsylvania’s popular vote.[1] As of the 2016 presidential election[update], this is the last election in which Clearfield County voted for a Democratic Presidential candidate.[2]
Results
| United States presidential election in Pennsylvania, 1992[1]
|
| Party
|
Candidate
|
Running mate
|
Votes
|
Percentage
|
Electoral votes
|
|
|
Democratic
|
Bill Clinton
|
Al Gore
|
2,239,164
|
45.15%
|
23
|
|
|
Republican
|
George H.W. Bush
|
Dan Quayle
|
1,791,841
|
36.12%
|
0
|
|
|
Independent
|
Ross Perot
|
James Stockdale
|
902,667
|
18.20%
|
0
|
|
|
Libertarian
|
Andre Marrou
|
Nancy Lord
|
21,477
|
0.43%
|
0
|
|
|
New Alliance Party
|
Lenora Fulani
|
Maria Elizabeth Muñoz
|
4,661
|
0.09%
|
0
|
| Totals
|
4,959,810
|
100.0%
|
23
|
Results by county
|
|
William Jefferson Clinton
Democratic
|
George Herbert Walker Bush
Republican
|
Henry Ross Perot
Independent
|
Various candidates
Other parties
|
Margin
|
Total votes cast
|
| County
|
#
|
%
|
#
|
%
|
#
|
%
|
#
|
%
|
#
|
%
|
#
|
| Adams
|
9,576
|
32.46%
|
13,552
|
45.94%
|
6,313
|
21.40%
|
60
|
0.20%
|
-3,976
|
-13.48%
|
29,501
|
| Allegheny
|
324,004
|
52.75%
|
183,035
|
29.80%
|
103,470
|
16.85%
|
3,678
|
0.60%
|
140,969
|
22.95%
|
614,187
|
| Armstrong
|
12,995
|
45.87%
|
9,122
|
32.20%
|
6,166
|
21.76%
|
50
|
0.18%
|
3,873
|
13.67%
|
28,333
|
| Beaver
|
44,877
|
54.50%
|
21,361
|
25.94%
|
15,954
|
19.38%
|
148
|
0.18%
|
23,516
|
28.56%
|
82,340
|
| Bedford
|
5,840
|
31.04%
|
9,216
|
48.98%
|
3,731
|
19.83%
|
30
|
0.16%
|
-3,376
|
-17.94%
|
18,817
|
| Berks
|
46,031
|
35.03%
|
52,939
|
40.29%
|
31,663
|
24.10%
|
774
|
0.59%
|
-6,908
|
-5.26%
|
131,407
|
| Blair
|
14,857
|
33.19%
|
21,447
|
47.92%
|
8,284
|
18.51%
|
170
|
0.38%
|
-6,590
|
-14.72%
|
44,758
|
| Bradford
|
6,903
|
30.51%
|
10,221
|
45.17%
|
5,452
|
24.09%
|
52
|
0.23%
|
-3,318
|
-14.66%
|
22,628
|
| Bucks
|
97,902
|
39.40%
|
94,584
|
38.06%
|
53,931
|
21.70%
|
2,090
|
0.84%
|
3,318
|
1.34%
|
248,507
|
| Butler
|
22,303
|
36.48%
|
23,656
|
38.70%
|
15,013
|
24.56%
|
158
|
0.26%
|
-1,353
|
-2.21%
|
61,130
|
| Cambria
|
34,334
|
51.75%
|
20,770
|
31.30%
|
11,070
|
16.68%
|
175
|
0.26%
|
13,564
|
20.44%
|
66,349
|
| Cameron
|
824
|
30.77%
|
1,173
|
43.80%
|
676
|
25.24%
|
5
|
0.19%
|
-349
|
-13.03%
|
2,678
|
| Carbon
|
9,072
|
41.89%
|
7,243
|
33.44%
|
5,222
|
24.11%
|
122
|
0.56%
|
1,829
|
8.44%
|
21,659
|
| Centre
|
21,177
|
41.34%
|
20,478
|
39.98%
|
9,356
|
18.26%
|
214
|
0.42%
|
699
|
1.36%
|
51,225
|
| Chester
|
59,643
|
35.25%
|
74,002
|
43.73%
|
34,536
|
20.41%
|
1,027
|
0.61%
|
-14,359
|
-8.49%
|
169,208
|
| Clarion
|
5,584
|
35.53%
|
6,477
|
41.21%
|
3,619
|
23.02%
|
38
|
0.24%
|
-893
|
-5.68%
|
15,718
|
| Clearfield
|
12,247
|
39.70%
|
11,553
|
37.45%
|
6,989
|
22.66%
|
58
|
0.19%
|
694
|
2.25%
|
30,847
|
| Clinton
|
5,397
|
42.94%
|
4,471
|
35.57%
|
2,654
|
21.12%
|
47
|
0.37%
|
926
|
7.37%
|
12,569
|
| Columbia
|
8,261
|
34.80%
|
9,742
|
41.04%
|
5,683
|
23.94%
|
53
|
0.22%
|
-1,481
|
-6.24%
|
23,739
|
| Crawford
|
12,813
|
37.00%
|
14,112
|
40.75%
|
7,392
|
21.35%
|
311
|
0.90%
|
-1,299
|
-3.75%
|
34,628
|
| Cumberland
|
26,635
|
31.49%
|
43,447
|
51.37%
|
14,344
|
16.96%
|
147
|
0.17%
|
-16,812
|
-19.88%
|
84,573
|
| Dauphin
|
36,990
|
37.40%
|
45,479
|
45.98%
|
16,063
|
16.24%
|
378
|
0.38%
|
-8,489
|
-8.58%
|
98,910
|
| Delaware
|
111,210
|
41.80%
|
108,587
|
40.81%
|
43,728
|
16.43%
|
2,549
|
0.96%
|
2,623
|
0.99%
|
266,074
|
| Elk
|
5,016
|
36.26%
|
4,908
|
35.48%
|
3,885
|
28.09%
|
23
|
0.17%
|
108
|
0.78%
|
13,832
|
| Erie
|
56,381
|
47.86%
|
39,283
|
33.35%
|
21,510
|
18.26%
|
630
|
0.53%
|
17,098
|
14.51%
|
117,804
|
| Fayette
|
30,577
|
56.77%
|
12,820
|
23.80%
|
10,162
|
18.87%
|
302
|
0.56%
|
17,757
|
32.97%
|
53,861
|
| Forest
|
890
|
41.51%
|
801
|
37.36%
|
448
|
20.90%
|
5
|
0.23%
|
89
|
4.15%
|
2,144
|
| Franklin
|
13,440
|
30.66%
|
23,387
|
53.35%
|
6,941
|
15.83%
|
66
|
0.15%
|
-9,947
|
-22.69%
|
43,834
|
| Fulton
|
1,588
|
31.61%
|
2,558
|
50.93%
|
869
|
17.30%
|
8
|
0.16%
|
-970
|
-19.31%
|
5,023
|
| Greene
|
8,438
|
55.75%
|
3,482
|
23.01%
|
3,186
|
21.05%
|
29
|
0.19%
|
4,956
|
32.75%
|
15,135
|
| Huntingdon
|
5,153
|
32.82%
|
7,249
|
46.17%
|
3,273
|
20.85%
|
25
|
0.16%
|
-2,096
|
-13.35%
|
15,700
|
| Indiana
|
15,194
|
45.61%
|
10,966
|
32.92%
|
7,089
|
21.28%
|
65
|
0.20%
|
4,228
|
12.69%
|
33,314
|
| Jefferson
|
5,998
|
33.87%
|
7,271
|
41.05%
|
4,403
|
24.86%
|
39
|
0.22%
|
-1,273
|
-7.19%
|
17,711
|
| Juniata
|
2,601
|
30.89%
|
3,980
|
47.27%
|
1,819
|
21.60%
|
20
|
0.24%
|
-1,379
|
-16.38%
|
8,420
|
| Lackawanna
|
45,054
|
47.44%
|
33,443
|
35.22%
|
15,667
|
16.50%
|
804
|
0.85%
|
11,611
|
12.23%
|
94,968
|
| Lancaster
|
44,255
|
27.63%
|
88,447
|
55.22%
|
26,807
|
16.74%
|
671
|
0.42%
|
-44,192
|
-27.59%
|
160,180
|
| Lawrence
|
20,830
|
50.55%
|
12,359
|
30.00%
|
7,950
|
19.29%
|
64
|
0.16%
|
8,471
|
20.56%
|
41,203
|
| Lebanon
|
12,350
|
28.71%
|
21,512
|
50.00%
|
9,005
|
20.93%
|
154
|
0.36%
|
-9,162
|
-21.30%
|
43,021
|
| Lehigh
|
46,711
|
40.68%
|
42,631
|
37.12%
|
24,853
|
21.64%
|
641
|
0.56%
|
4,080
|
3.55%
|
114,836
|
| Luzerne
|
56,623
|
44.53%
|
49,285
|
38.76%
|
21,007
|
16.52%
|
231
|
0.18%
|
7,338
|
5.77%
|
127,146
|
| Lycoming
|
13,315
|
30.84%
|
20,536
|
47.57%
|
9,170
|
21.24%
|
151
|
0.35%
|
-7,221
|
-16.73%
|
43,172
|
| McKean
|
5,331
|
32.51%
|
6,965
|
42.47%
|
4,019
|
24.51%
|
85
|
0.52%
|
-1,634
|
-9.96%
|
16,400
|
| Mercer
|
23,264
|
46.68%
|
16,081
|
32.27%
|
10,277
|
20.62%
|
214
|
0.43%
|
7,183
|
14.41%
|
49,836
|
| Mifflin
|
4,946
|
33.67%
|
6,300
|
42.89%
|
3,382
|
23.03%
|
60
|
0.41%
|
-1,354
|
-9.22%
|
14,688
|
| Monroe
|
13,468
|
35.91%
|
14,557
|
38.82%
|
9,257
|
24.69%
|
218
|
0.58%
|
-1,089
|
-2.90%
|
37,500
|
| Montgomery
|
136,572
|
42.87%
|
125,704
|
39.46%
|
53,738
|
16.87%
|
2,562
|
0.80%
|
10,868
|
3.41%
|
318,576
|
| Montour
|
2,150
|
32.35%
|
3,096
|
46.58%
|
1,373
|
20.66%
|
27
|
0.41%
|
-946
|
-14.23%
|
6,646
|
| Northampton
|
42,203
|
43.27%
|
34,429
|
35.30%
|
20,234
|
20.75%
|
659
|
0.68%
|
7,774
|
7.97%
|
97,525
|
| Northumberland
|
12,814
|
35.80%
|
15,057
|
42.07%
|
7,782
|
21.74%
|
139
|
0.39%
|
-2,243
|
-6.27%
|
35,792
|
| Perry
|
4,086
|
26.66%
|
7,871
|
51.35%
|
3,334
|
21.75%
|
36
|
0.23%
|
-3,785
|
-24.69%
|
15,327
|
| Philadelphia
|
434,904
|
68.16%
|
133,328
|
20.90%
|
65,455
|
10.26%
|
4,371
|
0.69%
|
301,576
|
47.26%
|
638,058
|
| Pike
|
4,382
|
32.21%
|
6,084
|
44.73%
|
3,019
|
22.19%
|
118
|
0.87%
|
-1,702
|
-12.51%
|
13,603
|
| Potter
|
1,892
|
26.86%
|
3,452
|
49.01%
|
1,687
|
23.95%
|
13
|
0.18%
|
-1,560
|
-22.15%
|
7,044
|
| Schuylkill
|
23,679
|
37.57%
|
25,780
|
40.90%
|
13,398
|
21.26%
|
172
|
0.27%
|
-2,101
|
-3.33%
|
63,029
|
| Snyder
|
2,952
|
23.44%
|
6,934
|
55.05%
|
2,686
|
21.32%
|
24
|
0.19%
|
-3,982
|
-31.61%
|
12,596
|
| Somerset
|
12,493
|
38.14%
|
13,858
|
42.30%
|
6,333
|
19.33%
|
75
|
0.23%
|
-1,365
|
-4.17%
|
32,759
|
| Sullivan
|
1,030
|
33.09%
|
1,340
|
43.05%
|
731
|
23.48%
|
12
|
0.39%
|
-310
|
-9.96%
|
3,113
|
| Susquehanna
|
5,368
|
32.13%
|
7,356
|
44.02%
|
3,946
|
23.62%
|
39
|
0.23%
|
-1,988
|
-11.90%
|
16,709
|
| Tioga
|
4,868
|
29.43%
|
7,823
|
47.29%
|
3,804
|
22.99%
|
48
|
0.29%
|
-2,955
|
-17.86%
|
16,543
|
| Union
|
3,623
|
29.54%
|
6,362
|
51.87%
|
2,255
|
18.39%
|
25
|
0.20%
|
-2,739
|
-22.33%
|
12,265
|
| Venango
|
8,230
|
38.18%
|
8,545
|
39.64%
|
4,695
|
21.78%
|
84
|
0.39%
|
-315
|
-1.46%
|
21,554
|
| Warren
|
6,972
|
37.84%
|
6,585
|
35.74%
|
4,795
|
26.02%
|
74
|
0.40%
|
387
|
2.10%
|
18,426
|
| Washington
|
46,143
|
54.70%
|
21,977
|
26.05%
|
16,083
|
19.06%
|
161
|
0.19%
|
24,166
|
28.64%
|
84,364
|
| Wayne
|
4,817
|
28.64%
|
8,184
|
48.65%
|
3,727
|
22.16%
|
94
|
0.56%
|
-3,367
|
-20.02%
|
16,822
|
| Westmoreland
|
69,817
|
45.20%
|
47,315
|
30.63%
|
37,036
|
23.98%
|
283
|
0.18%
|
22,502
|
14.57%
|
154,451
|
| Wyoming
|
3,158
|
29.11%
|
5,143
|
47.40%
|
2,525
|
23.27%
|
24
|
0.22%
|
-1,985
|
-18.29%
|
10,850
|
| York
|
46,113
|
34.35%
|
60,130
|
44.79%
|
27,743
|
20.67%
|
259
|
0.19%
|
-14,017
|
-10.44%
|
134,245
|
| Totals |
2,239,164 |
45.15% |
1,791,841 |
36.13% |
902,667 |
18.20% |
26,138 |
0.53% |
447,323 |
9.02% |
4,959,810
|
References


