Jump to content

1967 Japanese general election

From Wikipedia, the free encyclopedia

This is an old revision of this page, as edited by Citation bot (talk | contribs) at 02:28, 24 August 2022 (Alter: title. | Use this bot. Report bugs. | Suggested by BrownHairedGirl | #UCB_webform 1374/3730). The present address (URL) is a permanent link to this revision, which may differ significantly from the current revision.

1967 Japanese general election

← 1963 29 January 1967 1969 →

All 486 seats in the House of Representatives
244 seats needed for a majority
Turnout73.98% (Increase2.84pp)
  First party Second party Third party
 
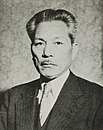
Leader Eisaku Satō Kōzō Sasaki Suehiro Nishio
Party Liberal Democratic Socialist Democratic Socialist
Leader since 1 December 1964 6 May 1965 1960
Leader's seat Yamaguchi–2nd Miyagi–1st Osaka–2nd
Last election 54.67%, 283 seats 29.03%, 144 seats 7.37%, 23 seats
Seats won 277 140 30
Seat change Decrease6 Decrease4 Increase6
Popular vote 22,447,838 12,826,104 3,404,464
Percentage 48.80% 27.88% 7.40%
Swing Decrease5.87pp Decrease1.15pp Increase0.03pp

  Fourth party Fifth party
 
CGP
Leader Tsuji Takehisa Kenji Miyamoto
Party Kōmeitō Communist
Leader since 9 December 1964 1 August 1958
Leader's seat Not contesting
(Councillor)
Did not contest
Last election 4.01%, 5 seats
Seats won 25 5
Seat change New Steady
Popular vote 2,472,371 2,190,564
Percentage 5.38% 4.76%
Swing New Increase0.75pp


Prime Minister before election

Eisaku Satō
Liberal Democratic

Prime Minister after election

Eisaku Satō
Liberal Democratic

General elections were held in Japan on 29 January 1967. The result was a victory for the Liberal Democratic Party, which won 277 of the 486 seats.[1] Voter turnout was 73.99%.

Results

PartyVotes%Seats+/–
Liberal Democratic Party22,447,83848.80277–6
Japan Socialist Party12,826,10427.88140–4
Democratic Socialist Party3,404,4647.4030+7
Komeitō2,472,3715.3825New
Japanese Communist Party2,190,5644.7650
Other parties101,2440.220
Independents2,553,9895.559–3
Total45,996,574100.00486+19
Valid votes45,996,57498.71
Invalid/blank votes602,8821.29
Total votes46,599,456100.00
Registered voters/turnout62,992,79673.98
Source: Nohlen et al.

By prefecture

Prefecture Total
seats
Seats won
LDP JSP DSP Komeitō JCP Ind.
Aichi 20 12 5 2 1
Akita 8 5 2 1
Aomori 7 4 3
Chiba 13 10 3
Ehime 9 7 1 1
Fukui 4 3 1
Fukuoka 19 8 6 2 2 1
Fukushima 12 8 3 1
Gifu 9 6 2 1
Gunma 10 7 3
Hiroshima 12 8 3 1
Hokkaido 22 10 10 1 1
Hyōgo 19 8 5 4 2
Ibaraki 12 8 3 1
Ishikawa 6 5 1
Iwate 8 5 3
Kagawa 6 4 2
Kagoshima 11 8 3
Kanagawa 14 4 5 3 2
Kōchi 5 2 2 1
Kumamoto 10 8 2
Kyoto 10 4 2 2 1 1
Mie 9 7 2
Miyagi 9 5 3 1
Miyazaki 6 4 1 1
Nagano 13 8 4 1
Nagasaki 9 6 3
Nara 5 2 2 1
Niigata 15 9 6
Ōita 7 5 2
Okayama 10 5 4 1
Osaka 23 8 4 4 6 1
Saga 5 3 2
Saitama 13 6 5 1 1
Shiga 5 3 2
Shimane 5 4 1
Shizuoka 14 8 4 1 1
Tochigi 10 6 3 1
Tokushima 5 3 1 1
Tokyo 39 16 13 3 6 1
Tottori 4 3 1
Toyama 6 4 2
Wakayama 6 5 1
Yamagata 8 5 3
Yamaguchi 9 6 2 1
Yamanashi 5 2 2 1
Total 486 277 140 30 25 5 9

References

  1. ^ "統計局ホームページ/第27章 公務員・選挙". Archived from the original on 2015-02-15. Retrieved 2012-12-19.