:For that, you can use <tt>Solve 1/t'[v]=10+5v with t[0]=0</tt>, although this trick may not generalize adequately. [[User:Sławomir Biały|<span style="text-shadow:grey 0.3em 0.3em 0.1em; class=texhtml">Sławomir Biały</span>]] ([[User talk:Sławomir Biały|talk]]) 21:17, 29 January 2012 (UTC)
:For that, you can use <tt>Solve 1/t'[v]=10+5v with t[0]=0</tt>, although this trick may not generalize adequately. [[User:Sławomir Biały|<span style="text-shadow:grey 0.3em 0.3em 0.1em; class=texhtml">Sławomir Biały</span>]] ([[User talk:Sławomir Biały|talk]]) 21:17, 29 January 2012 (UTC)
= January 30 =
= January 29 =
= January 28 =
Revision as of 00:01, 30 January 2012
Welcome to the mathematics section of the Wikipedia reference desk.
The best answers address the question directly, and back up facts with wikilinks and links to sources. Do not edit others' comments and do not give any medical or legal advice.
If 15% of drivers involved in automobile accidents are not wearing a seat belt at the time of their crash, yet they account for 27% of accident fatalities amongst all drivers, then we can compute that an unrestrained driver is ( 0.27 / 0.73 ) / ( 0.15 / 0.85 ) = 2.1 times more likely to die if they have an accident, right? What is this sort of calculation called, and do we have an article on it? -- ToE00:27, 23 January 2012 (UTC)[reply]
Can someone explain in simple terms what this is? I'm particularly interested in the maths behind the left image (not digital!) and whether the image on the right (which I made) has any underlying similarity. Thanks SmartSE (talk) 00:12, 24 January 2012 (UTC)[reply]
The picture on the left shows a "mystic rose" with 30 points (see complete graph, though the rose has the diameters omitted, and seems to have smaller roses superimposed — — hereis the simple complete graph). Your construction is also a complete graph, but I can't see any significant similarities -- perhaps someone else can? Dbfirs07:53, 24 January 2012 (UTC)[reply]
The picture on the left actually has 240 points corresponding to root vectors of the E8 root system. Its a projection from eight dimensional space to two dimensions. You could also think of it as a projection of the 4_21_polytope. Actually the Petrie polygon projection is used here which shows the eight rings of 30 points. --Salix (talk): 09:13, 24 January 2012 (UTC)[reply]
Ah ok, well that's something at least - now I know that it is a complete group. Why are all our examples circles and not squares? Do complete square groups have their own name? Can you explain how it is "a projection from eight dimensional space to two dimensions" - just the thought of that makes my head hurt! SmartSE (talk) 17:45, 24 January 2012 (UTC)[reply]
(edit conflict) It is difficult to be sure what counts as "simple terms" without knowing how much group theory you are familiar with. E8 is a type of group called a simple Lie group. It can be associated with a finite group with 696729600 members. This finite group is also the symmetry group of a semi-regular polytope in 8 dimensions called the 421 polytope, which has 240 vertices and 6720 edges. And the left-hand image of the pair is a projection of vertices and edges of the 421 polytope onto 2 dimensions, in which the 240 vertices are arranged in 8 concentric rings of 30 vertices each. Gandalf61 (talk) 09:35, 24 January 2012 (UTC)[reply]
Sorry, I should have made that clearer - I know absolutely nothing about group theory and don't find our articles particularly helpful given that. I don't really get what's so special about E8 and especially why it "can be associated with a finite group with 696729600 members". Does that means there are 696729599 similar patterns that can be made?! How's that calculated? SmartSE (talk) 17:45, 24 January 2012 (UTC)[reply]
You're at a real disadvantage then. The reason it (and some of its cousins) are special is because of certain group theoretical properties. Most people spend three or four years at university and still don't feel group theory. The honest, and brutal, answer is that you won't be able to understand or appreciate the details until you know quite a lot about group theory. Given that you don't know anything about group theory then you're in a bit of a bind. It's like asking someone in Norway to explain Norwegian literature to you in Norwegian. You have to be able to speak Norwegian first, and even those that speak Norwegian fluently might not appreciate certain types of Norwegian literature. (Mathematical theories are like literature: not everyone finds group theory beautiful. Some very able professional mathematicians don't particularly like group theory.) — Fly by Night(talk)18:58, 24 January 2012 (UTC)[reply]
I guess the best place to start is Group (mathematics) for basics of group theory. Rather that dive straight into looking at E8 it might help to look at a simpler ones like A2. There are many different things called A2 which are all related (see ADE classification). The Lie group is a set of 3 by 3 matrices with special properties (actually an infinite number of matrices), the Lie algebra is a different set of 3 by 3 matrices (which all have trace zero). From these you get a root system, for A2 this just two vectors at 120° to each other. Now these two vectors at 120° define two planes at 120°, The reflections in these planes define a group with six elements: the identity, three reflections and rotations by ±120° this is the Weyl group and is the group of symmetries of a triangle. For E8 the root system has 240 vectors in 8 dimensions, these define 240 planes and the Weyl group of the reflections in these planes has 696729600.--Salix (talk): 23:44, 24 January 2012 (UTC)[reply]
In an undirected graph with no self-loops, this is a path which:
is simple, except that it may (but is not required to be) a cycle,
has length at least 1, and
each vertex in the path has degree 2 if and only if it is not an end vertex.
For the purposes of this definition, a cycle is considered to have either no end vertices or one end vertex—two end vertices would require two distinct paths of this type.
This is sort of like an ear in ear decomposition. The last ear added to the graph has these properties, although previous ones get more ears added on to them so they no longer have all vertices of degree 2. Rckrone (talk) 02:29, 26 January 2012 (UTC)[reply]
This is probably very elementary for someone who's knowledgeable in probability. Over the years (I'm not a regular player), I've bought 10-11 scratch tickets of one particular game. I looked on the back of the ticket I just played today and the odds of winning (including break even) are 1 in 4.442. I have never won. What are the odds of buying 10 tickets of a game whose odds are 1 in 4.442 and not winning any? Low, I would think, but I'm wondering if my outcome is very uncommon. 20.137.18.53 (talk) 20:16, 24 January 2012 (UTC)[reply]
The chances of not winning any are about 1 in 12.813, assuming you have given the numbers correctly, which is not clear, because at the very least you are misusing the word "odds". (Odds are given in the form "1 to X", not "1 in X".) Looie496 (talk) 20:26, 24 January 2012 (UTC)[reply]
Please forgive my terminology usage faux pas. Just looked at the ticket again and the word printed on it is "chances" but I misremembered it when I typed "odds" in the question above. 20.137.18.53 (talk) 20:36, 24 January 2012 (UTC)20.137.18.53 (talk) 20:30, 24 January 2012 (UTC)[reply]
For the mathematics behind Looie's figures, if your chance of winning an individual draw is 1 in 4.442, then the probability winning any one draw is pw = 1 / 4.442 = 0.2251, and the probability of losing any one draw is 1 - pw = 0.7749. So the probability losing any ten in a row is (1 - pw)10 = 0.07804 = 1 / 12.81. Thus your luck so far has been strong, but not excessivelyso. -- ToE01:14, 25 January 2012 (UTC) "If it weren't for bad luck I'd have no luck at all!"[reply]
I do not understand Looie's figures. If 1 out of 4442 scratch tickets is a winner, then the mean number of times you win is 1/4442 per ticket, and that is 10/4442=1/444 for 10 tickets. So every 444 times you buy 10 scratch tickets you will lose about 443 times and win about once. Bo Jacoby (talk) 23:20, 24 January 2012 (UTC).[reply]
There's also the fact that Looie and you are making different assumptions about the overlap of events. Looie is assuming that the tickets are independent, while you're assuming that there's no overlap --- it's impossible to win with more than one ticket. Since the OP mentioned that the tickets are spread out over years, the implication is that they're from separate ticket runs, and so Looie's assumption is likely correct.--195.37.234.132 (talk) 07:57, 25 January 2012 (UTC)[reply]
January 25
number of non-isomorphic hamiltonian cycle on n-cubes?
For n=1, 2 and 3 all hamiltonian cycles on the edges of an n-cube are isomorphic to each other but this is not true for n=4. I think there are at least 3 based on whether the edge which is "removed" from the cycles of two 3-cubes to connect the cycles is in the dimension where the n=3 hamiltonian cycle changes value 4 times or the two dimensions where it only changes twice. For example if the cycle on n=3 is 000,001,011,010,110,111,101,100(,000) then the third position is the one that changes 4 times. I've been looking at oeis, specifically at oeis:A66037, but I don't understand why they appear to have a value greater than 1 for n=3, since as far as I can tell, all n=3 hamiltonian cycles are isomorphic to each other. Any ideas?Naraht (talk) 15:18, 25 January 2012 (UTC)[reply]
The OEIS sequence does not count isomorphism classes but cycles with a fixed starting point and direction. oeis:A091302 is probably closer to what you had in mind but it's still not counting isomorphism classes in the graph theoretic sense. I get two paths according to the A091302 definition: 000,001,011,010,110,111,101,100 and 000,001,011,111,101,100,110,010; there is an isomorphism of the cube which takes one to the other, but it's not obtained by permuting indices so the cycles are counted as different. I couldn't find an OEIS sequence for actual isomorphism classes, it seems like there ought to be one if the values are known.--RDBury (talk) 17:17, 25 January 2012 (UTC)[reply]
but was met with deafening silence. Does anyone here do enough mathematical physics to be able to help out? -- ToE04:01, 26 January 2012 (UTC) Sorry for the cross post, but this appears to be a well posed, serious question that was beyond the capabilities of the RD/S regulars.[reply]
Harmonic Sequences and Other Sequences (Mathematics)
Hi, I really need to know how to solve a harmonic sequence in math. I know that there is no general formula in a harmonic sequence, but I'm still confused about it.
I'm trying my best to understand it, specially on how to solve it. But the problem is I don't know how. Can you please help me? Please show me examples, explain how to solve it, give it's meaning and I would be very happy if you will provide more information about it.
How can Harmonic Sequences and Other Sequences differ from each other? Is it about the operations I will use? Like if I will multiply it or divide it?
Please teach me in solving other sequences. I'm worried, because I have to report this topic next week. Please help me, and thank you. — Preceding unsigned comment added by NovelleJohnson (talk • contribs) 12:40, 26 January 2012 (UTC)[reply]
Average for individuals going in a different direction from the group average
I came across an interesting observation and I was wondering if there is a name for the trick behind it or if it was well known or occurred somewhere else. It was that whilst the government statistics said pensioners were getting richer in fact individually they got poorer. The way it worked was that new pensioners were richer and old pensioners dying off were poorer. So both sides of the argument were in fact correct. Anyone come across this effect? Dmcq (talk) 18:11, 26 January 2012 (UTC)[reply]
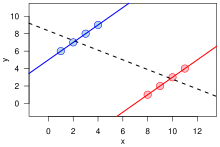
I can't easily tell if it's an exact match, but this is closely related to Simpson's paradox. Basically, the idea is that two opposite (seemingly contradictory) relationships can be seen in the same data, depending on how they are grouped. The article is quite nice, including an illuminating figure and several famous real-world examples. SemanticMantis (talk) 18:53, 26 January 2012 (UTC)[reply]
Thanks for those suggestions. The bit in survivorship bias about results being reported only for companies which have survived sounds very similar I think. It sounds quite a difficult problem to avoid in fact. Dmcq (talk) 00:46, 27 January 2012 (UTC)[reply]
For another example, I believe there was a time where the average size of GM vehicles was going up, while the individual model size was going down. This was because they would introduce new full-sized vehicles while downsizing the existing fleet. Note that "adding new data points" applies in both cases, whether new pensioners or new full-sized models. StuRat (talk) 00:01, 28 January 2012 (UTC)[reply]
Yes that's exactly the same, I wonder, do you know how anyone noticed that was happening or why were they doing it thanks? When you phrase it as 'adding new datapoints' it certainly makes it obvious that the underlying problem is probably quite common even if the consequences aren't always so strange. Dmcq (talk)
They did it because people like to feel like they are getting "more car for less money". So, if they downsize a full-size model to be mid-sized, people still think of it as a full-sized model for some time, and are thus willing to pay more. Of course, this would inevitably result in nothing but sub-compacts, unless they also added new full-sized models to the line. But, after doing this for a few years, people figured it out, it no longer became an effective strategy, and they stopped. The most extreme example of this downsizing strategy is the Hummer H1 (86.5 inch width), Hummer H2 (81.2 inch width), and Hummer H3 (74.7 inch width). GM had previously tried a strategy of introducing new models at the small end of each make, with less success, like the Cadillac Cimarron. StuRat (talk) 20:29, 29 January 2012 (UTC)[reply]
After some thought, I'm sure now that the pensioner case is a textbook example of Simpson's paradox. Look at this graph from our article. Consider red to be one pensioner, blue another. Consider the horizontal axis to be time, and reverse it (read it right to left), and let the vertical axis represent net worth. Interpreted this way, it illustrates how it can be that each individual's net worth goes down over time, while the total group mean goes up. So yes, the phenomenon does have a name, and it comes up fairly often. Our article indicates that it is not well-known, but experts have recommended that we raise awareness :) SemanticMantis (talk) 17:41, 28 January 2012 (UTC)[reply]
Let's say that you have m groups of people: G1, …, Gm. There are n rooms, say R1, …, Rn. We ask one person from each group to (randomly) go into one of the rooms, so that no person from the same group is in the same room. Assume that each room has exactly one person from each group. (I think this means |G1| = … = |Gm| = n.) Each room now has m people in it: one from each group. Everyone goes back to their groups. Again, we ask one person from each group to (randomly) go into one of the rooms, so that no person from the same group is in the same room. What is the probability that at least two of the people together in room one after the first sort will find themselves together in another room after the second sort? — Fly by Night (talk)18:42, 26 January 2012 (UTC)[reply]
You can check that if , it's guaranteed. Otherwise, the idea is that it's easier to count the probability of it not happening. If you take the first person from the first room, the probability that the second person from their new room is not the second person from their old room is . Similarly for every other person from their new room. So the odds that they see no one familiar is . Now, assuming the first person saw no one familiar, the second person from the first room is guaranteed not to see the first person. But they still need to perform the above calculation for the third and on person of their new room. But now the probability that the third person of their new room is not the third person from their old room is , since one wrong person from the third group has already been spent on the first person's room. Similarly for the rest of the people in their new room. Following this pattern, the final formula is .--195.37.234.132 (talk) 20:57, 26 January 2012 (UTC)[reply]
Thank you very much for such a detailed answer. I appreciate you taking the time to help me. Reading your reasoning, it worries me that you say things like "If you take the first person from the first room, the probability that the second person from their new room is not the second person from their old room…" Does that mean that the order in which people enter the room matters? The order in which they enter the room is unimportant. I suspect that this is indeed the case with your expression, but I would just like you to confirm that that is the case. I look forward to hearing your thoughts. Thanks again! — Fly by Night (talk)21:38, 27 January 2012 (UTC)[reply]
No, it doesn't matter. When you want a bunch of events to all happen (in this case, we want everyone from the first room to not see anyone familiar), it's common to think about them one at a time, and that tends to color the language we use to talk about it. But as you say, the order is unimportant.--195.37.234.132 (talk) 22:29, 27 January 2012 (UTC)[reply]
Not sure what the question is; the Alpha page gives an expression as a polynomial in p, are you having trouble evaluating the polynomial? Are you stuck on how you would get the polynomial from the summation? The summation obviously diverges for z=2, so the value of the of Φ is defined via analytic continuation; are you confused about that?--RDBury (talk) 10:32, 28 January 2012 (UTC)[reply]
Also, though it's not stated in the article, it's obvious from the definition (see geometric series) that
Apply the identity with with s=0 to get
Apply the identity with with s=-1 to get
Plugging z=2 in gives
which agrees with Alpha's expression once you simplify and replace a with p.
Another approach is to multiply by 1−z and combine terms to evaluate the sum:
which is the expression obtained before. This is directly from the definition except for the grinding noises. This only works for |z|<1 but you can extend it to z=2 by analytic continuation.--RDBury (talk) 23:23, 28 January 2012 (UTC)[reply]
Figure out how many aliens of each color there are.
There are a total of 123 arms and 97 legs. The following are the different aliens and their corresponding limb amounts:
- YELLOW aliens have 5 arms, 4 legs
- PURPLE aliens have 4 arms, 2 legs
- BLUE aliens have 2 arms, 3 legs
How do you solve this methodically? ==>
5x + 4y + 2z = 123
4x + 2y + 3z = 97
Two equations, three unknowns. We know that x, y, z are all positive or zero. This seems like a Diophantine equation but I don't know how to solve it without guessing and checking. — Preceding unsigned comment added by 151.213.191.93 (talk) 03:09, 29 January 2012 (UTC)[reply]
You can always cheat and plug it into Wolfam Alpha, which gives the integer solutions at the bottom. You can quickly see that the only solutions that avoid negative values are n=0,1 and 2, so that gives you (x,y,z)=(1,21,17), (9,14,11) and (17,7,5). You can easily prove that those are solutions, your challenge is then to prove that there aren't any others - tricks involving modular arithmetic are usually the way to go with these questions, although I haven't tried with this one (although it is immediately clear that both x and z are odd). --Tango (talk) 03:50, 29 January 2012 (UTC)[reply]
Let's see. As Tango says, x and z have to be odd. Eliminating y gives us
3x + 4z = 71
Since 4z is 71 or less, z must be 17 or less. Workling modulo 3 tell us that z must be 2 mod 3. So z is an odd number, between 1 and 17, equal to 2 mod 3. This means that z can be 5, 11 or 17. The corresponding values of x are 17, 9 and 1, and y is 7, 14 or 21. Gandalf61 (talk) 15:16, 29 January 2012 (UTC)[reply]
Wolfram Alpha
I'm trying to get the hang of the Wolfram Alpha app for the iPhone. Just to test it I inputted
solve diff(v,t) = 10 + 5v for t
It seems to understand the solve and for commands, but then gives a (correct) solution of
How do I get it to give a solution of the form t = …? Asking it to display the steps shows that it actually works this out, but then inverts it to give v = ….
Also, how do I get it to impose initial conditions? I want the condition v(0) = 0. — Fly by Night (talk)15:31, 29 January 2012 (UTC)[reply]
For the initial condition, you can enter it in mathematica syntax as DSolve[{v'[t]==10+5v[t], v[0]==0},v[t],t]. To get it to solve for t, maybe rewrite it as DSolve[{1/t'[v]==10+5v, t[0]==0},t[v],v]. Sławomir Biały (talk) 15:39, 29 January 2012 (UTC)[reply]
You can always use a second query: v=2 (-1+e^(5 t)) in terms of t seems to work. I don't know about the iphone app, but on the browser version, you can click on any expression in the results and it performs a new search with that term as the query, to save you typing it all out manually. Trying to get Wolfram Alpha to do what you want always seems like more of an art than a science, and it isn't exactly well documented - I suppose they need some people to buy Mathematica, though. 81.98.43.107 (talk) 19:51, 29 January 2012 (UTC)[reply]