
List of U.S. states and territories by area
This is a complete list of the states of the United States and its major territories ordered by total area, land area, and water area. The water area figures include inland, coastal, Great Lakes, and territorial waters. Glaciers and intermittent water features are counted as land area.[1]
Table
| Total area[2] | Land area[2] | Water[2] | |||||||
|---|---|---|---|---|---|---|---|---|---|
| Rank | State/territory | sq mi | km² | sq mi | km² | % land | sq mi | km² | % water |
| Template:Nk | 665,384.04 | 1,723,337 | 570,640.95 | 1,477,953 | 85.76% | 94,743.10 | 245,384 | 14.24% | |
| Template:Nk | 268,596.46 | 695,662 | 261,231.71 | 676,587 | 97.26% | 7,364.75 | 19,075 | 2.74% | |
| Template:Nk | 163,694.74 | 423,967 | 155,779.22 | 403,466 | 95.16% | 7,915.52 | 20,501 | 4.84% | |
| Template:Nk | 147,039.71 | 380,831 | 145,545.80 | 376,962 | 98.98% | 1,493.91 | 3,869 | 1.02% | |
| Template:Nk | 121,590.30 | 314,917 | 121,298.15 | 314,161 | 99.76% | 292.15 | 757 | 0.24% | |
| Template:Nk | 113,990.30 | 295,234 | 113,594.08 | 294,207 | 99.65% | 396.22 | 1,026 | 0.35% | |
| Template:Nk | 110,571.82 | 286,380 | 109,781.18 | 284,332 | 99.28% | 790.65 | 2,048 | 0.72% | |
| Template:Nk | 104,093.67 | 269,601 | 103,641.89 | 268,431 | 99.57% | 451.78 | 1,170 | 0.43% | |
| Template:Nk | 98,378.54 | 254,799 | 95,988.01 | 248,608 | 97.57% | 2,390.53 | 6,191 | 2.43% | |
| Template:Nk | 97,813.01 | 253,335 | 97,093.14 | 251,470 | 99.26% | 719.87 | 1,864 | 0.74% | |
| Template:Nk | 96,713.51 | 250,487 | 56,538.90 | 146,435 | 58.46% | 40,174.61 | 104,052 | 41.54% | |
| Template:Nk | 86,935.83 | 225,163 | 79,626.74 | 206,232 | 91.59% | 7,309.09 | 18,930 | 8.41% | |
| Template:Nk | 84,896.88 | 219,882 | 82,169.62 | 212,818 | 96.79% | 2,727.26 | 7,064 | 3.21% | |
| Template:Nk | 83,568.95 | 216,443 | 82,643.12 | 214,045 | 98.89% | 925.83 | 2,398 | 1.11% | |
| Template:Nk | 82,278.36 | 213,100 | 81,758.72 | 211,754 | 99.37% | 519.64 | 1,346 | 0.63% | |
| Template:Nk | 77,347.81 | 200,330 | 76,824.17 | 198,974 | 99.32% | 523.64 | 1,356 | 0.68% | |
| Template:Nk | 77,115.68 | 199,729 | 75,811.00 | 196,350 | 98.31% | 1,304.68 | 3,379 | 1.69% | |
| Template:Nk | 71,297.95 | 184,661 | 66,455.52 | 172,119 | 93.21% | 4,842.43 | 12,542 | 6.79% | |
| Template:Nk | 70,698.32 | 183,108 | 69,000.80 | 178,711 | 97.60% | 1,697.52 | 4,397 | 2.40% | |
| Template:Nk | 69,898.87 | 181,037 | 68,594.92 | 177,660 | 98.13% | 1,303.95 | 3,377 | 1.87% | |
| Template:Nk | 69,706.99 | 180,540 | 68,741.52 | 178,040 | 98.61% | 965.47 | 2,501 | 1.39% | |
| Template:Nk | 65,757.70 | 170,312 | 53,624.76 | 138,887 | 81.55% | 12,132.94 | 31,424 | 18.45% | |
| Template:Nk | 65,496.38 | 169,635 | 54,157.80 | 140,268 | 82.69% | 11,338.57 | 29,367 | 17.31% | |
| Template:Nk | 59,425.15 | 153,910 | 57,513.49 | 148,959 | 96.78% | 1,911.66 | 4,951 | 3.22% | |
| Template:Nk | 57,913.55 | 149,995 | 55,518.93 | 143,793 | 95.87% | 2,394.62 | 6,202 | 4.13% | |
| Template:Nk | 56,272.81 | 145,746 | 55,857.13 | 144,669 | 99.26% | 415.68 | 1,077 | 0.74% | |
| Template:Nk | 54,554.98 | 141,297 | 47,126.40 | 122,057 | 86.38% | 7,428.58 | 19,240 | 13.62% | |
| Template:Nk | 53,819.16 | 139,391 | 48,617.91 | 125,920 | 90.34% | 5,201.25 | 13,471 | 9.66% | |
| Template:Nk | 53,178.55 | 137,732 | 52,035.48 | 134,771 | 97.85% | 1,143.07 | 2,961 | 2.15% | |
| Template:Nk | 52,420.07 | 135,767 | 50,645.33 | 131,171 | 96.61% | 1,774.74 | 4,597 | 3.39% | |
| Template:Nk | 52,378.13 | 135,659 | 43,203.90 | 111,898 | 82.48% | 9,174.23 | 23,761 | 17.52% | |
| Template:Nk | 48,431.78 | 125,438 | 46,923.27 | 121,531 | 96.89% | 1,508.51 | 3,907 | 3.11% | |
| Template:Nk | 46,054.35 | 119,280 | 44,742.70 | 115,883 | 97.15% | 1,311.64 | 3,397 | 2.85% | |
| Template:Nk | 44,825.58 | 116,098 | 40,860.69 | 105,829 | 91.15% | 3,964.89 | 10,269 | 8.85% | |
| Template:Nk | 42,774.93 | 110,787 | 39,490.09 | 102,279 | 92.32% | 3,284.84 | 8,508 | 7.68% | |
| Template:Nk | 42,144.25 | 109,153 | 41,234.90 | 106,798 | 97.84% | 909.36 | 2,355 | 2.16% | |
| Template:Nk | 40,407.80 | 104,656 | 39,486.34 | 102,269 | 97.72% | 921.46 | 2,387 | 2.28% | |
| Template:Nk | 36,419.55 | 94,326 | 35,826.11 | 92,789 | 98.37% | 593.44 | 1,537 | 1.63% | |
| Template:Nk | 35,379.74 | 91,633 | 30,842.92 | 79,883 | 87.18% | 4,536.82 | 11,750 | 12.82% | |
| Template:Nk | 32,020.49 | 82,933 | 30,060.70 | 77,857 | 93.88% | 1,959.79 | 5,076 | 6.12% | |
| Template:Nk | 24,230.04 | 62,756 | 24,038.21 | 62,259 | 99.21% | 191.83 | 497 | 0.79% | |
| Template:Nk | 12,405.93 | 32,131 | 9,707.24 | 25,142 | 78.25% | 2,698.69 | 6,990 | 21.75% | |
| Template:Nk | 10,931.72 | 28,313 | 6,422.63 | 16,635 | 58.75% | 4,509.09 | 11,678 | 41.25% | |
| Template:Nk | 10,554.39 | 27,336 | 7,800.06 | 20,202 | 73.90% | 2,754.33 | 7,134 | 26.10% | |
| Template:Nk | 9,616.36 | 24,906 | 9,216.66 | 23,871 | 95.84% | 399.71 | 1,035 | 4.16% | |
| Template:Nk | 9,349.16 | 24,214 | 8,952.65 | 23,187 | 95.76% | 396.51 | 1,027 | 4.24% | |
| Template:Nk | 8,722.58 | 22,591 | 7,354.22 | 19,047 | 84.31% | 1,368.36 | 3,544 | 15.69% | |
| Template:Nk | 5,543.41 | 14,357 | 4,842.36 | 12,542 | 87.35% | 701.06 | 1,816 | 12.65% | |
| Template:Nk | 2,488.72 | 6,446 | 1,948.54 | 5,047 | 78.29% | 540.18 | 1,399 | 21.71% | |
| Template:Nk | 1,544.89 | 4,001 | 1,033.81 | 2,678 | 66.92% | 511.07 | 1,324 | 33.08% | |
| Template:Nk | 68.34 | 177 | 61.05 | 158 | 89.33% | 7.29 | 19 | 10.67% | |
| Template:Nk | 5,324.84 | 13,791 | 3,423.78 | 8,868 | 64.30% | 1,901.07 | 4,924 | 35.70% | |
| Template:Nk | 1,975.57 | 5,117 | 182.33 | 472 | 9.23% | 1,793.24 | 4,644 | 90.77% | |
| Template:Nk | 732.93 | 1,898 | 134.32 | 348 | 18.33% | 598.61 | 1,550 | 81.67% | |
| Template:Nk | 581.05 | 1,505 | 76.46 | 198 | 13.16% | 504.60 | 1,307 | 86.84% | |
| Template:Nk | 570.62 | 1,478 | 209.80 | 543 | 36.77% | 360.82 | 935 | 63.23% | |
| Template:Nk | 16.0 | 41 | 16.0 | 41 | — | — | — | — | |
| Total | 3,120,426.47 | 8,081,867 | 2,954,841.42 | 7,653,004 | 94.69% | 165,584.6 | 428,862 | 5.31% | |
| Total | 3,796,742.23 | 9,833,517 | 3,531,905.43 | 9,147,593 | 93.02% | 264,836.79 | 685,924 | 6.98% | |
| Total | 3,805,943.26 | 9,857,348 | 3,535,948.12 | 9,158,064 | 92.91% | 269,995.13 | 699,284 | 7.09% | |
Total, land & water areas showing states, territories, divisions and regions - geographic sort
| Legend |
|---|
| Division totals – 9 divisions for 50 States and DC |
| Region totals – 4 regions ( 2 or 3 divisions each) |
| Individual territories |
| Total U.S. Territorries |
| 50 States + DC and District of Colombia |
| Divisions & regions as defined by U.S. Census Bureau |
| Last col. shows larger region which contains entity in col. 1 |
| State/Territory/ Division/Region |
R a n k |
Total area sqmi. |
R a n k |
Land area sqmi. |
R a n k |
Water area sqmi. |
Geog. sort |
|---|---|---|---|---|---|---|---|
| 39 | 35,380 | 39 | 30,843 | 12 | 4,537 | NEng | |
| 44 | 10,554 | 45 | 7,800 | 16 | 2,754 | NEng | |
| 45 | 9,616 | 43 | 9,217 | 46 | 400 | NEng | |
| 46 | 9,349 | 44 | 8,953 | 47 | 397 | NEng | |
| 48 | 5,543 | 48 | 4,842 | 38 | 701 | NEng | |
| 50 | 1,545 | 50 | 1,034 | 43 | 511 | NEng | |
| New England | 9 | 71,988 | 9 | 62,688 | 7 | 9,300 | NEast |
| 27 | 54,555 | 30 | 47,126 | 7 | 7,429 | MdAtl | |
| 33 | 46,054 | 32 | 44,743 | 28 | 1,312 | MdAtl | |
| 47 | 8,723 | 46 | 7,354 | 27 | 1,368 | MdAtl | |
| Mid-Atlantic | 8 | 109,332 | 8 | 99,223 | 6 | 10,109 | NEast |
| Northeast | 4 | 181,320 | 4 | 161,912 | 4 | 19,408 | USA |
| 22 | 65,758 | 26 | 53,625 | 3 | 12,133 | SAtl | |
| 24 | 59,425 | 21 | 57,513 | 22 | 1,912 | SAtl | |
| 28 | 53,819 | 29 | 48,618 | 10 | 5,201 | SAtl | |
| 35 | 42,775 | 36 | 39,490 | 15 | 3,285 | SAtl | |
| 40 | 32,020 | 40 | 30,061 | 21 | 1,960 | SAtl | |
| 41 | 24,230 | 41 | 24,038 | 50 | 192 | SAtl | |
| 42 | 12,406 | 42 | 9,707 | 18 | 2,699 | SAtl | |
| 49 | 2,489 | 49 | 1,949 | 40 | 540 | SAtl | |
| -- | 68 | -- | 61 | -- | 7 | SAtl | |
| South Atlantic | 6 | 292,990 | 5 | 265,062 | 3 | 27,928 | South |
| 30 | 52,420 | 28 | 50,645 | 23 | 1,775 | ESC | |
| 32 | 48,432 | 31 | 46,923 | 25 | 1,509 | ESC | |
| 36 | 42,144 | 34 | 41,235 | 35 | 909 | ESC | |
| 37 | 40,408 | 37 | 39,486 | 34 | 921 | ESC | |
| East South Central | 7 | 183,404 | 7 | 178,290 | 9 | 5,114 | South |
| 2 | 268,596 | 2 | 261,232 | 8 | 7,365 | WSC | |
| 20 | 69,899 | 19 | 68,595 | 30 | 1,304 | WSC | |
| 29 | 53,179 | 27 | 52,035 | 31 | 1,143 | WSC | |
| 31 | 52,378 | 33 | 43,204 | 5 | 9,174 | WSC | |
| West South Central | 4 | 444,052 | 4 | 425,066 | 4 | 18,986 | South |
| South | 2 | 920,446 | 2 | 868,418 | 3 | 52,029 | USA |
| 11 | 96,714 | 22 | 56,539 | 2 | 40,175 | ENC | |
| 23 | 65,496 | 25 | 54,158 | 4 | 11,339 | ENC | |
| 25 | 57,914 | 24 | 55,519 | 19 | 2,395 | ENC | |
| 34 | 44,826 | 35 | 40,861 | 14 | 3,965 | ENC | |
| 38 | 36,420 | 38 | 35,826 | 39 | 593 | ENC | |
| East North Central | 5 | 301,369 | 6 | 242,902 | 2 | 58,466 | MWest |
| 12 | 86,936 | 14 | 79,627 | 9 | 7,309 | WNC | |
| 15 | 82,278 | 13 | 81,759 | 42 | 520 | WNC | |
| 16 | 77,348 | 15 | 76,824 | 41 | 524 | WNC | |
| 17 | 77,116 | 16 | 75,811 | 29 | 1,305 | WNC | |
| 19 | 70,698 | 17 | 69,001 | 24 | 1,698 | WNC | |
| 21 | 69,707 | 18 | 68,742 | 32 | 965 | WNC | |
| 26 | 56,273 | 23 | 55,857 | 45 | 416 | WNC | |
| West North Central | 3 | 520,356 | 3 | 507,620 | 5 | 12,736 | MWest |
| Midwest | 3 | 821,724 | 3 | 750,523 | 2 | 71,202 | USA |
| 4 | 147,040 | 4 | 145,546 | 26 | 1,494 | Mtn | |
| 5 | 121,590 | 5 | 121,298 | 49 | 292 | Mtn | |
| 6 | 113,990 | 6 | 113,594 | 48 | 396 | Mtn | |
| 7 | 110,572 | 7 | 109,781 | 36 | 791 | Mtn | |
| 8 | 104,094 | 8 | 103,642 | 44 | 452 | Mtn | |
| 10 | 97,813 | 9 | 97,093 | 37 | 720 | Mtn | |
| 13 | 84,897 | 12 | 82,170 | 17 | 2,727 | Mtn | |
| 14 | 83,569 | 11 | 82,643 | 33 | 926 | Mtn | |
| Mountain | 2 | 863,565 | 2 | 855,767 | 8 | 7,798 | West |
| 1 | 665,384 | 1 | 570,641 | 1 | 94,743 | Pac | |
| 3 | 163,695 | 3 | 155,779 | 6 | 7,916 | Pac | |
| 9 | 98,379 | 10 | 95,988 | 20 | 2,391 | Pac | |
| 18 | 71,298 | 20 | 66,456 | 11 | 4,842 | Pac | |
| 43 | 10,932 | 47 | 6,423 | 13 | 4,509 | Pac | |
| Pacific | 1 | 1,009,687 | 1 | 895,286 | 1 | 114,401 | West |
| West | 1 | 1,873,252 | 1 | 1,751,053 | 1 | 122,198 | USA |
| -- | 3,796,742 | -- | 3,531,905 | -- | 264,837 | NAmer | |
| 1 | 5,325 | 1 | 3,424 | 1 | 1,901 | Terr. | |
| 2 | 1,976 | 3 | 182 | 2 | 1,793 | Terr. | |
| 3 | 733 | 4 | 134 | 3 | 599 | Terr. | |
| 4 | 581 | 5 | 76 | 4 | 505 | Terr. | |
| 5 | 571 | 2 | 210 | 5 | 361 | Terr. | |
| Territories | -- | 9,185 | -- | 4,027 | -- | 5,158 | USA |
Total, land & water areas showing states, territories, divisions and regions - total area sort
| Legend |
|---|
| Division totals – 9 divisions for 50 States and DC |
| Region totals – 4 regions ( 2 or 3 divisions each) |
| Individual territories |
| Total U.S. Territorries |
| 50 States + DC and District of Colombia |
| Divisions & regions as defined by U.S. Census Bureau |
| Last col. shows larger region which contains entity in col. 1 |
| State/Territory/ Division/Region |
R a n k |
Total area sqmi. |
R a n k |
Land area sqmi. |
R a n k |
Water area sqmi. |
Geog. sort |
|---|---|---|---|---|---|---|---|
| -- | 3,796,742 | -- | 3,531,905 | -- | 264,837 | NAmer | |
| West | 1 | 1,873,252 | 1 | 1,751,053 | 1 | 122,198 | USA |
| Pacific | 1 | 1,009,687 | 1 | 895,286 | 1 | 114,401 | West |
| South | 2 | 920,446 | 2 | 868,418 | 3 | 52,029 | USA |
| Mountain | 2 | 863,565 | 2 | 855,767 | 8 | 7,798 | West |
| Midwest | 3 | 821,724 | 3 | 750,523 | 2 | 71,202 | USA |
| 1 | 665,384 | 1 | 570,641 | 1 | 94,743 | Pac | |
| West North Central | 3 | 520,356 | 3 | 507,620 | 5 | 12,736 | MWest |
| West South Central | 4 | 444,052 | 4 | 425,066 | 4 | 18,986 | South |
| East North Central | 5 | 301,369 | 6 | 242,902 | 2 | 58,466 | MWest |
| South Atlantic | 6 | 292,990 | 5 | 265,062 | 3 | 27,928 | South |
| 2 | 268,596 | 2 | 261,232 | 8 | 7,365 | WSC | |
| East South Central | 7 | 183,404 | 7 | 178,290 | 9 | 5,114 | South |
| Northeast | 4 | 181,320 | 4 | 161,912 | 4 | 19,408 | USA |
| 3 | 163,695 | 3 | 155,779 | 6 | 7,916 | Pac | |
| 4 | 147,040 | 4 | 145,546 | 26 | 1,494 | Mtn | |
| 5 | 121,590 | 5 | 121,298 | 49 | 292 | Mtn | |
| 6 | 113,990 | 6 | 113,594 | 48 | 396 | Mtn | |
| 7 | 110,572 | 7 | 109,781 | 36 | 791 | Mtn | |
| Mid-Atlantic | 8 | 109,332 | 8 | 99,223 | 6 | 10,109 | NEast |
| 8 | 104,094 | 8 | 103,642 | 44 | 452 | Mtn | |
| 9 | 98,379 | 10 | 95,988 | 20 | 2,391 | Pac | |
| 10 | 97,813 | 9 | 97,093 | 37 | 720 | Mtn | |
| 11 | 96,714 | 22 | 56,539 | 2 | 40,175 | ENC | |
| 12 | 86,936 | 14 | 79,627 | 9 | 7,309 | WNC | |
| 13 | 84,897 | 12 | 82,170 | 17 | 2,727 | Mtn | |
| 14 | 83,569 | 11 | 82,643 | 33 | 926 | Mtn | |
| 15 | 82,278 | 13 | 81,759 | 42 | 520 | WNC | |
| 16 | 77,348 | 15 | 76,824 | 41 | 524 | WNC | |
| 17 | 77,116 | 16 | 75,811 | 29 | 1,305 | WNC | |
| New England | 9 | 71,988 | 9 | 62,688 | 7 | 9,300 | NEast |
| 18 | 71,298 | 20 | 66,456 | 11 | 4,842 | Pac | |
| 19 | 70,698 | 17 | 69,001 | 24 | 1,698 | WNC | |
| 20 | 69,899 | 19 | 68,595 | 30 | 1,304 | WSC | |
| 21 | 69,707 | 18 | 68,742 | 32 | 965 | WNC | |
| 22 | 65,758 | 26 | 53,625 | 3 | 12,133 | SAtl | |
| 23 | 65,496 | 25 | 54,158 | 4 | 11,339 | ENC | |
| 24 | 59,425 | 21 | 57,513 | 22 | 1,912 | SAtl | |
| 25 | 57,914 | 24 | 55,519 | 19 | 2,395 | ENC | |
| 26 | 56,273 | 23 | 55,857 | 45 | 416 | WNC | |
| 27 | 54,555 | 30 | 47,126 | 7 | 7,429 | MdAtl | |
| 28 | 53,819 | 29 | 48,618 | 10 | 5,201 | SAtl | |
| 29 | 53,179 | 27 | 52,035 | 31 | 1,143 | WSC | |
| 30 | 52,420 | 28 | 50,645 | 23 | 1,775 | ESC | |
| 31 | 52,378 | 33 | 43,204 | 5 | 9,174 | WSC | |
| 32 | 48,432 | 31 | 46,923 | 25 | 1,509 | ESC | |
| 33 | 46,054 | 32 | 44,743 | 28 | 1,312 | MdAtl | |
| 34 | 44,826 | 35 | 40,861 | 14 | 3,965 | ENC | |
| 35 | 42,775 | 36 | 39,490 | 15 | 3,285 | SAtl | |
| 36 | 42,144 | 34 | 41,235 | 35 | 909 | ESC | |
| 37 | 40,408 | 37 | 39,486 | 34 | 921 | ESC | |
| 38 | 36,420 | 38 | 35,826 | 39 | 593 | ENC | |
| 39 | 35,380 | 39 | 30,843 | 12 | 4,537 | NEng | |
| 40 | 32,020 | 40 | 30,061 | 21 | 1,960 | SAtl | |
| 41 | 24,230 | 41 | 24,038 | 50 | 192 | SAtl | |
| 42 | 12,406 | 42 | 9,707 | 18 | 2,699 | SAtl | |
| 43 | 10,932 | 47 | 6,423 | 13 | 4,509 | Pac | |
| 44 | 10,554 | 45 | 7,800 | 16 | 2,754 | NEng | |
| 45 | 9,616 | 43 | 9,217 | 46 | 400 | NEng | |
| 46 | 9,349 | 44 | 8,953 | 47 | 397 | NEng | |
| Territories | -- | 9,185 | -- | 4,027 | -- | 5,158 | USA |
| 47 | 8,723 | 46 | 7,354 | 27 | 1,368 | MdAtl | |
| 48 | 5,543 | 48 | 4,842 | 38 | 701 | NEng | |
| 1 | 5,325 | 1 | 3,424 | 1 | 1,901 | Terr. | |
| 49 | 2,489 | 49 | 1,949 | 40 | 540 | SAtl | |
| 2 | 1,976 | 3 | 182 | 2 | 1,793 | Terr. | |
| 50 | 1,545 | 50 | 1,034 | 43 | 511 | NEng | |
| 3 | 733 | 4 | 134 | 3 | 599 | Terr. | |
| 4 | 581 | 5 | 76 | 4 | 505 | Terr. | |
| 5 | 571 | 2 | 210 | 5 | 361 | Terr. | |
| -- | 68 | -- | 61 | -- | 7 | SAtl |
-
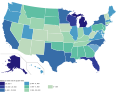
 U.S. states by total area
 -
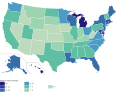
 U.S. states by land area
 -
 U.S. states by water area
 -
 U.S. states by water percentage
 -
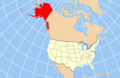 Alaska is the largest state by total area, land area, and water area
 -
 The area of Alaska is 18% of the area of the United States and 21% of the area of the contiguous United States
 -
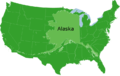
 The second largest state, Texas, is only 40% of the total area of the largest state, Alaska
 -
 Rhode Island is the smallest state by total area and land area
 -
 San Bernardino County is the largest county in the U.S. and is larger than each of the nine smallest states, including larger than the four smallest states combined. (Although some of Alaska's boroughs and census areas are larger, they are not true counties.)
 -
 Michigan is second (after Alaska) in water area, and first in water percentage
 -
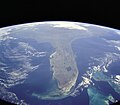 Florida is mostly a peninsula, and has the third largest water area and seventh largest water area percentage


See also
- List of the largest country subdivisions by area
- List of political and geographic subdivisions by total area
Notes
References
- ^ Census 2000 Geographic Terms and Concepts, Census 2000 Geography Glossary, U.S. Census Bureau. Accessed 2007-07-10
- ^ a b c d "United States Summary: 2010, Population and Housing Unit Counts, 2010 Census of Population and Housing" (PDF) (PDF). United States Census Bureau. September 2012. pp. V–2, 1 & 41 (Tables 1 & 18). Retrieved February 7, 2014.
- ^ "United States Summary: 2010, Population and Housing Unit Counts, 2000 Census of Population and Housing" (PDF) (PDF). United States Census Bureau. April 2004. p. 1 (Table 1). Retrieved February 10, 2014.
External links
area at Wikipedia's sister projects
 Definitions from Wiktionary
 Media from Commons
 News from Wikinews
 Quotations from Wikiquote
 Texts from Wikisource
 Textbooks from Wikibooks
 Resources from Wikiversity