
User:John Cummings/Articles/Global Innovation Index
 | |
| Language | English, French, Spanish, Arabic, Chinese, Russian, German, Korean, Portuguese, Japanese |
|---|---|
| Publication details | |
| History | 2007–present |
| Publisher | |
| Frequency | Annual |
| License | CC BY 4.0 |
| Indexing | |
| ISSN | 2263-3693 |
| Links | |
The Global Innovation Index (GII) published by the World Intellectual Property Organization (WIPO) is an annual ranking of countries by their capacity for, and success in, innovation. The GII 2021 measures the most recent global innovation trends and ranks the innovation ecosystem performance of 132 economies, while highlighting innovation strengths and weaknesses and particular gaps in innovation metrics.
Since its inception in 2007, an increasing number of governments systematically analyze their annual GII results and design policy responses to improve their performance.[1][2][3][4][5] The GII has also been recognized by the UN General Assembly in its 2019 resolution on Science, Technology and Innovation for Sustainable Development as a benchmark for measuring innovation in relation to the Sustainable Development Goals (SDGs).[6]
History[edit]
The index was started in 2007 by INSEAD and World Business,[7]: 203 a British magazine. It was created by Prof. Soumitra Dutta.[8] WIPO started its association with the GII in 2011 and began co-publishing the GII in 2012. In 2013, Cornell University joined as co-publisher, with Professor Dutta representing the GII at Cornell University and Bruno Lanvin at INSEAD. The GII continued to be co-published by Cornell University, INSEAD and WIPO up to 2020. As of 2021, the GII is published by WIPO, in partnership with the Portulans Institute, the Confederation of Indian Industry (CII), the Brazilian National Confederation of Industry (CNI), Ecopetrol Group and the Turkish Exporters Assembly (TIM) and is supported by its GII Advisory Board and Academic Network.
Methodology[edit]
The overall GII ranking is built based on two sub-indices that are both equally important in presenting a complete picture of innovation:
- Innovation Input Sub-Index: Five input pillars capture elements of the economy that enable and facilitate innovative activities.
- Innovation Output Sub-Index: Two outputs pillars capture the result of innovative activities within the economy.
Although the Output Sub-Index includes only two pillars, it carries the same weight as the Input Sub-Index in calculating the overall GII. Each of the seven pillars measure an attribute of innovation and is divided into three sub-pillars. Each sub-pillar is composed of up to five individual indicators.
The GII has been criticized for giving excessive significance attributed to factors that aren’t integral to innovation. For instance, “Ease of Paying Taxes“, “Electricity Output“(half-weightage) and “Ease of Protecting Minority Investors” are factors alongside “Ease of Getting Credit” and “Venture Capital Deals“.[9]
-
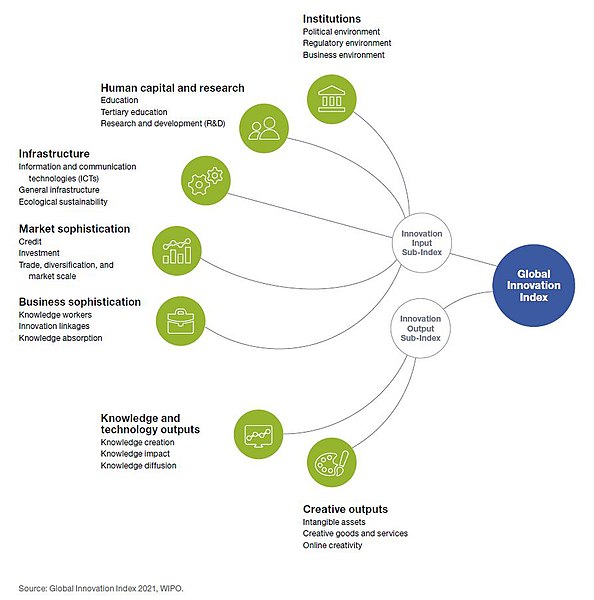 The Global Innovation Index framework shows the different elements that are captured in the Index.

Data[edit]
Around 80 different data indicators related to innovation ecosystems make up the GII. Most indicators are based on factual and objective innovation data from official sources. A few survey data points are also included. In the GII 2021 edition, a total of 81 indicators were derived from several different sources, as listed in the table below.
| Indicator number | Indicator Name | Description | Source | Source Link |
| 1.1.1 | Political and operational stability* | This indicator is an index that measures the likelihood and severity of political, legal, operational or security risks affecting business operations. | IHS Markit, Country Risk Scores. | https://ihsmarkit.com/industry/economics-country-risk.html |
| 1.1.2 | Government effectiveness* | This indicator is an index that reflects perceptions of the quality of public services, the quality of the civil service and the degree of its independence from political pressures, the quality of policy formulation and implementation, and the credibility of the government’s commitment to such policies. | World Bank, Worldwide Governance Indicators. | http://info.worldbank.org/governance/wgi/#home |
| 1.2.1 | Regulatory quality* | This indicator is an index that reflects the perceptions of the ability of the government to formulate and implement sound policies and regulations that permit and promote private-sector development. | World Bank, Worldwide Governance Indicators. | http://info.worldbank.org/governance/wgi/#home |
| 1.2.2 | Rule of law* | This indicator is an index that reflects the perceptions of the extent to which agents have confidence in and abide by the rules of society, and in particular the quality of contract enforcement, property rights, the police, and the courts, as well as the likelihood of crime and violence. | World Bank, Worldwide Governance Indicators. | http://info.worldbank.org/governance/wgi/#home |
| 1.2.3 | Cost of redudancy dismissal | Redundancy costs measure the cost of advance notice requirements and severance payments due when terminating a redundant worker, expressed in weeks of salary. | World Bank, Doing Business 2020, Comparing Business Regulation in 190 Economies. | https://www.doingbusiness.org/en/reports/global-reports/doing-business-2020 |
| 1.3.1 | Ease of starting a business* | This indicator ranks economies based on the procedures officially required, or commonly done in practice, for an entrepreneur to start up and formally operate an industrial or commercial business, as well as the time and cost to complete these procedures and the paid-in minimum capital requirement. | World Bank, Doing Business 2020, Comparing Business Regulation in 190 Economies. | https://www.doingbusiness.org/en/reports/global-reports/doing-business-2020 |
| 1.3.2 | Ease of resolving insolvency* | This indicator ranks economies based on the recovery rate of insolvency proceedings, which is recorded as cents on the dollar recovered by secured creditors through reorganization, liquidation, or debt enforcement (foreclosure or receivership) proceedings. | World Bank, Doing Business 2020, Comparing Business Regulation in 190 Economies. | https://www.doingbusiness.org/en/reports/global-reports/doing-business-2020 |
| 2.1.1 | Expenditure on education, % GDP | Total government expenditure on education, expressed as a percentage of GDP. It includes expenditure funded by transfers from international sources to government. | UNESCO Institute for Statistics; and Eurostat. | http://data.uis.unesco.org |
| 2.1.2 | Government funding/pupil, secondary, % GDP/cap | Average total government expenditure per student, at secondary level, expressed as a percentage of GDP per capita. | UNESCO Institute for Statistics. | http://data.uis.unesco.org |
| 2.1.3 | School life expectancy, years | Total number of years that a person of school entrance age can expect to spend within the primary to tertiary levels of education. | UNESCO Institute for Statistics. | http://data.uis.unesco.org |
| 2.1.4 | PISA scales in reading, maths and science | PISA is the OECD's Programme for International Student Assessment. PISA measures 15-year-olds’ ability to use their reading, mathematics and science knowledge skills. | OECD Programme for International Student Assessment (PISA). | www.pisa.oecd.org |
| 2.1.5 | Pupil-teacher ratio, secondary | The number of pupils enrolled in secondary school divided by the number of secondary school teachers. | UNESCO Institute for Statistics. | http://data.uis.unesco.org |
| 2.2.1 | Tertiary enrolment, % gross | The ratio of total tertiary enrolment, regardless of age, to the population of the age group that officially corresponds to the tertiary level of education. | UNESCO Institute for Statistics. | http://data.uis.unesco.org |
| 2.2.2 | Graduates in science and engineering, % | The share of all tertiary-level graduates in natural sciences, mathematics, statistics, information and technology, manufacturing, engineering, and construction as a percentage of all tertiary-level graduates. | UNESCO Institute for Statistics; Eurostat; and OECD. | http://data.uis.unesco.org; https://ec.europa.eu/eurostat/data/database; https://stats.oecd.org/Index.aspx?DataSetCode=MSTI_PUB |
| 2.2.3 | Tertiary inbound mobility, % | The number of students from abroad studying in a given country as a percentage of the total tertiary-level enrolment in that country. | UNESCO Institute for Statistics. | http://data.uis.unesco.org |
| 2.3.1 | Researchers, FTE/mn pop. | The full-time equivalence (FTE) of researchers in R&D engaged in the conception or creation of new knowledge, per million population. They conduct research and improve or develop concepts, theories, models, techniques, instrumentation, software or operational methods. | UNESCO Institute for Statistics; Eurostat; and OECD. | http://data.uis.unesco.org; https://ec.europa.eu/eurostat/data/database; https://stats.oecd.org/Index.aspx?DataSetCode=MSTI_PUB |
| 2.3.2 | Gross expenditure on R&D, % GDP | Total domestic intramural expenditure on R&D during a given period as a percentage of GDP. | UNESCO Institute for Statistics; Eurostat; and OECD. | http://data.uis.unesco.org; https://ec.europa.eu/eurostat/data/database; https://stats.oecd.org/Index.aspx?DataSetCode=MSTI_PUB |
| 2.3.3 | Global corporate R&D investors, top 3, mn US$ | Average expenditure on R&D of the top three global companies in million US$. | The 2020 EU Industrial R&D Investment Scoreboard | https://iri.jrc.ec.europa.eu/scoreboard/2020-eu-industrial-rd-investment-scoreboard |
| 2.3.4 | QS university ranking, top 3* | Average score of the top three universities according to the Quacquarelli Symonds (QS) university ranking. | QS Quacquarelli Symonds Ltd, QS World University Ranking 2020, Top Universities. | https://www.topuniversities.com/university-rankings/world-university-rankings/2021 |
| 3.1.1 | ICT access* | The ICT access index is a composite index that weights the following five ICT indicators (20% each): (1) Fixed telephone subscriptions per 100 inhabitants; (2) Mobile cellular telephone subscriptions per 100 inhabitants; (3) International Internet bandwidth (bit/s) per Internet user; (4) Percentage of households with a computer; and (5) Percentage of households with Internet access. | GII calculations based on the World Telecommunication/ICT Indicators Database following the methodology of the ITU ICT Development Index 2017. | https://www.itu.int/en/ITU-D/Statistics/Pages/publications/mis2017.aspx |
| 3.1.2 | ICT use* | The ICT use index is a composite index that weights the following three ICT indicators (one third each): (1) Percentage of individuals using the Internet; (2) Fixed (wired) broadband Internet subscriptions per 100 inhabitants; (3) Active mobile broadband subscriptions per 100 inhabitants. | GII calculations based on the World Telecommunication/ICT Indicators Database following the methodology of the ITU ICT Development Index 2017. | https://www.itu.int/en/ITU-D/Statistics/Pages/publications/mis2017.aspx |
| 3.1.3 | Government's online service* | This indiactor is a composite indicator measuring the use of ICTs by governments in delivering public services at the national level. | United Nations Public Administration Network, E-Government Survey. | https://publicadministration.un.org/egovkb/en-us/Reports/UN-E-Government-Survey-2020 |
| 3.1.4 | E-participation* | This indiactor is a composite indicator measuring government use of online services in providing information to its citizens or “e-information sharing”, interacting with stakeholders or “e-consultation” and engaging in decision-making processes or “e-decision-making”. | United Nations Public Administration Network, E-Government Survey. | https://publicadministration.un.org/egovkb/en-us/Reports/UN-E-Government-Survey-2020 |
| 3.2.1 | Electricity output, GWh/mn pop. | Electricity production measured at the terminals of all alternator sets in a station, covering electricity generated by: hydropower, coal, oil, gas, nuclear power, geothermal, solar, wind, tide, wave energy, as well as that from combustible renewables and waste. | International Energy Agency (IEA), World Energy Balances. | https://www.iea.org/reports/world-energy-balances-overview |
| 3.2.2 | Logistics performance* | A multidimensional assessment of logistics performance, the Logistics Performance Index (LPI) ranks countries combining data on six core performance components—including customs performance, infrastructure quality, and timeliness of shipments. | World Bank and Turku School of Economics, Logistics Performance Index. | https://openknowledge.worldbank.org/bitstream/handle/10986/29971/LPI2018.pdf |
| 3.2.3 | Gross capital formation, % GDP | Gross capital formation is expressed as the ratio of total investment in current local currency to GDP in current local currency. | International Monetary Fund, World Economic Outlook Database. | https://www.imf.org/en/Publications/SPROLLs/world-economic-outlook-databases |
| 3.3.1 | GDP/unit of energy use | Purchasing power parity gross domestic product (PPP$ GDP) per per total energy supply. | International Energy Agency (IEA) World Energy Balances 2020 edition. | https://www.iea.org/reports/world-energy-balances-overview |
| 3.3.2 | Environmental performance* | This indicator is an index that provides a gauge on how close countries are to established environmental policy targets. | Yale University and Columbia University 2020, Environmental Performance Index. | https://epi.yale.edu/epi-results/2020/component/epi |
| 3.3.3 | ISO 14001 environmental certificates/bn PPP$ GDP | Number of ISO 14001 certificates issued, per billion PPP$ GDP. ISO 14001 certified means that an organization meets the requirements for an environmental management system that enhances its environmental performance. | International Organization for Standardization, ISO Survey of Certifications to Management System Standards. | https://www.iso.org/the-iso-survey.html |
| 4.1.1 | Ease of getting credit* | This indicator ranks economies on their ease of getting credit based on the legal rights of borrowers and lenders (collateral and bankruptcy laws) as well as the coverage, scope, and accessibility of credit information available through credit reporting service providers. | World Bank, Doing Business 2020, Comparing Business Regulation in 190 Economies. | https://www.doingbusiness.org/en/reports/global-reports/doing-business-2020 |
| 4.1.2 | Domestic credit to private sector, % GDP | Domestic credit to private sector as a percentage of GDP. Domestic credit to private sector refers to financial resources provided to the private sector by financial corporations, such as through loans, purchases of non-equity securities, and trade credits and other accounts receivable, that establish a claim for repayment. This indicator is scaled | World Bank’s World Development Indicators database. | http://data.worldbank.org |
| 4.1.3 | Microfinance gross loans, % GDP | Combined gross loan balances of microfinance institution (current US$) in a country as a percentage of its GDP (current US$). | Microfinance Information Exchange, MIX Market database. | https://datacatalog.worldbank.org/dataset/mix-market |
| 4.2.1 | Ease of protecting minority investors* | This indicator ranks economies on the extent of conflict of interest regulation (protection of shareholders against directors’ misuse of corporate assets) and the extent of shareholder governance (shareholders’ rights in corporate governance). | World Bank, Doing Business 2020, Comparing Business Regulation in 190 Economies. | https://www.doingbusiness.org/en/reports/global-reports/doing-business-2020 |
| 4.2.2 | Market capitalization, % GDP | Market capitalization as a percentage of GDP. Market capitalization (also known as ‘market value’) is the share price times the number of shares outstanding. | World Federation of Exchanges database; extracted from the World Bank’s World Development Indicators database. | https://www.world-exchanges.org/our-work/statistics; http://data.worldbank.org |
| 4.2.3 | Venture capital investors, deals/bn PPP$ GDP | The number of venture capital deals (worldwide) that firms of an economy invested in per billion PPP$ GDP. | Refinitiv, Eikon (private equity screener). | https://solutions.refinitiv.com/eikon-trading-software |
| 4.2.4 | Venture capital recipients, deals/bn PPP$ GDP | The number of venture capital deals (worldwide) that firms of an economy received per billion PPP$ GDP. | Refinitiv, Eikon (private equity screener). | https://solutions.refinitiv.com/eikon-trading-software |
| 4.3.1 | Applied tariff rate, weighted avg., % | Applied tariff rates weighted by the product import shares corresponding to each partner country. | Source: World Bank, based on data from United Nations Conference on Trade and Development’s (UNCTAD) Trade Analysis and Information System (TRAINS) database and the World Trade Organization’s (WTO) Integrated Database (IDB) and Consolidated Tariff Schedules (CTS) Database; extracted from World Bank’s World Development Indicators database. | http://data.worldbank.org/ |
| 4.3.2 | Domestic industry diversification | Herfindahl-Hirschman Index (HHI) for the domestic industry defined as the sum of the squared shares of sub-sectors in total manufacturing output. | United Nations Industrial Development Organization (UNIDO), Industrial Statistics Database. | http://stat.unido.org; www.equip-project.org/wp-content/uploads/2015/08/EQuIP_Tool-4_V150821.pdf |
| 4.3.3 | Domestic market scale, bn PPP$ | The domestic market size is measured by GDP based on the PPP valuation of country GDP, in current international dollars (billions). | International Monetary Fund, World Economic Outlook Database. | https://www.imf.org/en/Publications/SPROLLs/world-economic-outlook-databases |
| 5.1.1 | Knowledge-intensive employment, % | Sum of people employment in knowledge-intensive services as a percentage of total people employed. | International Labour Organization ILOSTAT Database of Labour Statistics. | www.ilo.org/ilostat |
| 5.1.2 | Firms offering formal training, % | The percentage of firms offering formal training programs for their permanent, full-time employees as a percentage of the sample of firms in the World Bank’s Enterprise Survey. | World Bank, Enterprise Surveys. | www.enterprisesurveys.org |
| 5.1.3 | GERD performed by business, % GDP | Gross expenditure on R&D performed by business enterprise as a percentage of GDP. | UNESCO Institute for Statistics; Eurostat; and OECD. | http://data.uis.unesco.org; https://ec.europa.eu/eurostat/data/database; https://stats.oecd.org/Index.aspx?DataSetCode=MSTI_PUB |
| 5.1.4 | GERD financed by business, % | Gross expenditure on R&D financed by business enterprise as a percentage of total gross expenditure on R&D. | UNESCO Institute for Statistics; Eurostat; and OECD. | http://data.uis.unesco.org; https://ec.europa.eu/eurostat/data/database; https://stats.oecd.org/Index.aspx?DataSetCode=MSTI_PUB |
| 5.1.5 | Females employed w/advanced degrees, % | The percentage of females employed with advanced degrees out of total employed. | International Labour Organization and Statistics Canada. | www.ilo.org/ilostat/; https://www150.statcan.gc.ca/t1/tbl1/en/tv.action?pid=1410002001 |
| 5.2.1 | University-industry R&D collaboration† | Based on the survey question: In your country, to what extent do businesses and universities collaborate on research and development (R&D)? | World Economic Forum, Executive Opinion Survey 2020. | www3.weforum.org/docs/WEF_TheGlobalCompetitivenessReport2020.pdf |
| 5.2.2 | State of cluster development and depth† | Based on the survey question: In your country, how widespread are well-developed and deep clusters (geographic concentrations of firms, suppliers, producers of related products and services, and specialized institutions in a particular field)? | World Economic Forum, Executive Opinion Survey 2020. | www3.weforum.org/docs/WEF_TheGlobalCompetitivenessReport2020.pdf |
| 5.2.3 | GERD financed by abroad, % GDP | Percentage of gross expenditure on R&D financed by abroad—that is, with foreign financing as a percentage of GDP. | UNESCO Institute for Statistics; Eurostat; and OECD. | http://data.uis.unesco.org; https://ec.europa.eu/eurostat/data/database; https://stats.oecd.org/Index.aspx?DataSetCode=MSTI_PUB |
| 5.2.4 | Joint venture/strategic alliance deals/bn PPP$ GDP | The number of joint ventures and strategic alliances deals made (fractional counting by each company participating in a deal) per billion PPP$ GDP. | Refinitive, SDC Platinum database. | https://www.refinitiv.com/en/financial-data/deals-data/joint-venture-deals |
| 5.2.5 | Patent families/bn PPP$ GDP | Number of patent families filed in at least two offices by residents of an economy. | World Intellectual Property Organization, Intellectual Property Statistics. | www.wipo.int//ipstats/ |
| 5.3.1 | Intellectual property payments, % total trade | Charges for the use of intellectual property as a percent of total trade. | World Trade Organization, Trade in Commercial Services database, values based on the classification of the sixth (2009) edition of the International Monetary Fund’s Balance of Payments and International Investment Position Manual and Balance of Payments database. | https://www.imf.org/external/pubs/ft/bop/2007/pdf/bpm6.pdf; www.oecd.org/std/its/EBOPS-2010.pdf |
| 5.3.2 | High-tech imports, % total trade | High-technology imports as a percentage of total trade. | World Trade Organization, United Nations, Comtrade Database; Eurostat, Annex 5: High-tech aggregation by SITC Rev. 4, April 2009. | http://comtrade.un.org; http://ec.europa.eu/eurostat/cache/metadata/Annexes/htec_esms_an5.pdf |
| 5.3.3 | ICT services imports, % total trade | Telecommunications, computer and information services imports as a percentage of total trade. | World Trade Organization, Trade in Commercial Services database, values based on the classification of the sixth (2009) edition of the International Monetary Fund’s Balance of Payments and International Investment Position Manual and Balance of Payments database. | https://www.imf.org/external/pubs/ft/bop/2007/pdf/bpm6.pdf; www.oecd.org/std/its/EBOPS-2010.pdf |
| 5.3.4 | FDI net inflows, % GDP | This data series shows net inflows (new investment inflows less disinvestment) in the reporting economy from foreign investors, and is divided by GDP. | International Monetary Fund, International Financial Statistics and Balance of Payments databases, World Bank, International Debt Statistics, and World Bank and OECD GDP estimates; extracted from the World Bank’s World Development Indicators database. | http://data.worldbank.org |
| 5.3.5 | Research talent, % in businesses | The full-time equivalence (FTE) of researchers in the business enterprise sector engaged in the conception or creation of new knowledge, products, processes, methods, and systems, as well as in the management of these projects, broken down by the sectors in which they are employed. | UNESCO Institute for Statistics; Eurostat; and OECD. | http://data.uis.unesco.org; https://ec.europa.eu/eurostat/data/database; https://stats.oecd.org/Index.aspx?DataSetCode=MSTI_PUB |
| 6.1.1 | Patents by origin/bn PPP$ GDP | Number of resident patent applications filed at a given national or regional patent office per billion PPP$ GDP. | World Intellectual Property Organization, Intellectual Property Statistics. | www.wipo.int/ipstats |
| 6.1.2 | PCT patents by origin/bn PPP$ GDP | Number of international patent applications filed by residents at the Patent Cooperation Treaty per billion PPP$ GDP. | World Intellectual Property Organization, Intellectual Property Statistics. | www.wipo.int/ipstats |
| 6.1.3 | Utility models by origin/bn PPP$ GDP | Number of utility model applications filed by residents at the national patent office per billion PPP$ GDP. | World Intellectual Property Organization, Intellectual Property Statistics. | www.wipo.int/ipstats |
| 6.1.4 | Scientific and technical articles/bn PPP$ GDP | Number of scientific and technical journal articles published per billion PPP$ GDP. | Clarivate, Web of Science. | https://clarivate.com/webofsciencegroup/solutions/web-of-science |
| 6.1.5 | Citable documents H-index | The H-index is an economy's number of published articles (H) that have received at least H citations. | SCImago (2021) SJR - SCImago Journal & Country Rank. | www.scimagojr.com |
| 6.2.1 | Labor productivity growth, % | Growth rate of real GDP per person employed, which provides a measure of labor productivity (defined as output per unit of labor input). | The Conference Board Total Economy Database™ Output, Labor and Labor Productivity. | https://www.conference-board.org/data/economydatabase |
| 6.2.2 | New businesses/th pop. 15–64 | Number of newly registered corporations per 1,000 persons of working-age (15–64 years old). | World Bank, Doing Business 2020. | https://www.doingbusiness.org/en/data/exploretopics/entrepreneurship |
| 6.2.3 | Software spending, % GDP | Computer software spending as a percentage of GDP. Computer software spending includes the total value of purchased or leased packaged software, such as operating systems, database systems, programming tools, utilities and applications. | IHS Markit, Information and Communication Technology Database. | https://www.ihs.com/index.html |
| 6.2.4 | ISO 9001 quality certificates/bn PPP$ GDP | Number of ISO 9001 certificates issued, per billion PPP$ GDP. A ISO 9001 certificate demonstrates an organization's ability to provide products and services that meet both customer and applicable statutory and regulatory requirements. | International Organization for Standardization (ISO), ISO Survey of Certifications to Management System Standards. | https://www.iso.org/the-iso-survey.html |
| 6.2.5 | High-tech manufacturing, % | High-technology and medium-high-technology output as a percentage of total manufacturing output. | United Nations Industrial Development Organization,(UNIDO), Industrial Statistics Database. | https://stat.unido.org |
| 6.3.1 | Intellectual property receipts, % total trade | Charges for the use of intellectual property (i.e., receipts) as a percentage of total trade. | World Trade Organization, Trade in Commercial Services database. | https://www.imf.org/external/pubs/ft/bop/2007/pdf/bpm6.pdf; www.oecd.org/std/its/EBOPS-2010.pdf |
| 6.3.2 | Production and export complexity | Based on an index that ranks economies according to the diversity and complexity of their export basket. High complexity countries are home to a range of sophisticated, specialized capabilities and are therefore able to produce a highly diversified set of complex products. | The Atlas of Economic Complexity, Growth Lab at Harvard University. | https://atlas.cid.harvard.edu |
| 6.3.3 | High-tech exports, % total trade | High-technology exports as a percentage of total trade. | World Trade Organization, United Nations, Comtrade database; Eurostat; and Trade Data Monitor (TDM). | http://comtrade.un.org/; https://tradedatamonitor.com; https://ec.europa.eu/eurostat/cache/metadata/Annexes/htec_esms_an5.pdf |
| 6.3.4 | ICT services exports, % total trade | Telecommunications, computer and information services as a percentage of total trade. | World Trade Organization, Trade in Commercial Services database. | https://www.imf.org/external/pubs/ft/bop/2007/pdf/bpm6.pdf; www.oecd.org/std/its/EBOPS-2010.pdf |
| 7.1.1 | Trademarks by origin/bn PPP$ GDP | Number of classes in resident trademark applications issued at a given national or regional office (per billion PPP$ GDP) | World Intellectual Property Organization, Intellectual Property Statistics. | www.wipo.int//ipstats |
| 7.1.2 | Global brand value, top 5,000, % GDP | Sum of global brand values of the top 5,000 brands as a percentage of GDP. | Brand Finance | https://brandirectory.com; https://brandfinance.com/knowledge-centre |
| 7.1.3 | Industrial designs by origin/bn PPP$ GDP | Number of designs contained in industrial design applications filed at a given national or regional office (per billion PPP$ GDP). Industrial designs are exclusive rights that protect the ornamental or aesthetic aspect of products. | World Intellectual Property Organization, Intellectual Property Statistics. | www.wipo.int//ipstats |
| 7.1.4 | ICTs and organizational model creation† | Average answer to the question: In your country, to what extent do ICTs enable new organizational models (e.g., virtual teams, remote working, telecommuting) within companies? [1 = not at all; 7 = to a great extent] | World Economic Forum, Executive Opinion Survey 2019. | www3.weforum.org/docs/WEF_GCR_2019_Appendix_B.pdf |
| 7.2.1 | Cultural and creative services exports, % total trade | Creative services exports as a percentage of total exports according to the Extended Balance of Payments Services Classification EBOPS 2010. | World Trade Organization, Trade in Commercial Services database. | https://timeseries.wto.org |
| 7.2.2 | National feature films/mn pop. 15–69 | Number of national feature films produced per million population aged 15–69 years old. | UNESCO Institute for Statistics (UIS) online database. | http://data.uis.unesco.org |
| 7.2.3 | Entertainment and media market/th pop. 15–69 | Consumer and advertising spending per thousand population aged 15–69 years old. | PwC, Global Entertainment and Media Outlook. | http://www.pwc.com/outlook |
| 7.2.4 | Printing and other media, % manufacturing | Printing and reproduction of recorded media output as a percentage of total manufacturing output. | United Nations Industrial Development Organization, Industrial Statistics Database. | https://stat.unido.org |
| 7.2.5 | Creative goods exports, % total trade | Total value of creative goods exports (current US$) over total trade. | United Nations, Comtrade database; 2009 UNESCO Framework for Cultural Statistics, Table 3, International trade of cultural goods and services based on the 2007 Harmonised System (HS 2007); World Trade Organization, Trade in Commercial Services database, itself based on the sixth (2009) edition of the International Monetary Fund’s Balance of Payments and International Investment Position Manual and Balance of Payments database. | http://comtrade.un.org; http://uis.unesco.org/sites/default/files/documents/measuring-cultural-participation-2009-unesco-framework-for-cultural-statistics-handbook-2-2012-en.pdf; https://www.wto.org/english/res_e/statis_e/tradeserv_stat_e.htm; https://www.oecd.org/sdd/its/EBOPS-2010.pdf |
| 7.3.1 | Generic top-level domains (TLDs)/th pop. 15–69 | Generic top-level domains (e.g. .biz, .info, .org, .net and .com) per thousand population aged 15–69 years old. | ZookNIC Inc. | www.zooknic.com |
| 7.3.2 | Country-code TLDs/th pop. 15–69 | Country-code top-level domains (e.g. .ch, .de, .fr) per thousand population aged 15–69 years old. | ZookNIC Inc. | www.zooknic.com |
| 7.3.3 | Wikipedia edits/mn pop. 15–69 | Wikipedia yearly page edits per million population aged 15–69 years old. | Wikimedia Foundation. | https://wikimediafoundation.org |
| 7.3.4 | Mobile app creation/bn PPP$ GDP | Global downloads of mobile apps, by origin of the headquarters of the developer/firm, scaled by PPP$ GDP (billions). | App Annie Intelligence. | https://www.appannie.com |
Themes[edit]
Every two years the GII covers a theme related to innovation which goes beyond the innovation rankings. In 2020, the theme was “Who will finance innovation?” shedding light on the state of innovation financing by investigating the evolution of existing mechanisms and pointing to progress and remaining challenges. Previous GII themes covered health innovation, environmental innovation, agricultural and food innovation, and others.[10]
Ranking[edit]
The top 50 ranking for 2021:[11]
See also[edit]
References[edit]
- ^ The Philippine Innovation Act declares the GII as a measure of innovation: https://neda.gov.ph/wp-content/uploads/2019/12/RA-11293-or-the-Philippine-Innovation-Act.pdf. This document in html format is here: https://lawphil.net/statutes/repacts/ra2019/ra_11293_2019.html
- ^ In July 2021, the Intellectual Property Strategy Headquarters under the Prime Minister's Office in Japan decided on the Intellectual Property Promotion Plan 2021, setting forth a plan of annual action related to intellectual property for all ministries and agencies. In the first part of the plan, WIPO's GII is cited (p.5):https://www.kantei.go.jp/jp/singi/titeki2/kettei/chizaikeikaku20210713.pdf
- ^ The GII is also cited throughout the official Malaysian Government report, the Twelfth Malaysia Plan (RMK12): https://rmke12.epu.gov.my/en.
- ^ The Vietnamese Government makes reference to the GII in its resolution No. 01/NQ-CP dated January 2021 on solutions for implementation of socio economic development plan in 2021: https://english.luatvietnam.vn/resolution-no-01-nq-cp-dated-january-01-2021-of-the-government-on-major-tasks-and-solutions-guiding-the-realization-of-the-socio-economic-developmen-196535-Doc1.html
- ^ "UK ranked as world-leader in innovation". Department for Business, Innovation & Skills. 17 September 2015. Retrieved 15 July 2016.
- ^ United Nations General Assembly resolution: https://undocs.org/en/A/RES/74/229
- ^ Jean-Eric Aubert (editor) (2010). Innovation Policy: A Guide for Developing Countries. Washington, DC: World Bank. ISBN 9780821382691.
- ^ "2021-2022 Academic Partners for the Global Innovation Index". Portulans Institute. Retrieved 29 July 2021.
- ^ Dašić, Predrag; Dašić, Jovan; Antanasković, Dejan; Pavićević, Nina (2020). Karabegović, Isak (ed.). "Statistical Analysis and Modeling of Global Innovation Index (GII) of Serbia". New Technologies, Development and Application III. Lecture Notes in Networks and Systems. Cham: Springer International Publishing: 515–521. doi:10.1007/978-3-030-46817-0_59. ISBN 978-3-030-46817-0.
- ^ https://www.wipo.int/publications/en/series/index.jsp?id=129
- ^ GII 2021 Report
Further reading[edit]
- Global innovation rankings: The innovation game. The Economist. September 17, 2015.