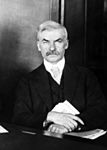
1928 Democratic Party presidential primaries
Appearance
| |||||||||||||||||||||||||||||||||||||||||||||||
| |||||||||||||||||||||||||||||||||||||||||||||||
| |||||||||||||||||||||||||||||||||||||||||||||||
From March 6 to May 18, 1928, voters of the Democratic Party chose its nominee for president in the 1928 United States presidential election.[1] New York Governor Al Smith was selected as the nominee through a series of primary elections and caucuses culminating in the 1928 Democratic National Convention held June 26–28, 1928, in Houston, Texas.
Primaries
| Al Smith |
James Reed |
Evans Woollen |
Thomas Walsh |
Gilbert Hitchcock |
Atlee Pomerene |
Victor Donahey |
Uncommitted | Others | ||
| March 6 | South Dakota (Caucus) |
51.56% (43,876) |
- | - | 48.44% (41,213) |
- | - | - | - | - |
| March 13 | New Hampshire (Primary) |
100.00% (9,716) |
- | - | - | - | - | - | - | - |
| March 20 | North Dakota (Primary) |
100.00% (10,822) |
- | - | - | - | - | - | - | - |
| April 2 | Michigan (Primary) |
98.27% (77,276) |
0.41% (324) |
- | 1.32% (1,034) |
- | - | - | - | - |
| April 3 | Wisconsin (Primary) |
23.88% (W) (19,781) |
73.76% (61,097) |
- | 0.65% (W) (541) |
- | - | - | - | 1.70% (W) (1,410) |
| April 10 | Illinois (Primary) |
90.77% (W) (44,212) |
7.77% (W) (3,786) |
- | 0.45% (W) (221) |
- | - | - | - | 1.01% (W) (490) |
| Nebraska (Primary) |
8.53% (W) (4,755) |
- | - | - | 91.48% (W) (51,019) |
- | - | - | - | |
| April 24 | Ohio (Primary) |
64.89% (42,365) |
- | - | - | - | 21.38% (13,957) |
12.15% (7,935) |
- | - |
| April 28 | Massachusetts (Primary) |
98.11% (W) (38,081) |
- | - | 0.65% (W) (254) |
- | - | - | - | 1.23% (W) (478) |
| May 1 | California (Primary) |
55.74% (134,471) |
24.87% (60,004) |
- | 19.39% (46,770) |
- | - | - | - | - |
| May 7 | Indiana (Primary) |
- | - | 100.00% (146,934) |
- | - | - | - | - | - |
| May 8 | Alabama (Primary) |
- | - | - | - | - | - | - | 100.00% (138,957) |
- |
| May 15 | New Jersey (Primary) |
99.03% (28,506) |
0.31% (W) (88) |
- | - | - | - | - | - | 0.66% (W) (190) |
| May 18 | Oregon (Primary) |
48.51% (17,444) |
17.69% (6,360) |
- | 31.35% (11,272) |
- | - | - | - | - |
| May 22 | South Dakota (Primary) |
100.00% (6,221) |
- | - | - | - | - | - | - | - |
| May 29 | West Virginia (Primary) |
50.05% (81,739) |
46.41% (75,796) |
- | - | - | - | - | - | 31.35% (11,272) |
| June 5 | Florida (Primary) |
- | - | - | - | - | - | - | 100.00% (108,167) |
- |
| Legend: | 1st place (popular vote) |
2nd place (popular vote) |
3rd place (popular vote) |
Candidate has Withdrawn or Ceased Campaigning |
(W) - Votes are Write-In |
|---|
See also
References
- ^ Kalb, Deborah (2016-02-19). Guide to U.S. Elections - Google Books. ISBN 9781483380353. Retrieved 2016-02-19.


