
Talk:Climate change: Difference between revisions
→More discussion of food and health: Placing much of the discussion into collapsable boxes to hopefully focus other editors onto the latest proposals alone. |
|||
| Line 649: | Line 649: | ||
:Btw, my suggestion now has a word count of 231 vs the current 243. [[User:Bogazicili|Bogazicili]] ([[User talk:Bogazicili|talk]]) 16:58, 11 March 2024 (UTC) |
:Btw, my suggestion now has a word count of 231 vs the current 243. [[User:Bogazicili|Bogazicili]] ([[User talk:Bogazicili|talk]]) 16:58, 11 March 2024 (UTC) |
||
::Is this the same suggestion that InformationToKnowledge would put forward, or is the problem that both of you have different preferred versions that you're putting forward? Also, when you made the proposed changes, did you keep in mind reading ease aspects? E.g. this is perhaps using unnecessarily complex words: {{tq|Climate change is projected to adversely impact water-related illnesses}}. Or perhaps the argument is: let's agree on content first and do the wordsmithing later? [[User:EMsmile|EMsmile]] ([[User talk:EMsmile|talk]]) 21:44, 11 March 2024 (UTC) |
::Is this the same suggestion that InformationToKnowledge would put forward, or is the problem that both of you have different preferred versions that you're putting forward? Also, when you made the proposed changes, did you keep in mind reading ease aspects? E.g. this is perhaps using unnecessarily complex words: {{tq|Climate change is projected to adversely impact water-related illnesses}}. Or perhaps the argument is: let's agree on content first and do the wordsmithing later? [[User:EMsmile|EMsmile]] ([[User talk:EMsmile|talk]]) 21:44, 11 March 2024 (UTC) |
||
:::Yes, the whole issue is that tend to disagree on every other sentence, so there have been about three waves of differing proposals from either of us by now. I have hidden the discussion about those three by now, so that the other editors can still click on the boxes to read them, but would otherwise focus their attention on the latest proposals for the section. You can see Bogazicili's proposal above, and my proposal is here. Since the former proposal already shows the original's section text in the struck-out sections, I decided not to duplicate that, and only to bold the writing that is mine: |
|||
{| style="background:yellow; color: black" |
|||
| |
|||
The World Health Organization (WHO) calls climate change the greatest threat to global health in the 21st century. '''It''' has estimated that between 2030 and 2050, climate change would cause around 250,000 additional deaths per year due to '''impacts such as increased levels of extreme heat, greater frequency of extreme weather and changes in disease transmission.''' '''Lethal infectious diseases such as dengue fever and malaria are more easily transmitted in a warmer climate.'''[231] '''30% of the global population currently live in areas where extreme heat and humidity can be potentially lethal,''' ([https://www.carbonbrief.org/billions-face-deadly-threshold-heat-extremes-2100-study/ CB reference]) '''particularly to children and the elderly.'''[233] '''By 2100, 50% to 75% of the global population would live in such areas.'''[235] |
|||
'''Agricultural and socioeconomic changes had been increasing global crop yields since the middle of the 20th century,''' [Our World in Data reference] '''but climate change has already slowed the rate of yield growth.'''[IPCC AR6 WG2 Summary for Policymakers p.9] Fisheries have been negatively affected in various regions.[IPCC AR6 WG2 Summary for Policymakers p.9] '''By 2050, the number of people suffering from undernourishment and the associated health conditions is likely to decrease by tens to hundreds of millions, but some combinations of severe climate change and low socioeconomic development may increase that number instead.''' ([https://www.nature.com/articles/s43016-021-00322-9 2021 meta-analysis]) '''By 2050, global livestock headcounts could decline by 7-10% under higher warming, as less animal feed will be available.'''[IPCC AR6 WG2 p.748] '''Extreme weather events adversely affect both food and water security, and climate change increases their frequency.'''[IPCC AR6 WG2 Summary for Policymakers p.9][230] '''If the emissions remain high, food availability will likely decrease after 2050 due to diminishing fisheries and livestock counts, and due to more frequent and severe crop failures.'''[IPCC AR6 WG2 p.797] |
|||
|} |
|||
Basically, these are the main things we have been arguing about for the past two months or so, and what the rest of editors here can ''hopefully'' decide on without invoking outside mechanisms: |
|||
1) We both agree that the WHO's mortality increase should be mentioned in the first paragraph, '''but how much detail to devote to each cause'''? You can see that Bogazicili favours more writing there, and I favour less. I find that sentences like "Extreme weather events affect public health. Temperature extremes lead to increased illness and death..." are too general and colourless to be of much use, and phrasing like "transmission risk of ''various'' diseases...Climate change ''is projected to adversely impact water-related illnesses''." is outright confusing. I also find that mentioning WHO's words once, then writing several general sentences, then doubling back to WHO with a sentence running through each cause is outright duplicative at times. |
|||
2) Best way to phrase the sentence which discusses that finding on "life-threatening conditions" and extreme heat/humidity. You can probably just compare the two versions. |
|||
3) How explicitly to note that crop yields, etc. have been increasing to date? I also use "Extreme weather events adversely affect both food and water security" later in the article instead of "climate change has reduced water and food security" in Bogazicili's proposal, because I both find it closer to the reference, and because the other wording is unclear. "climate change has reduced water and food security" '''relative to what'''? A specific year in our recent past, or a counterfactual where climate change has not been happening? If we can't explain a particular wording in the paragraph text, we should not use it. |
|||
4) Do we need to talk about latitudes ''in this particular article'', as opposed to the sub-articles? I would say that when the wording is as vague as "various high latitude areas", it's best not to bother. |
|||
5) Do we need to mention livestock, a massively important part of food production in many countries? I believe so, but Bogazicili is apparently unconvinced. |
|||
6) How explicit should we be about projections for mid-century? I find that Bogazicili's wording is far too confusing for this article and does not properly represent the reference chosen, as opposed to my wording. |
|||
7) How to talk about food security, etc. in the second half of the century? One issue we have been arguing is that Bogazicili chooses to use 2040 because WG2 SPM is separated into near-term (2022-2040) and 2040-2100 sections, but almost everything else uses 2050, '''including''' the relevant chapter of WG2. However, there have been other disagreements, as you can probably tell from the differences in wording. |
|||
I find that these are the 7 main questions other editors should comment on. [[User:InformationToKnowledge|InformationToKnowledge]] ([[User talk:InformationToKnowledge|talk]]) 17:45, 12 March 2024 (UTC) |
|||
== Should the effects collage be restored to the lead? == |
== Should the effects collage be restored to the lead? == |
||
Revision as of 17:45, 12 March 2024
| This is the talk page for discussing improvements to the Climate change article. This is not a forum for general discussion of the article's subject. |
Article policies
|
| Find sources: Google (books · news · scholar · free images · WP refs) · FENS · JSTOR · TWL |
| The contentious topics procedure applies to this page. This page is related to climate change, which has been designated as a contentious topic. Editors who repeatedly or seriously fail to adhere to the purpose of Wikipedia, any expected standards of behaviour, or any normal editorial process may be blocked or restricted by an administrator. Editors are advised to familiarise themselves with the contentious topics procedures before editing this page. |
 | Climate change is a featured article; it (or a previous version of it) has been identified as one of the best articles produced by the Wikipedia community. Even so, if you can update or improve it, please do so. | |||||||||||||||||||||||||||
| This article appeared on Wikipedia's Main Page as Today's featured article on June 21, 2006, and on October 31, 2021. | ||||||||||||||||||||||||||||
| ||||||||||||||||||||||||||||
| This page is not a forum for general discussion about Climate change. Any such comments may be removed or refactored. Please limit discussion to improvement of this article. You may wish to ask factual questions about Climate change at the Reference desk. |
Frequently asked questions
Q1: Is there really a scientific consensus on climate change?
A1: Yes. The IPCC findings of recent warming as a result of human influence are explicitly recognized as the "consensus" scientific view by the science academies of all the major industrialized countries. No scientific body of national or international standing presently rejects the basic findings of human influence on recent climate. This scientific consensus is supported by over 99% of publishing climate scientists.[1]
Q2: How can we say climate change is real when it's been so cold in such-and-such a place?
A2: This is why it is termed "global warming", not "(such-and-such a place) warming". Even then, what rises is the average temperature over time – that is, the temperature will fluctuate up and down within the overall rising trend. To give an idea of the relevant time scales, the standard averaging period specified by the World Meteorological Organisation (WMO) is 30 years. Accordingly, the WMO defines climate change as "a statistically significant variation in either the mean state of the climate or in its variability, persisting for an extended period (typically decades or longer)."[2] Q3: Can't the increase of CO2 be from natural sources, like volcanoes or the oceans?
A3: While these claims are popular among global warming skeptics,[3][4] including academically trained ones,[5][6] they are incorrect. This is known from any of several perspectives:
Q4: I think the article is missing some things, or has some things wrong. Can I change it?
A4: Yes. Keep in mind that your points need to be based on documented evidence from the peer-reviewed literature, or other information that meets standards of verifiability, reliability, and no original research. If you do not have such evidence, more experienced editors may be able to help you find it (or confirm that such evidence does not exist). You are welcome to make such queries on the article's talk page but please keep in mind that the talk page is for discussing improvements to the article, not discussing the topic. There are many forums that welcome general discussions of global warming, but the article talk page is not such a forum. Q5: Why haven't the graphs been updated?
A5: Two reasons:
Q6: Isn't climate change "just a theory"?
A6: People who say this are abusing the word "theory" by conflating its common meaning with its scientific meaning.
In common usage, "theory" can mean a hunch or guess, but a scientific theory, roughly speaking, means a coherent set of explanations that is compatible with observations and that allows predictions to be made. That the temperature is rising is an observation. An explanation for this (also known as a hypothesis) is that the warming is primarily driven by greenhouse gases (such as CO2 and methane) released into the atmosphere by human activity. Scientific models have been built that predict the rise in temperature and these predictions have matched observations. When scientists gain confidence in a hypothesis because it matches observation and has survived intense scrutiny, the hypothesis may be called a "theory". Strictly speaking, scientific theories are never proven, but the degree of confidence in a theory can be discussed. The scientific models now suggest that it is "extremely likely" (>95%) to "virtually certain" (>99%) that the increases in temperature have been caused by human activity as discussed in the IPCC Fifth Assessment Report. Global warming via greenhouse gases by human activity is a theory (in the scientific sense), but it is most definitely not just a hunch or guess. Q7: Does methane cause more warming than CO2?
A7: It's true that methane is more potent molecule for molecule. But there's far less of it in the atmosphere, so the total effect is smaller. The atmospheric lifetime of methane (about 10 years) is a lot shorter than that of CO2 (hundreds to thousands of years), so when methane emissions are reduced the concentration in the atmosphere soon falls, whereas CO2 accumulates in the atmosphere over long periods. For details see the greenhouse gas and global warming potential articles.
Q8: How can you say there's a consensus when lists of "skeptical scientists" have been compiled?
A8: Consensus is not the same as unanimity, the latter of which is impractical for large groups. Over 99% of publishing climate scientists agree on anthropogenic climate change.[1] This is an extremely high percentage well past any reasonable threshold for consensus. Any list of "skeptical scientists" would be dwarfed by a comparably compiled list of scientists accepting anthropogenic climate change. Q9: Did climate change end in 1998?
A9: One of the strongest El Niño events in the instrumental record occurred during late 1997 through 1998, causing a spike in global temperature for 1998. Through the mid-late 2000s this abnormally warm year could be chosen as the starting point for comparisons with later years in order to produce a cooling trend; choosing any other year in the 20th century produced a warming trend. This no longer holds since the mean global temperatures in 2005, 2010, 2014, 2015 and 2016 have all been warmer than 1998.[12]
More importantly, scientists do not define a "trend" by looking at the difference between two given years. Instead they use methods such as linear regression that take into account all the values in a series of data. The World Meteorological Organisation specifies 30 years as the standard averaging period for climate statistics so that year-to-year fluctuations are averaged out;[2] thus, 10 years isn't long enough to detect a climate trend. Q10: Wasn't Greenland much warmer during the period of Norse settlement?
A10: Some people assume this because of the island's name. In fact the Saga of Erik the Red tells us Erik named the new colony Greenland because "men will desire much the more to go there if the land has a good name."[13] Advertising hype was alive and well in 985 AD.
While much of Greenland was and remains under a large ice sheet, the areas of Greenland that were settled by the Norse were coastal areas with fjords that, to this day, remain quite green. You can see the following images for reference:
Q11: Are the IPCC reports prepared by biased UN scientists?
A11: The IPCC reports are not produced by "UN scientists". The IPCC does not employ the scientists who generate the reports, and it has no control over them. The scientists are internationally recognized experts, most with a long history of successful research in the field. They are employed by various organizations including scientific research institutes, agencies like NASA and NOAA, and universities. They receive no extra pay for their participation in the IPCC process, which is considered a normal part of their academic duties. Q12: Hasn't global sea ice increased over the last 30 years?
A12: Measurements show that it has not.[14] Claims that global sea ice amounts have stayed the same or increased are a result of cherry picking two data points to compare, while ignoring the real (strongly statistically significant) downward trend in measurements of global sea ice amounts.
Arctic sea ice cover is declining strongly; Antarctic sea ice cover has had some much smaller increases, though it may or may not be thinning, and the Southern Ocean is warming. The net global ice-cover trend is clearly downwards. Q13: Weren't scientists telling us in the 1970s that the Earth was cooling instead of warming?
A13: They weren't – see the article on global cooling. An article in the Bulletin of the American Meteorological Society has reviewed the scientific literature at that time and found that even during the 1970s the prevailing scientific concern was over warming.[15] The common misperception that cooling was the main concern during the 1970s arose from a few studies that were sensationalized in the popular press, such as a short nine-paragraph article that appeared in Newsweek in 1975.[16] (Newsweek eventually apologized for having misrepresented the state of the science in the 1970s.)[17] The author of that article has repudiated the idea that it should be used to deny global warming.[18] Q14: Doesn't water vapour cause 98% of the greenhouse effect?
A14: Water vapour is indeed a major greenhouse gas, contributing about 36% to 70% (not 98%) of the total greenhouse effect. But water vapour has a very short atmospheric lifetime (about 10 days), compared with decades to centuries for greenhouse gases like CO2 or nitrous oxide. As a result it is very nearly in a dynamic equilibrium in the atmosphere, which globally maintains a nearly constant relative humidity. In simpler terms, any excess water vapour is removed by rainfall, and any deficit of water vapour is replenished by evaporation from the Earth's surface, which literally has oceans of water. Thus water vapour cannot act as a driver of climate change.
Rising temperatures caused by the long-lived greenhouse gases will however allow the atmosphere to hold more vapour. This will lead to an increase in the absolute amount of water vapour in the atmosphere. Since water vapour is itself a greenhouse gas, this is an example of a positive feedback. Thus, whereas water vapour is not a driver of climate change, it amplifies existing trends. Q15: Is the fact that other solar system bodies are warming evidence for a common cause (i.e. the sun)?
A15: While some solar system bodies show evidence of local or global climate change, there is no evidence for a common cause of warming.
Q16: Do scientists support climate change just to get more money?
A16: No,
Q17: Doesn't the climate vary even without human activity?
A17: It does, but the fact that natural variation occurs does not mean that human-induced change cannot also occur. Climate scientists have extensively studied natural causes of climate change (such as orbital changes, volcanism, and solar variation) and have ruled them out as an explanation for the current temperature increase. Human activity is the cause at the 95 to 99 percent confidence level (see the IPCC Fifth Assessment Report for details). The high level of certainty in this is important to keep in mind to spot mention of natural variation functioning as a distraction. Q18: Should we include the view that climate change will lead to planetary doom or catastrophe?
A18: This page is about the science of climate change. It doesn't talk about planetary doom or catastrophe. For a technical explanation, see catastrophic climate change, and for paleoclimatic examples see PETM and great dying. Q19: Is an increase in global temperature of, say, 3 degrees Celsius (5.4 degrees Fahrenheit) important?
A19: Though it may not sound like much, a global temperature rise of 3 degrees Celsius (5.4 degrees Fahrenheit) is huge in climate terms. For example, the sea level rise it would produce would flood coastal cities around the world, which include most large cities.
Q20: Why are certain proposals to change the article discarded, deleted, or ignored? Who is/was Scibaby?
A20: Scibaby is/was a long term abusive sock-master (or coordinated group of sock masters) who has created 1,027 confirmed sock puppets, another 167 suspected socks, and probably many untagged or unrecognized ones. This page lists some recent creations. His modus operandi has changed over time, but includes proposing reasonably worded additions on the talk page that only on close examination turn out to be irrelevant, misinterpreted, or give undue weight to certain aspects. Scibaby is banned, and Scibaby socks are blocked as soon as they are identified. Some editors silently revert his additions, per WP:DENY, while others still assume good faith even for likely socks and engage them. Q21: What about this really interesting recent peer-reviewed paper I read or read about, that says...?
A21: There are hundreds of peer-reviewed papers published every month in respected scientific journals such as Geophysical Research Letters, the Journal of Climate, and others. We can't include all of them, but the article does include references to individual papers where there is consensus that they best represent the state of the relevant science. This is in accordance with the "due weight" principle (WP:WEIGHT) of the Neutral point of view policy and the "Wikipedia is not an indiscriminate collection of information" principle (WP:IINFO) of the What Wikipedia is not policy. Q22: Why does the article define "climate change" as a recent phenomenon? Hasn't the planet warmed and cooled before?
A22: Yes, the planet has warmed and cooled before. However, the term "climate change" without further qualification is widely understood to refer to the recent episode and often explicitly connected with the greenhouse effect. Per WP:COMMONNAME, we use the term in this most common meaning. The article Climate variability and change deals with the more general concept. Q23: Did the CERN CLOUD experiment prove that climate change is caused not by human activity but by cosmic rays?
A23: No. For cosmic rays to be causing global warming, all of the following would have to be true, whereas only the italicized one was tested in the 2011 experiment:[28]
Q24: I read that something can't fix climate change. Is this true?
A24: Yes, this is true for all plausible single things including: "electric cars", "planting trees", "low-carbon technology", "renewable energy", "Australia", "capitalism", "the doom & gloom approach", "a Ph.D. in thermodynamics". Note that it is problematic to use the word "fix" regarding climate change, as returning the climate to its pre-industrial state currently appears to be feasible only over a timeframe of thousands of years. Current efforts are instead aimed at mitigating (meaning limiting) climate change. Mitigation is strived for through the combination of many different things. See Climate change mitigation for details. References
|
| This It is of interest to multiple WikiProjects. | ||||||||||||||||||||||||||||||||||||||||||||||||||||||||||||||||||||||||||||||||||||||||||||||||||||||||||||||||||
| ||||||||||||||||||||||||||||||||||||||||||||||||||||||||||||||||||||||||||||||||||||||||||||||||||||||||||||||||||


| Other talk page banners | ||||||||||||||||||||||||||||||||||||||||||||||||||||||||||||||||||||||||||||||||||||||||||||||||||||||||||||||||||||||||||||||||||||||||||||||||||||||||||||||||||||||||||||
| ||||||||||||||||||||||||||||||||||||||||||||||||||||||||||||||||||||||||||||||||||||||||||||||||||||||||||||||||||||||||||||||||||||||||||||||||||||||||||||||||||||||||||||
| This article is written in British English, which has its own spelling conventions (colour, travelled, centre, defence, artefact, analyse) and some terms that are used in it may be different or absent from other varieties of English. According to the relevant style guide, this should not be changed without broad consensus. |
|
Index 1, 2, 3, 4, 5, 6, 7, 8, 9, 10 11, 12, 13, 14, 15, 16, 17, 18, 19, 20 21, 22, 23, 24, 25, 26, 27, 28, 29, 30 31, 32, 33, 34, 35, 36, 37, 38, 39, 40 41, 42, 43, 44, 45, 46, 47, 48, 49, 50 51, 52, 53, 54, 55, 56, 57, 58, 59, 60 61, 62, 63, 64, 65, 66, 67, 68, 69, 70 71, 72, 73, 74, 75, 76, 77, 78, 79, 80 81, 82, 83, 84, 85, 86, 87, 88, 89, 90 91, 92, 93, 94, 95 |
|
This page has archives. Sections may be automatically archived by Lowercase sigmabot III when more than 5 sections are present. |
| On 21 August 2020, it was proposed that this article be moved from Global warming to Climate change. The result of the discussion was moved. |
Move was closed in these edits of 21 August 2020.
Food and health
This is the comparison between the section as it is now (and as it was a little earlier)
The WHO calls climate change the greatest threat to global health in the 21st century. Extreme weather leads to injury and loss of life, and crop failures to malnutrition. Various infectious diseases are more easily transmitted in a warmer climate, such as dengue fever and malaria. Young children are the most vulnerable to food shortages. Both children and older people are vulnerable to extreme heat. The World Health Organization (WHO) has estimated that between 2030 and 2050, climate change would cause around 250,000 additional deaths per year. They assessed deaths from heat exposure in elderly people, increases in diarrhea, malaria, dengue, coastal flooding, and childhood malnutrition. Reductions in food availability and quality alone could lead up to 530,000 deaths between 2010 and 2050. By 2100, 50% to 75% of the global population may face climate conditions that are life-threatening due to combined effects of extreme heat and humidity.
Climate change is affecting food security. It has caused reduction in global yields of maize, wheat, and soybeans between 1981 and 2010. Future warming could further reduce global yields of major crops. Crop production will probably be negatively affected in low-latitude countries, while effects at northern latitudes may be positive or negative. Up to an additional 183 million people worldwide, particularly those with lower incomes, are at risk of hunger as a consequence of these impacts. Climate change also impacts fish populations. Globally, less will be available to be fished. Regions dependent on glacier water, regions that are already dry, and small islands have a higher risk of water stress due to climate change
and the version I rewrote, and which was just reverted.
The World Health Organization (WHO) calls climate change the greatest threat to global health in the 21st century. They estimated that between 2030 and 2050, climate change could cause around 250,000 additional deaths per year. They assessed factors such as coastal flooding, deaths from heat exposure in elderly people, increased transmission of pathogens behind infectious diseases such as malaria, diarrhea and dengue fever and childhood malnutrition. In the early 21st century, less than a third of the global population lives in areas where combinations of extreme heat and humidity that can kill people (particularly children and the elderly) occasionally occur, such as during the 2003 European heatwave. By 2100, these areas will expand to cover 50% to 75% of the population.
Climate change is affecting food security. Global fishery yields will decline as every degree of warming reduces total fish biomass. By 2050, global livestock headcounts could decline by 7-10%, as less animal feed will be available. Global yields of staple crops have also been negatively affected by climate change, and the impacts will become worse as the warming increases, in spite of the CO2 fertilization effect. The risk of years with crop failures in multiple areas would also increase significantly even under low emissions. By 2050, between 8 and 80 million extra people would be at risk of hunger due to climate change, compared to its absence. However, total crop yields to date have been increasing due to improved farming practices and agricultural expansion. Under low and intermediate emissions, these developments are expected to continue to improve food security in most hunger-prone regions like Sub-Saharan Africa and South Asia. Food security is unlikely to improve under high emissions. Between 2010 and 2050, around 530,000 deaths could be caused by increases in malnutrition under high emissions. This mortality would be around 70% lower under low emissions.
Climate change would not affect agricultural land equally. Small islands and regions that are already dry or dependent on glacier water have a higher risk of agricultural water stress due to climate change. Impacts on crop production may be positive at northern latitudes, but are likely to be negative in low-latitude countries. Some places may stop being able to support agriculture and livestock rearing outright: by 2100, areas which currently account for 5% agricultural production are likely to stop being suitable under low emissions, while under high emissions, they would account for 31%. For livestock, 8% and 34% would become unsuitable. Those projections do not account for potential shifts of agriculture to other areas. Worldwide decreases in land suitable for agriculture would be less pronounced, but they are still expected, particularly after 2100.
A quick summary of the differences.
- Removed the four sentences between "the greatest threat to global health" and "250,000 additional deaths per year" because by and large, they said the same thing as the "they assessed" sentence.
- Added the present-day baseline for "climate conditions that are life-threatening" because that statistic can be read very differently in the absence of that information. Following that, I felt I had to expand on the idea further. Perhaps some of that explanation can be cut, but I do not see how we can avoid using the baseline.
- My sentence on fisheries actually has the same wordcount as the two sentences in the current article, and I believe it is a more accurate and encyclopaedic phrasing.
- Added a mention of AR6 livestock projections, since not mentioning impacts on livestock at all is untenable.
- Phrasing on reduced crop yields is fairly similar and about the same size. The greatest difference is the mention of CO2 fertilization effect and that it doesn't overcome negative effects, which I consider to be an important point.
- Mentioned the increase of compound (multi-breadbasket) crop failures, which is clearly important.
- "Up to 183 million" figure, cited to the 2019 IPCC special report, was undated, and I decided AR6 year 2050 figure was superior.
- Increase in total global yields to date is a fact. Anyone who doubts can check Our World in Data, or refer to the studies which mention that yield declines have been statistically extracted from the increasing trend. It's also practically necessary context for the next part.
- The same World Bank report which is cited in the article for the "130 million in poverty by 2030" figure also has a graphic on page 4 which appears to unequivocally state exactly what I wrote in that section.
- Springmann study was awfully mis-cited earlier: until recently, this Featured Article claimed it estimated annual mortality of 530,000 rather than over 40 years, which does not appear supported by its text in any way. I further clarified that "Adoption of climate-stabilisation pathways" phrase in that paper seems to make it clear the 530,000 figure was for RCP 8.5 or thereabouts.
- The additional sentences about agricultural land potentially becoming unsuitable are admittedly awkwardly phrased now that I look at it. I also do not know how we can justify omitting those projections outright.
So, what are the other editors' opinions about this section? InformationToKnowledge (talk) 22:39, 1 February 2024 (UTC)
- I made some changes:
- 1) Removed 530,000 figure and Up to 183 million parts, changed those with AR6 (8-80 million by 2050).
- 2) Re-worded extremely hot and uninheritable climate parts, so the wording is less close to the wording used by the source.
- I'm also ok with expanding the explanation for the heat and humidity part, using 2003 European heatwave as an example. Bogazicili (talk) 12:08, 2 February 2024 (UTC)
- I appreciate your efforts. However, I do not fully agree with either change. To be fair, there is a lot of complexity with underlying research.
- 1) I agree with removing the AR5 "183 million" part, but not the 530,000 figure. For one thing, it is actually cited in AR6 as well (subsection "7.3.1.9.2 Climate Change, Carbon Dioxide, Diets, and Health") Secondly, it actually looks at the subject completely differently. It suggests that nearly all of those deaths would be caused not by hunger, but lack of vitamins and other micronutrients due to reduced availability of fruits and vegetables. This is very different from most model projections, which only look at the four staple crops, and this is likely the reason the IPCC found it worth citing.
- Secondly, I'll have to admit to an embarrassing error. The earlier description of the study in this article, which I thought was egregiously wrong
Over 500,000 more adult deaths are projected yearly by 2050 due to reductions in food availability and quality.
- Was actually more accurate than what I replaced it with. The study is paywalled and has a remarkably ambiguous abstract. It never uses words like "yearly" or "annually", and this sentence
The model projects that by 2050, climate change will lead to per-person reductions of 3·2% (SD 0·4%) in global food availability, 4·0% (0·7%) in fruit and vegetable consumption, and 0·7% (0·1%) in red meat consumption. These changes will be associated with 529 000 climate-related deaths worldwide (95% CI 314 000–736 000), representing a 28% (95% CI 26–33) reduction in the number of deaths that would be avoided because of changes in dietary and weight-related risk factors between 2010 and 2050.
- Convinced me that the paper must be talking about the entire 2010-2050 period. It wasn't until I saw AR6 cite it as "an additional 529,000 deaths a year by 2050" that I realized this was wrong, and the original was more accurate.
- However, focusing on the 530,000 figure might be missing the larger point - which is that this study still expects the overall number of deaths from hunger to go down, substantially. If 529,000 deaths reduces the number of lives saved by 28%, then that number is around 2 million, and the net figure is a decrease of ~1.5 million. The full text says as much:
Climate change reduced the number of avoided deaths
- It also confirms that this is under RCP8.5: for RCP2.6, it is around 150,000, and for RCP4.5, some 350,000-400,000 depending on the SSP. This largely confirms the point I tried to make when citing year 2014 World Bank report in the version which was reverted.
- So, I am not sure what would be the best way to cite this paper in the article, but it's clear that we cannot ignore it outright.
- 2) The main issue I highlighted here was that "live...in uninhabitable climates" is an obvious contradiction - if people can live in a place, it is, by definition, not uninhabitable. I looked at the source study (the one which first made this claim that was subsequently cited by our reference) again, and I confirmed that it never says "uninhabitable".
- What it does say is "1 to 3 billion people are projected to be left outside the climate conditions that have served humanity well over the past 6,000 y" in the abstract, and similar phrases later in the text.
- The study is often interpreted as if it suggests that all of those people would not actually live in those climates and migrate elsewere, but it does not actually explicitly say that at any point. If anything, it repeatedly suggests the opposite.
Populations will not simply track the shifting climate, as adaptation in situ may address some of the challenges, and many other factors affect decisions to migrate.
- and
As the potentially most affected regions are among the poorest in the world, where adaptive capacity is low, enhancing human development in those areas should be a priority alongside climate mitigation.
- and
Obviously, our hypothetical redistribution calculations cannot be interpreted in terms of expected migration.
- It's probably a good idea to read the entire paper before considering how to handle it. Perhaps, we should also cite it directly, instead, or at least in addition to, the review article we are currently citing. I think one thing is clear - the current sentence in the article
With worst-case climate change, models project that almost one-third of humanity might live in Sahara-like uninhabitable and extremely hot climates
- does not really address the issues raised.- My suggestions are:
- Drop both "live" and "uninhabitable". Something like "almost one-third of humanity might end up in climates as hot as the Sahara Desert" is more accurate to the paper and should leave no room for misunderstandings. After that, we can attach "and those climates are unlikely to support permanent populations" or something like that to the end of that sentence.
- Specify the timeline. It feels incredible, but the article just says this, but does not actually note by when. In the original paper, this projection is for 2070. It seems like the review dropped that part, however.
- Potentially specify the full range. The review only cites the worst case, but the original paper says "1 to 3 billion people" (i.e. RCP 2.6 to RCP 8.5) and the supporting information clarifies that it'll be around 2 billion under RCP 4.5 Yes, it will add a few words, but it should be worth it.
- InformationToKnowledge (talk) 13:56, 2 February 2024 (UTC)
- P.S. I am sorry to say this, but way you cited AR6 for the year 2050 figure is not accurate either.
- Your phrase:
Under a high emission scenario, climate change is expected to place an extra 8 to 80 million people at risk of hunger by 2050.
- AR6:
Climate change impacts could increase the global number of people at risk of hunger in 2050 by 8 million people under a scenario of sustainable development (SSP1) and 80 million people under a scenario of reduced international cooperation and low environmental protection (SSP3), with populations concentrated in sub-Saharan Africa, South Asia and Central America
- Base SSPs are not emission scenarios - they are purely about development and geopolitics, and are only associated with emission projections later - SSP2-4.5, SSP5-8.5, etc. I.e. the IPCC's implication seems to be that those changes in development and geopolitics would affect vulnerability from hunger due to climate change a lot more than the actual extent of climate change, at least for the next few decades. The wording I used in the lead of Effects of climate change on agriculture -
climate change is expected to place an extra 8 to 80 million people at risk of hunger by 2050 (depending on the intensity of future warming and the effectiveness of adaptation measures
- may not be the ideal rephrasing of this, but it is certainly a lot closer to its meaning. InformationToKnowledge (talk) 14:40, 2 February 2024 (UTC)- AR6 WG2: "for example, between 8 million under SSP1-6.0 to up to 80 million people under SSP3-6.0." So those are 6 C projections. That's why I said high emissions. But I'm also ok with the wording on Effects of climate change on agriculture. Bogazicili (talk) 15:37, 2 February 2024 (UTC)
- ...I just remembered I never updated my download of AR6 WG2 from the Final Draft they presented in early 2022 to the current, full version they quietly uploaded a lot later. You are right, one of the edits they made was specifying "-6.0" for both SSPs in that sentence. And yes, RCP 6 is a fairly high emission scenario, so your wording might actually be better. I'll have to think about it more.
- Finally, I would like to note that if by "6 C", you mean +6C warming then not quite. 6 stands for RCP 6.0, which was the least-often used of the four pre-SSP scenarios, and nowadays, if studies go beyond the "2.6/4.5/8.5" trifecta, they usually use SSP3-7.0. Still, according to
 , RCP 6.0 would result in about 3.2 C by 2100 (and 2C by 2050 or thereabouts, which is more immediately relevant to this agricultural projection). After 2300, it would apparently fluctuate between 5 and 6 C up until at least 2500, and probably well beyond that too. (Remember that the figure is relative to 2000-2019, so it needs to be increased by 1 degree to be compared to increases from preindustrial.) InformationToKnowledge (talk) 16:14, 2 February 2024 (UTC)
- P.S. It now feels really tempting to describe the projection as
An extra 8 to 80 million people would be at risk of hunger if global warming reaches 2°C by 2050, depending on the extent of socioeconomic development and adaptation.
If this doesn't cross into WP:SYNTH, I probably would do just that. InformationToKnowledge (talk) 16:23, 2 February 2024 (UTC)- Speaking generally, I like your changes to the first paragraph, but I think you have way too much content here on food security. The second and third paragraphs just don't say much. At most, agricultural land management will need to change and some foods like meat and fish may become more expensive. Correct me if I'm wrong, but food security looks like a much less signficant issue than other impacts like heat waves, flooding, and fire. If it were me, I'd look to combine the second and third paragraphs and cut half the content there. Efbrazil (talk) 20:06, 2 February 2024 (UTC)
- Alright, this is the revised version. Down to two paragraphs (though the second could certainly be split into two smaller ones), and it should hopefully be clear enough to address your misperception about this topic's significance.
In the early 21st century, less than a third of the global population lives in areas where combinations of extreme heat and humidity that can kill people (particularly children and the elderly) occasionally occur, such as during the 2002 India heatwave. By 2100, these areas will expand to cover 50% to 75% of the population. The World Health Organization (WHO) calls climate change the greatest threat to global health in the 21st century. They concluded that it would increase the transmission of pathogens behind infectious diseases such as malaria, diarrhea and dengue fever, and add to deaths from coastal flooding, heat exposure in elderly people, and childhood malnutrition. Between 2030 and 2050, these factors could cause around 250,000 additional deaths per year. Under a warming of 4 °C, agricultural labourers in Sub-Saharan Africa, Southeast Asia and South America will often experience too much heat stress to work. In the worst-affected areas, this could reach 250 days a year.
Global fishery yields will decline as every degree of warming reduces total fish biomass. By 2050, global livestock headcounts could decline by 7-10%, as less animal feed will be available. Crop yields are already getting negatively affected by stronger heatwaves and water stress, but globally, this has so far been strongly outweighted by greater farm productivity and agricultural expansion. This is expected to continue into the near future, and there'll most likely be fewer malnutrition-related deaths in 2050 than now. At higher warming levels, climate risks to agriculture will increase substantially after 2050. By 2100, total land area suitable for key staple crops would decline by over 10% with high emissions. Total land area includes wilderness like forests and plains. Out of areas already used for agriculture and livestock rearing, around a third may stop being suitable under high emissions.
- The first paragraph is larger, because I moved the part about agricultural labour from the inequality section, since it just seems to fit better here. The total size of the paragraph is about the same as it is now, and the first paragraph in "Inequality" would obviously become a lot smaller.(I think it would be a good idea to add a bit more detail about other economic impacts to that paragraph instead, like the skyrocketing insurance costs?)
- In the second, I avoided most specific numbers around 2050 since they would be less important than the countervailing progress trend anyway. On the other hand, I rephrased the agricultural land part to make it clear just what is being lost. If you look at one graphic from my reference for total crop area, Lyon et al, 2021, you'll see that what it considers suitable agricultural land (whether now or in the future) includes the entirety of the Amazon rainforest, all of the boreal forests and eventually, the thawed tundra. To make the point even clearer, I found a fascinating study from France which suggests that the country would likely end up ploughing some of its forests in the future, particularly with high emissions. So, yes, it seems like we can offset the impact of climate change in this way, but it'll be a disaster for biodiversity.
- And if you think that it would be better to split the second paragraph in two (probably at the "Higher warming levels" mark), then I would strongly suggest mentioning increase in short-term crop failure events again. The earlier, even larger version, which was reverted by Femke, mentioned a paper which found that if global food exports dropped by 10%, 55 million would lose over 5% of their calorie intake, and if Russia, the US and Thailand had sufficiently bad harvests to forbid food exports, 200 million people would. Even if 5% does not sound like much, you probably aware of the connections between poor harvests in 2010, food export bans and the Arab Spring. I am not sure on the best way to phrase this point within our size limits, but it would be unfortunate if we failed to mention that climate-driven events do not have to starve (a lot of) people to death to substantially increase instability. InformationToKnowledge (talk) 13:32, 3 February 2024 (UTC)
- P.S. I forgot to mention that I changed the 2003 European heatwave to a 2002 Indian heatwave, because a more careful look at the explanatory article for that paper (including an embedded infographic) suggests that it did not consider Europe vulnerable at present under its methodology! (With the commentary in the article instead seeming to bring up the 2003 heatwave as an example of the study's limitations.) Since it does consider India vulnerable, that event would be truer to the paper's text. (We really need to at least find an image for that heatwave, though, even if the text is already dramatic enough.) InformationToKnowledge (talk) 13:36, 3 February 2024 (UTC)
- The malnutrition issue has lot more to do with equitable food distribution than it does with production. Right now the vast majority of our arable land is used for livestock, livestock feed, or fuel supplements. We also waste at least a third of the food we produce.
- Here is a rewrite of what you did, edit summary is down below:
The World Health Organization (WHO) calls climate change the greatest threat to global health in the 21st century. Deaths will be caused by coastal flooding, childhood malnutrition, exposure to heat and humidity, and from increased transmission of infectious diseases such as malaria, diarrhea and dengue fever. Between 2030 and 2050 these factors could be causing 250,000 additional deaths per year, particularly threatening children and the elderly. Deadly heat waves such as the 2022 India–Pakistan heat wave will expand their range and could go from threatening 1/3rd of the world's population to about 2/3rds of it by 2100.
Global fishery yields will decline as every degree of warming reduces total fish biomass. By 2050, global livestock headcounts could decline by 7-10%, as less animal feed will be available. Crop yields are already getting negatively affected by stronger heatwaves and water stress, but globally, this has been strongly outweighted by greater farm productivity. This is expected to continue into the near future, but climate risks to agriculture will increase substantially at higher warming levels. Heat stress prevents agricultural labourers from working, and if warming reaches 4 °C then laborers in tropical zones could be unable to work 250 days per year. Out of areas currently used for agriculture and livestock rearing, a third may stop being suitable for use under high emission scenarios.
- First paragraph changes:
- I combined the first two sentences of the first paragraph and moved them to later. The WHO statement is a better introductory sentence, and the first two sentences were awkward and wordy as written.
- Resequenced the sentence on health threat enumeration by WHO
- The statement about heat stress to those working should really not be limited to 4 C. I assume that the 4 C statement is meant for the 250 days a year metric, so I combined those sentences.
- The structure of the paragraph now goes from minimal impact (2030 to 2050) to more (2100 average) to extreme (4 C) and has fewer words.
- I switched the 2002 India heatwave to the more current 2022 India–Pakistan heat wave.
- The second paragraph:
- My understanding is that agricultural land use has actually been declining lately, as efficiencies in farming increase yields per acre. If you have a source proving me wrong then great, but for now I just deleted "agricultural expansion".
- There was some grammatical issues I fixed
- This issue will be one of distribution, not production, so I cut it: "fewer malnutrition-related deaths in 2050 than now"
- Total land area available for agriculture is much less interesting than loss of existing agricultural land, so I cut total land area so the focus could be on existing agricultural land.
- As food and land has less content overall, I moved the sentence on agricultural labor back into it.
- Efbrazil (talk) 18:09, 3 February 2024 (UTC)
- Added to the article. The only real change I made was to the last sentence; from
a third may stop being suitable for use
toa third may stop being usable by 2100
, both specifying the date and making the wording less awkward. - Strictly speaking, I believe that the apparent peaking of agricultural land had been very recent, while the references about impacts of climate change on historical yields started detecting it from 1981. Back then, net expansion had still been ongoing. However, this point is too minor to quibble over in such a high-level article. InformationToKnowledge (talk) 19:13, 3 February 2024 (UTC)
- With this done, any suggestions regarding the other discussion here, about the "human niche" study and Sahara-like climates? I actually found a reference which appears to question at least some of its premises, but it has attracted much less attention than the original study (so far), so I am unsure on how to handle it, at least for this article. InformationToKnowledge (talk) 19:13, 3 February 2024 (UTC)
- Great! Glad we came together on this so quickly.
- Regarding this sentence: With worst-case climate change, models project that almost one-third of humanity might live in Sahara-like uninhabitable and extremely hot climates
- Like you say, the alamist studies and language attract the media attention, not the corrections or qualifications to those studies. Ideally, look for an IPCC source talking about desertification in the likely 2 C to 3 C range and use that as basis to present the issue. The general issue is simply that deserts are likely to expand in many areas and displace arable land. Efbrazil (talk) 22:03, 3 February 2024 (UTC)
- With this done, any suggestions regarding the other discussion here, about the "human niche" study and Sahara-like climates? I actually found a reference which appears to question at least some of its premises, but it has attracted much less attention than the original study (so far), so I am unsure on how to handle it, at least for this article. InformationToKnowledge (talk) 19:13, 3 February 2024 (UTC)
- Added to the article. The only real change I made was to the last sentence; from
- Speaking generally, I like your changes to the first paragraph, but I think you have way too much content here on food security. The second and third paragraphs just don't say much. At most, agricultural land management will need to change and some foods like meat and fish may become more expensive. Correct me if I'm wrong, but food security looks like a much less signficant issue than other impacts like heat waves, flooding, and fire. If it were me, I'd look to combine the second and third paragraphs and cut half the content there. Efbrazil (talk) 20:06, 2 February 2024 (UTC)
- P.S. It now feels really tempting to describe the projection as
- AR6 WG2: "for example, between 8 million under SSP1-6.0 to up to 80 million people under SSP3-6.0." So those are 6 C projections. That's why I said high emissions. But I'm also ok with the wording on Effects of climate change on agriculture. Bogazicili (talk) 15:37, 2 February 2024 (UTC)
I re-added 8 to 80 million part. We can also add something like "depending on the effectiveness of adaptation measures" (given the range is for SSP1-6.0 to SSP3-6.0), but this might be redundant. I also returned the previous wording for "life-threatening due to combined effects of extreme heat and humidity" part. The example chosen seemed random. "combined effects of extreme heat and humidity" seems more descriptive than just saying deadly heatwaves with a random example. Also about 2/3rds is problematic (did you just average out 50% to 75%?) Bogazicili (talk) 16:26, 4 February 2024 (UTC)
- Regarding climate niche, AR6 WG2 p.153:
- "The rather narrow climatic niche favoured by human societies over the last 6000 years is poised to move on the Earth’s surface at speeds unprecedented in this time span (IPCC, 2021a), with consequences for human well-being and migration that could be profound under high-emission scenarios (Xu et al., 2020). This will overturn the long-lasting stability of interactions between humans and domesticated plants and animals as well as challenge the habitability for humans in several world regions (Horton et al., 2021) (medium confidence)."
- I think something about climate niche should be mentioned in the article. Bogazicili (talk) 16:40, 4 February 2024 (UTC)
- We would probably need to do a deep dive into all the heat stress/wet bulb literature at some point. Incredibly, I am not even sure if there is even a Wikipedia article which is the accepted go-to place to cover it? (Effects of climate change on human health seems like it might be the closest one.)
- The main issue I found the last time I looked at the subject, is that there are actually multiple different metrics of heat stress, which appear to have only partial overlap, yet even the recent major studies can still use all of those. To show you what I mean:
- There is wet bulb temperature, which is the one our readers of a certain age are likely to be the most aware of, in large part "thanks" to The Ministry for the Future.
- There is the "mean annual temperature", which is what the human niche study used - the study cited by the IPCC in the quote you provided. (And is also the metric which had been at least partially questioned in a study published about 6 months after that IPCC report.)
- There is the Universal Thermal Climate Index, which is what had been used by Lyon et al. 2021. For the record, their graphic of 2100-2500 changes might be the single best illustration for this section, since my earlier food-related graphics have been rejected for one reason or another.
- And then, there are whatever calculations the "50% to 75%" study used to arrive at their figures, because it's certainly not any of the three above. These are just the papers I know of, and I wouldn't be surprised to find even more.
- So, it's a fairly complex subject to work on. The reason why I REALLY don't like your "life-threatening due to combined effects of extreme heat and humidity" wording is because nowadays, a lot of readers will read that and think it refers to areas that will be subject to scenes like the opening of The Ministry for the Future (a depiction which appears to be about as accurate as The Day After Tomorrow). As opposed to well, the paper defining it as an area which can have heatwaves that will kill at least one person. Except, the paper is not even good at that, because by that logic Europe would also already be in that zone after 2003, but in the paper, it isn't.
- If we can't think of a proper clarification, then just tossing that paper entirely and instead writing a sentence on any one of the studies which use less-confusing metrics might be the best possible solution. Even if we keep the mention of that study, the current wording is untenable. InformationToKnowledge (talk) 10:29, 5 February 2024 (UTC)
- "Deaths will be caused by coastal flooding, childhood malnutrition, exposure to heat and humidity, and from increased transmission of infectious diseases such as malaria, diarrhea and dengue fever" is also problematic, because this is not an exhaustive list of death causes due to climate change. Those are just some of the factors cited in WHO estimate. But WHO estimate is not an exhaustive list of climate change deaths. I'm going to restore previous wording, until a consensus can be reached. Bogazicili (talk) 16:53, 4 February 2024 (UTC)
- Again, some of the wording is worse than previous version. Eg: "This is expected to continue into the near future". This is so vague, and has bunch of sources cited. What is expected to continue? Greater farm productivity outweighing climate change losses? This is what world bank source says [1]:
" Lower crop yields and higher food prices. Modeling studies suggest that climate change could result in global crop yield losses as large as 5 percent in 2030 and 30 percent in 2080, even accounting for adaptive behaviors such as changed agricultural practices and crops, more irrigation, and innovation in higher yield crops (Biewald et al., forthcoming; Havlík et al., forthcoming). Over the short term, climate change will also create some benefits, but mostly in cold and relatively rich countries, while poorer regions will be the most negatively affected. The expected yield losses are likely to translate into higher agri cultural prices; and climate change will make it more difficult, even with more trade, to ensure food security in regions like Sub Saharan Africa and South Asia. In a world with rapid population growth, slow economic growth, and high GHG emissions (that is, a scenario in which global temperatures increase by approximately 4oC by 2100), food availability in these regions could pla teau at levels far below current levels in devel oped countries (figure O.2)."
- Again, I'm restoring previous version. Bogazicili (talk) 17:16, 4 February 2024 (UTC)
- So I reverted the text in that section to what it was before edits by InformationToKnowledge (which included my edits) and then Bogazicili. Here is what it was after edits by Bogazicili, which I do not like as it has major readability issues, including run on sentences and repeated information:
- https://en.wikipedia.org/w/index.php?title=Climate_change&oldid=1203342399#Food_and_health
- I'm fine with the substance of Bogazicili's concerns, but we need to come up with new text that incorporates them and is also readable. Let's try to get to consensus here before going live with edits. Efbrazil (talk) 21:52, 4 February 2024 (UTC)
- Efbrazil, can you quote repeated information and run on sentences in that version? Your reversion seems to be not justified and lack adequate explanation. Also I found your edit summary weird. What was exactly unreadable [2]? Bogazicili (talk) 22:05, 4 February 2024 (UTC)
- Here are my concerns with the text as it had become:
- The death issues are enumerated, then the same laundry list of issues are enumerated a second time in the WHO statement. There is no need for the redundancy there.
- The last 2 sentences of the first paragraph are both way too long to be readable and digestible.
- The old wording simply says "Childhood malnutrition", while the new wording pads the content with an entire extra sentence saying "Young children are the most vulnerable to food shortages".
- While I could have tried to patch those things up, I think the text as it had become was worse than what we had previously. I just hope one of us can propose text here that we all agree to rather than thrashing on page. Efbrazil (talk) 22:21, 4 February 2024 (UTC)
- Efbrazil, first of all, did you read what you reverted to? First and 3rd points are in the current version, which you reverted to. I had restored them to original earlier version myself. Bogazicili (talk) 22:26, 4 February 2024 (UTC)
- Here are my concerns with the text as it had become:
- Efbrazil, can you quote repeated information and run on sentences in that version? Your reversion seems to be not justified and lack adequate explanation. Also I found your edit summary weird. What was exactly unreadable [2]? Bogazicili (talk) 22:05, 4 February 2024 (UTC)
- The thing about the World Bank quote is that it appears to be calculating those losses relative to an ideal counterfactual future without climate change, as opposed to calculating them relative to the present day, which is what most people will immediately assume. Same goes for the IPCC "8 to 80 million people" estimate. Likewise, in the quote, "food availability in these regions could plateau at levels far below current levels in developed countries", the key word is developed. If you look at the figure on page 4, you'll see that the only scenario where the graph of food availability in Sub-Saharan Africa and Southeast Asia doesn't go up throughout the century is the one where there is both 4C climate change and CO2 fertilization effect does not work (and by now, we know well enough it does - see the figure in that article). Even then, it simply stays at about the same level as now. This is also confirmed by the Springmann paper in The Lancet, where most people only pay attention to the "~540,000 deaths" part, yet those at most offset a third of the lives which would be saved relative to now.
- Granted, both the World Bank reference and the Springmann paper are from 2016. Out of what you called "a bunch of sources cited", the most recent one, from 2021, says the following:
Across five representative scenarios that span divergent but plausible socio-economic futures, the total global food demand is expected to increase by 35% to 56% between 2010 and 2050, while population at risk of hunger is expected to change by −91% to +8% over the same period. If climate change is taken into account, the ranges change slightly (+30% to +62% for total food demand and −91% to +30% for population at risk of hunger) but with no statistical differences overall.
- It also makes a similar point in this figure (whose licensing appears prohibitive): under the extensive development pathways (the "perfect" SSP1, baseline SSP2 and even the "screw nature, extract everything to benefit all humans" SSP5), population at risk of hunger would greatly decline under all warming pathways, from lowest to highest. Under the "instability" pathway (SSP3) and the "rich countries prosper, poor suffer" pathway (SSP4), there is a chance the population at risk of hunger increases even in the complete absence of further climate change (NOCC).
- Considering space limitations, this might be the best wording. (Bolded parts represent what I changed relative to what was recently reverted from the article.)
The World Health Organization (WHO) calls climate change the greatest threat to global health in the 21st century. In 2019 (?), they assessed deaths from coastal flooding, childhood malnutrition, exposure to heat and humidity, and from increased transmission of infectious diseases such as malaria, gastroenteritic diarrhea and dengue fever. Between 2030 and 2050 these factors could be causing 250,000 additional deaths per year, particularly threatening children and the elderly. Days with high heat stress are unsuitable for outdoor work, and if the warming reaches 4 °C, then up to 250 days per year would become unsuitable in some tropical zones. [Additional sentence on heatwaves/heat stress here - either the one we had recently, or based on a completely different paper.]
Global fishery yields will decline as every degree of warming reduces total fish biomass. By 2050, global livestock headcounts could decline by 7-10%, as less animal feed will be available. Crop yields are already getting negatively affected by stronger heatwaves and water stress, but globally, this has been strongly outweighted by greater farm productivity. Between 2010 and 2050, the number of people at risk of hunger will be far more affected by socioeconomic developments than climate change. It is expected to increase by up to 30% if there is stagnation or major instability in the developing countries, and will decrease by hundreds of millions otherwise, substantially reducing annual deaths from malnutrition. Climate risks to agriculture increase after 2050 at higher warming levels. Out of areas currently used for agriculture and livestock rearing, a third may stop being usable by 2100 under high emission scenarios.
- Again, I'm restoring previous version. Bogazicili (talk) 17:16, 4 February 2024 (UTC)
Reasoning for these changes: besides what I already mentioned above, I took into account the point that climate change can cause deaths in other ways too, and those were simply the ones WHO looked at during that year (probably 2019.) I also think it's important to clarify that "diarrhea" is not a disease "in and of itself", but it is often caused by various diseases which all cause inflammation known as gastroenteritis. For heat stress at 4C, the figure really applies to all outdoor work - it was reasonable to specify agricultural workers when it was in the paragraph on food, but not so much otherwise. What really should be specified instead is that 250 days was the upper limit which would apparently be limited to the most unlucky locations, not a blanket impact across all tropics. InformationToKnowledge (talk) 11:34, 5 February 2024 (UTC)
- P.S. I would still like to talk about short-term shocks to food supply from (multiple) breadbasket failures somewhere in this section. That, and I would ideally like to mention CO2 fertilization effect, and the reductions in crop micronutrient content it causes/global micronutrient deficiencies it can cause, but I am not sure on how to fit both of those. Hopefully, it would become easier if the section on Causes is shrunk. InformationToKnowledge (talk) 12:11, 5 February 2024 (UTC)
- InformationToKnowledge, I disagree with above changes, a lot of information is lost. You are suggesting a massive re-write without adequately explaining reasoning. Some of my objections:
- 1) Why did "Extreme weather leads to injury and loss of life," got taken out for example?
- 2) "Various infectious diseases are more easily transmitted in a warmer climate, such as dengue fever and malaria." and then the WHO numbers are not repetition. One is explaining why there is an increase, the other is giving a number. "dengue fever and malaria" as examples from the earlier sentence can be taken out however.
- 3) What happened to "By 2100, 50% to 75% of the global population may face climate conditions that are life-threatening due to combined effects of extreme heat and humidity."?
- 3) Why did 8 to 80 million people at risk of hunger by 2050 got taken out? Yes, population at risk of hunger may "decrease by hundreds of millions otherwise" in total because a lot of countries do get more developed. Why is this more relevant rather than just looking effects of climate change? I mean you complained about baseline being "ideal counterfactual future without climate change, as opposed to calculating them relative to the present day". But why would you compare 2050 with present day without accounting for the development of countries? 8 to 80 million is a more simple number, because it isolates effects of climate change. However, I'm more open to this change after wording changes. Your wording didn't make it clear that upper limit rose from 8% to 30% due to climate change. It made it sound like " stagnation or major instability in the developing countries" was the only factor. Misleading.
- 4) Why did "30 to 50%" numbers got removed for labour capacity reductions? The source doesn't specify this is just for food workers, although previous sentence talks about it.
- 5) Why did "it has caused reduction in global yields of maize, wheat, and soybeans between 1981 and 2010." got removed?
- 6) Second paragraph does not accurately reflect the World Bank Source above
- You are suggesting massive re-write of a version that's been stables for years, and I do not see the rationale for change. Definite no. We can go over some sentences one by one, like the at risk of hunger sentence. But I'm disagreeing with the proposed wholesale change. Bogazicili (talk) 15:17, 5 February 2024 (UTC)
- InformationToKnowledge, also, given how you are proposing these massive changes, going over them is very time consuming. Moving forward, would you mind making these big change suggestions in one of the following formats:
- Talk:Climate_change/Archive_93#Lead's_description_of_the_greenhouse_effect
- Talk:Climate_change/Archive_92#Mention_inequity_between_polluters_and_pollutees_in_the_lead
- Talk:Climate_change/Archive_85#Need_to_reevaluate_recent_edits_to_first_two_mitigation_paragraphs
- Basically including both the current version and your suggested change, and striking out removals and bolding additions. This is very helpful, and multiple editors used something like this when suggesting big changes. Bogazicili (talk) 16:38, 5 February 2024 (UTC)
- I made a deeper revert to stable version, while talk page discussions go on. Just made 2 changes, which I don't think are controversial. Bogazicili (talk) 17:40, 5 February 2024 (UTC)
- Firstly, it's unfortunate that you aren't following this discussion very closely, because a substantial fraction of the current suggested wording has been there after @Efbrazil edited my earlier proposals. See this revision. Efbrazil also signed off on my previous addition, which you reverted, so need to take up those questions with them as much as you do with me.
- Essentially, about half of your questions can be answered very simply - because I keep getting told that we are running out of article space, so any real additions would have to come at the expense of something else. Thus, we need to condense and prioritize.
- I'll address the basic points first, and then I'll show the revised text.
- 1)
Why did "Extreme weather leads to injury and loss of life," got taken out for example?
- Because it's an extremely general and a very obvious statement, which does not even have a real number attached to it. It does not add any real value to the collage in the lead showing wildfires as an example, to the "Climate change impacts on the environment" gallery showing the Australian wildfires and, most of all, to the Extreme weather figure from the IPCC directly above this section already showing a massive increase in extreme weather. If you really want to keep this wording, I would suggest moving it to that graphic's caption instead. - 2)
"Various infectious diseases are more easily transmitted in a warmer climate, such as dengue fever and malaria." and then the WHO numbers are not repetition. One is explaining why there is an increase, the other is giving a number.
One of my proposed sentences literally says {tq|from increased transmission of infectious diseases}}. The fact that the climate is getting warmer is said so many times throughout the article that any reader who would have made it to this section does not need it spelled out again. Efbrazil also believes that readers can make this connection for themselves. And it's not even a good explanation either, since it does not say what increases transmission in a warmer climate. - 3) [I]
What happened to "By 2100, 50% to 75% of the global population may face climate conditions that are life-threatening due to combined effects of extreme heat and humidity."?
- It's potentially a sentence I placed in square brackets:[Additional sentence on heatwaves/heat stress here - either the one we had recently, or based on a completely different paper.]
I wrote very detailed comment on why we may not want to cite that particular paper (which will be 7 years old this year) and instead use any one of the newer and better-defined papers in this revision. - 3) [II]
But why would you compare 2050 with present day without accounting for the development of countries?
Because, this article is aimed for a general reader. Here a couple of relevant examples of the mindset of many general readers.
- I made a deeper revert to stable version, while talk page discussions go on. Just made 2 changes, which I don't think are controversial. Bogazicili (talk) 17:40, 5 February 2024 (UTC)
Some public polling shows that beliefs in civilizational collapse or even human extinction have become widespread amongst the general population in many countries. In 2021, a publication in The Lancet surveyed 10,000 people aged 16–25 years in ten countries (Australia, Brazil, Finland, France, India, Nigeria, Philippines, Portugal, the UK, and the US): one of its findings was 55% of respondents agreeing with the statement "humanity is doomed".[1]
In 2020, a survey by a French think tank Jean Jaurès Foundation found that in five developed countries (France, Germany, Italy, the UK and the US), a significant fraction of the population agreed with the statement that "civilization as we know it will collapse in the years to come"; the percentages ranged from 39% in Germany and 52% or 56% in the US and the UK to 65% in France and 71% in Italy.[2]
- The people who think this way do not expect there to be any real development of countries by 2050. Not acknowledging that these people now make up a significant fraction of our readers is tantamount to wilful blindness.
8 to 80 million is a more simple number, because it isolates effects of climate change.
- Again, it's not simple when it relies on "common sense" assumed knowledge which potentially a majority of readers no longer possess. (If we assume that those ~52% of people from the UK/US who said civilization will collapse in that French poll are representative of English Wikipedia, which isn't the worst assumption to make.) Secondly, we already have both effects of climate change and effects of climate change on agriculture This overview article needs to give the most basic facts, which, in this case is the net effect here. The details relative to an ideal state are already present in effects of climate change on agriculture and they can stay there.Why did "30 to 50%" numbers got removed for labour capacity reductions?
Because I was repeatedly told that the article must stay under 9000 words, and I have already made some additions elsewhere that brought it closer to the limit, yet which I consider more necessary than this wording. (I.e. mentioning the Southern Ocean overturning circulation tipping point or the committed increase in ocean deoxygenation.) The article was at 8692 words before I started making edits. Before your reversions, it was at 8822 words. Now, it is at 8913 words. As I said, it seems like we might shorten it elsewhere quite a bit, but a few days ago, it didn't seem that way, so I had to compromise.- 5)
Why did "it has caused reduction in global yields of maize, wheat, and soybeans between 1981 and 2010." got removed?
Same reasons as in 3). a) this isn't effects of climate change on agriculture, where mentioning specific crops and dates is appropriate detail; b) it is very likely that declines occurred in other crops - those three are simply the ones we have the best data for; c) it does not specify how large the decline was, leading our readers to assume any number. d) it does not specify that this was relative to climate-free counterfactual; e) The new sentence,Crop yields are already getting negatively affected by stronger heatwaves and water stress
conveys a similar amount of information (more in fact, as it explains what caused the reductions), while avoiding all of the issues above. - 6)
Second paragraph does not accurately reflect the World Bank Source above
a) You haven't specified what exactly you meant; b) year 2021 Nature meta-analysis is a far more important source than the year 2016 World Bank report anyway.
More discussion of food and health
First phase
| ||||||||
|---|---|---|---|---|---|---|---|---|
|
I wasn't aware of using table format for making comparisons, so there it is. 1st paragraph
2nd paragraph
I would hope I have already adequately explained the reasons for these changes, but just in case:
InformationToKnowledge (talk) 19:50, 5 February 2024 (UTC)
|
Second phase
| ||||||||||
|---|---|---|---|---|---|---|---|---|---|---|
2nd paragraph
As Femke has already pointed out, some of the wording I added in the last revision, in large part to address your concerns, is making some paragraphs too long, so at least one revision to cut some wording will be necessary. I have already written out the reasons for the changes I made in my previous message, so please ensure you check it before asking further questions. Now... 1) and 2): When we are struggling with word counts, both within a paragraph and within an entire article, duplicative/explanatory wording is just less important than wholly new information. Like facts about the effects on livestock (completely absent in the older version) or about areas becoming unusable (much better and more concrete than the vague sentences about latitudes and water stress.) And as I said, the sentence on extreme weather & injury/loss of life can simply be moved to a caption of the extreme weather figure directly above it. If anything, more readers will see it there. 3 and 4): First and foremost, "which currently affects 30% of the global population" is NOT WP:OR by ANY means. It is taken directly from the Carbon Brief reference, which I have added in one of the revisions prior to the one you pointed to, yet which you had now removed with your reversions. That reference is also what provides explanations about what that paper actually means and why it's never been a particularly good citation. Secondly, how can you possibly write Besides, even if we assume that most readers know that development will be doing a lot to improve food availability, we are still inherently making assumptions about how much they think/know it will improve if we don't spell out the numbers. Thus, it's just easier to write something closer to my wording in the first place. Like you said 5) From the abstract:
From a section near the end:
And I don't know if this should be cited in the article, but this chart shows beyond doubt that the yields for those and other crops are larger now than they were in 1981. Hence, the negative effect was obviously offset. 6) Thus, socioeconomic changes are far more important than the 2010-2050 warming, according to the study. The wording in the suggested version reflects that. - Further, while it's going to be very difficult to explain this in the article, it should also be noted that this combination is extremely unlikely, because it effectively requires that massive quantities of fossil fuels are extracted and burnt every year (RCP 8.5), yet this somehow fails to benefit the developing world economically. When the IPCC uses RCP8.5 now, it's almost always in combination with SSP5 (massive fossil-fuelled development), since the developing countries would have to be the ones responsible for a huge bulk of the new coal pits/wells and new thermal power plants, cars, etc. - else there is no demand to produce those massive, continually accelerating emissions in the first place. Finally, thanks for the suggestion about expanding the Climate_change#Public_awareness_and_opinion section. Unfortunately, it'll require at least 2-3 sentences, and I don't think I can add that until a similar amount is cut elsewhere in the article.InformationToKnowledge (talk) 07:07, 6 February 2024 (UTC) References
InformationToKnowledge, for the "but globally, this has been strongly outweighted by greater farm productivity" part in your suggestion, can you provide a quote from the source ("IPCC AR6 WG2 2022, p. 727")? That was the source in this version [7]. I skimmed through that page, but couldn't find it. Can read more carefully tomorrow too, but a quote would be helpful. Bogazicili (talk) 23:40, 11 February 2024 (UTC)
|
Third phase
| ||
|---|---|---|
|
InformationToKnowledge,
You said:
So changes: 1) Reduces length in first paragraph. 2) gives context for heat and humidity ("which currently affects 30% of the global population") 3) Adds increase in agricultural productivity in second paragraph 4) Gives more executive summary in second paragraph, with mostly SPM and TS. 5) Incorporates study you found [18] 6) Might make further minor copy editing, and also will need to check against close paraphrasing again. Bogazicili (talk) 22:58, 25 February 2024 (UTC)
|
@EMsmile: here's my updated suggestion based on the new sources [24] (see the chart at the bottom) and [25]. Also added rephrased "and depending on the level of global warming" to the last sentence after InformationToKnowledge's suggestion. Keep in mind this is not the final suggestion. Might include minor copy editing, and also will need to check against close paraphrasing again.
Additions are bolded. Deletions are struck:
|
The World Health Organization (WHO) calls climate change the greatest threat to global health in the 21st century.
|
Also I don't think there's any reason to be sceptical about Wikipedia:Dispute resolution noticeboard. I think it'd be more efficient with less back and forth. Bogazicili (talk) 16:36, 11 March 2024 (UTC)
- Btw, my suggestion now has a word count of 231 vs the current 243. Bogazicili (talk) 16:58, 11 March 2024 (UTC)
- Is this the same suggestion that InformationToKnowledge would put forward, or is the problem that both of you have different preferred versions that you're putting forward? Also, when you made the proposed changes, did you keep in mind reading ease aspects? E.g. this is perhaps using unnecessarily complex words:
Climate change is projected to adversely impact water-related illnesses
. Or perhaps the argument is: let's agree on content first and do the wordsmithing later? EMsmile (talk) 21:44, 11 March 2024 (UTC)- Yes, the whole issue is that tend to disagree on every other sentence, so there have been about three waves of differing proposals from either of us by now. I have hidden the discussion about those three by now, so that the other editors can still click on the boxes to read them, but would otherwise focus their attention on the latest proposals for the section. You can see Bogazicili's proposal above, and my proposal is here. Since the former proposal already shows the original's section text in the struck-out sections, I decided not to duplicate that, and only to bold the writing that is mine:
- Is this the same suggestion that InformationToKnowledge would put forward, or is the problem that both of you have different preferred versions that you're putting forward? Also, when you made the proposed changes, did you keep in mind reading ease aspects? E.g. this is perhaps using unnecessarily complex words:
|
The World Health Organization (WHO) calls climate change the greatest threat to global health in the 21st century. It has estimated that between 2030 and 2050, climate change would cause around 250,000 additional deaths per year due to impacts such as increased levels of extreme heat, greater frequency of extreme weather and changes in disease transmission. Lethal infectious diseases such as dengue fever and malaria are more easily transmitted in a warmer climate.[231] 30% of the global population currently live in areas where extreme heat and humidity can be potentially lethal, (CB reference) particularly to children and the elderly.[233] By 2100, 50% to 75% of the global population would live in such areas.[235] Agricultural and socioeconomic changes had been increasing global crop yields since the middle of the 20th century, [Our World in Data reference] but climate change has already slowed the rate of yield growth.[IPCC AR6 WG2 Summary for Policymakers p.9] Fisheries have been negatively affected in various regions.[IPCC AR6 WG2 Summary for Policymakers p.9] By 2050, the number of people suffering from undernourishment and the associated health conditions is likely to decrease by tens to hundreds of millions, but some combinations of severe climate change and low socioeconomic development may increase that number instead. (2021 meta-analysis) By 2050, global livestock headcounts could decline by 7-10% under higher warming, as less animal feed will be available.[IPCC AR6 WG2 p.748] Extreme weather events adversely affect both food and water security, and climate change increases their frequency.[IPCC AR6 WG2 Summary for Policymakers p.9][230] If the emissions remain high, food availability will likely decrease after 2050 due to diminishing fisheries and livestock counts, and due to more frequent and severe crop failures.[IPCC AR6 WG2 p.797] |
Basically, these are the main things we have been arguing about for the past two months or so, and what the rest of editors here can hopefully decide on without invoking outside mechanisms:
1) We both agree that the WHO's mortality increase should be mentioned in the first paragraph, but how much detail to devote to each cause? You can see that Bogazicili favours more writing there, and I favour less. I find that sentences like "Extreme weather events affect public health. Temperature extremes lead to increased illness and death..." are too general and colourless to be of much use, and phrasing like "transmission risk of various diseases...Climate change is projected to adversely impact water-related illnesses." is outright confusing. I also find that mentioning WHO's words once, then writing several general sentences, then doubling back to WHO with a sentence running through each cause is outright duplicative at times.
2) Best way to phrase the sentence which discusses that finding on "life-threatening conditions" and extreme heat/humidity. You can probably just compare the two versions.
3) How explicitly to note that crop yields, etc. have been increasing to date? I also use "Extreme weather events adversely affect both food and water security" later in the article instead of "climate change has reduced water and food security" in Bogazicili's proposal, because I both find it closer to the reference, and because the other wording is unclear. "climate change has reduced water and food security" relative to what? A specific year in our recent past, or a counterfactual where climate change has not been happening? If we can't explain a particular wording in the paragraph text, we should not use it.
4) Do we need to talk about latitudes in this particular article, as opposed to the sub-articles? I would say that when the wording is as vague as "various high latitude areas", it's best not to bother.
5) Do we need to mention livestock, a massively important part of food production in many countries? I believe so, but Bogazicili is apparently unconvinced.
6) How explicit should we be about projections for mid-century? I find that Bogazicili's wording is far too confusing for this article and does not properly represent the reference chosen, as opposed to my wording.
7) How to talk about food security, etc. in the second half of the century? One issue we have been arguing is that Bogazicili chooses to use 2040 because WG2 SPM is separated into near-term (2022-2040) and 2040-2100 sections, but almost everything else uses 2050, including the relevant chapter of WG2. However, there have been other disagreements, as you can probably tell from the differences in wording.
I find that these are the 7 main questions other editors should comment on. InformationToKnowledge (talk) 17:45, 12 March 2024 (UTC)
Should the effects collage be restored to the lead?


![A dry lakebed in California, which is experiencing its worst megadrought in 1,200 years.[1]](/wiki/File:California_Drought_Dry_Lakebed_2009.jpg)
Please vote below whether you Support or Oppose having the effects collage (shown on the right) restored to the lead, as it was here before being edited out. The argument for cutting it was simply "too many images in the lead". Arguments for restoring it are that we don't have a visual presentation of effects until much later, plus the lead is long and is followed by a definitions section that does not have images, so I don't know that having lots of images in the lead is a problem. As an introductory article visuals are important. Efbrazil (talk) 20:39, 17 February 2024 (UTC)
- Support keeping in it. The balance between graphs (technical & scary) and images (accessible) is worse than it was previously. I'm pretty sure I wouldn't get consensus for it, but if we want to be closer to normal practice with the number of figures in the lead, I would skip the very first one. (minor Point of order, we don't vote, but !vote on Wikipedia, as these things are still discussions even with bolded declarations). —Femke 🐦 (talk) 20:43, 17 February 2024 (UTC)
- Mild support. As overflow into the non-image-bearing /*Terminology*/ section does not seem to bother most other editors, it's fine to replace the image collage in the lead (but not lower in the article, where subsections under /*Impacts*/ already contain two five-image image collages that include a wildfire, coral and drought). —RCraig09 (talk) 21:54, 17 February 2024 (UTC)
- Neutral The collage was fine where it was before deletion, showing impacts in chapter Impacts. The current 2 graphs in the lead show temperature change. What the lead of Climate Change should show is a climate change graph. For example: What are the climate changes, pre-industrial versus current of Tokyo, Delhi or Shanghai? Uwappa (talk) 18 February 2024 (UTC)
- Oppose. Not surprisingly, I am opposed to restoring it (as I was the one who took it out in the first place). I don't understand why this article should need 5 images in the lead when other featured articles on Wikipedia manage to stick closer to the convention of having just one representative image (or an image collage of 4). Couldn't we devise an image collage of 4, just like at effects of climate change on agriculture? It could be a mixture of graphs and images, but in a 2 x 2 collage. If people insist that the 3-image collage of effects need to be in the lead, can we take another closer look if the choice of images is really ideal? Each of the images shown also has other causes, not just climate change. So I think it's hard to explain it all with the short caption. I especially find the coral bleaching image problematic, as coral bleaching has a range of causes (also nutrient pollution). Plus, it only speaks to those people who have ever seen colourful corals in real life (like scuba divers, or locals) or in movies... One could argue that a more important image on effects would be one showing an extreme weather event, like a flood from an intensified hurricane, or a photo showing a heatwave. By the way, the 4 image collage at effects of climate change is also not the best; I am not sure about the one showing an abandoned village in Mali; again, there could be all sorts of causes for that. I think the causal link is not clear. Also it says there "bleached coral caused by ocean acidification and heating" which I think is unclear and possibly wrong (do we have evidence that the ocean acidification is already now contributing to coral bleaching?) EMsmile (talk) 11:11, 18 February 2024 (UTC)
- I'm very happy to re-look at the 3 images in a separate discussion. I think this should ideally be a 4-image collage; I believe one image may have been removed due to something like copyright, and we started out with four.
- I don't think a 4-image collage with a graph can be made accessible. The text would not be readable for a reasonable size of a 4-image collage. —Femke 🐦 (talk) 18:55, 18 February 2024 (UTC)
- Like Femke says, we do not want charts and graphs shrunk down so the content is not longer visible in thumbnail view. A lot of work has gone into making the charts and graphs readable in thumbnail and smartphone views. Regarding other points raised above:
- There are major benefits to having all the images, and the only drawback seems to be "it's not conventional". We should care about the user experience, not what's conventional.
- The vast majority of our users are on smartphone, and for them whether the content is a collage or separate images makes no difference, as the images are shown the same way. The articles "effects of climate change" and "effects of climate change on agriculture" will have 4 or 5 images in the lead for the vast majority of our users.
- Whether the images should be changed is really a separate discussion like Femke says. Briefly, heatwaves, hurricanes, and floods all happened before climate change of course, so they have the same issue you are raising with coral. Heatwaves are hard to show visually. Hurricanes and climate change is a very mixed story we shouldn't lead with. Floods are a serious issue and could be added in place of drought or fire. Coral I would want to keep as it is likely the ecosystem being most damaged by climate change currently and the science shows that virtually all coral reefs are vulnerable this century to destruction by the combination of temperature change and acification.
- What is in the Effects of Climate Change collage should be discussed on the talk page there.
- Efbrazil (talk) 18:58, 18 February 2024 (UTC)
- Support Likely obvious as I brought this forward for discussion. I just don't see any harm in having more images in the lead, and I see major benefits in having a visual presentation of effects early on. Efbrazil (talk) 18:41, 18 February 2024 (UTC)
References
- ^ Ivanova, Irina (June 2, 2022). "California is rationing water amid its worst drought in 1,200 years". CBS News.
Revisiting the choice of images for the effects in the lead


As per request above I am starting a new section to discuss and revisit the choice of images for the effects in the lead. I think we should have a 2 x 2 collage and maybe - to make our lives easier and for efficiency reasons - simply take the same collage as is used at effects of climate change (or make them the same at the end of the discussion). I copy my concerns about the current group of 3 from above: EMsmile (talk) 23:59, 18 February 2024 (UTC)
- Each of the images shown also has other causes, not just climate change. So I think it's hard to explain it all with the short caption. I especially find the coral bleaching image problematic, as coral bleaching has a range of causes (also nutrient pollution). Plus, it only speaks to those people who have ever seen colourful corals in real life (like scuba divers, or locals) or in movies... One could argue that a more important image on effects would be one showing an extreme weather event, like a flood from an intensified hurricane, or a photo showing a heatwave. By the way, the 4 image collage at effects of climate change is also not the best; I am not sure about the one showing an abandoned village in Mali; again, there could be all sorts of causes for that. I think the causal link is not clear. Also it says there "bleached coral caused by ocean acidification and heating" which I think is unclear and possibly wrong (do we have evidence that the ocean acidification is already now contributing to coral bleaching?) - I could put this on the talk page of effects of climate change but it might be more efficient to discuss both issues together here, and to use the same 4 images and caption in both articles. EMsmile (talk) 23:59, 18 February 2024 (UTC)
- Also copied from above is Femke's reply "I'm very happy to re-look at the 3 images in a separate discussion. I think this should ideally be a 4-image collage; I believe one image may have been removed due to something like copyright, and we started out with four" EMsmile (talk) 23:59, 18 February 2024 (UTC)
- Also copied from above is Efbrazil's reply: "Briefly, heatwaves, hurricanes, and floods all happened before climate change of course, so they have the same issue you are raising with coral. Heatwaves are hard to show visually. Hurricanes and climate change is a very mixed story we shouldn't lead with. Floods are a serious issue and could be added in place of drought or fire. Coral I would want to keep as it is likely the ecosystem being most damaged by climate change currently and the science shows that virtually all coral reefs are vulnerable this century to destruction by the combination of temperature change and acidification." EMsmile (talk) 23:59, 18 February 2024 (UTC)
- The image collage does not show climate change. It shows effects of climate change, which is fine for the lead of Effects_of_climate_change.
- The current 2 graphs show change of temperature, global warming. Neither shows temperatures since 1850.
- Revolutionary idea: The lead of climate change should show... an image that depicts climate change, differences between a pre-industrial climate and its current version. Yes I know, it is a big step. At the moment Climograph at the English Wikipedia does not yet have graphs such as


- Take those climate graphs one step further, create an original image that shows climate change:

- What are the climate changes?
- Which months are drier?
- Which are wetter?
- Which months are hotter?
- Which are cooler?
- Jumping 2 steps forward: Show the impact with background colours. Which months are moving into a 'red' danger zone, agriculture not possible anymore? Which months are moving towards green? Uwappa (talk) 08:45, 19 February 2024 (UTC)
- The current lead images crystalize the issue of hotter temperatures, their location, and their cause. The effects collage then shows some effects of those hotter temperatures, which include droughts and fire and ecosystem damage. I'm not sure how it can be said the current lead images don't focus on climate change.
- This is an introductory article and the lead in particular should be targeted at a middle school level of education. I don't support going to a more confusing, graduate level set of images.
- In general, the only changes I think could make sense here are updating the effects collage. Maybe somebody could make a proposal with updated images that include an image on storm intensification, maybe from the 2022 Pakistan floods. Efbrazil (talk) 17:31, 19 February 2024 (UTC)
- Impact section has 4 subsections:
- 5.1 Environmental effects
- 5.2 Tipping points and long-term impacts
- 5.3 Nature and wildlife
- 5.4 Humans
- Maybe we can have an image for each. For tipping points, we can put an image representing one of the tipping points likely before 2C (in dark red) here [31]. The images suggested by EMsmile might already cover all 4 subsections. Bogazicili (talk) 22:09, 21 February 2024 (UTC)
- Efbrazil, how current lead images don't focus on climate change? It is the difference between temperature change and climate change.
- Impact section has 4 subsections:
-
 one temperature
 -
 temperature change


-
 one climate
 -
 climate change

Uwappa (talk) 09:37, 26 February 2024 (UTC)
- Temperature is a major part of climate. Climate involves many other things too numerous to capture in one or two images or charts, which is why you have a "?" graphic above. Also, after a renaming/move a few years ago, "global warming" redirects here, so temperature is probably the most important aspect of climate change. —RCraig09 (talk) 15:43, 26 February 2024 (UTC)
- Seconding what Craig said. Also, I'm not sure what you are expecting people to learn from looking at the "one climate" image. I don't see a monthly breakdown as interesting. For showing precipitation changes, the soil moisture map that is later in the article works better, as precipitation changes will be a highly localized phenomena. That image is unfortunately a bit too technical for the lead I think, as it shows standard deviations of moisture change and is a projection at 2 C. We want to keep the lead squarely focused on the basics. Efbrazil (talk) 19:05, 26 February 2024 (UTC)
- What I expect people to learn from looking at a Thermopluviogram (or any Climograph)?
- Two variables are important for a climate:
- temperature (thermo)
- rain (pluvio).
- Two variables is a big mental step from: only one variable matters for a climate and that is temperature.
- The question mark: What would the big brother of a thermopluviogram look like, a climate change diagram showing long term changes in temperature and precipitation? What would your design be for a simple diagram that suits the lead of climate change?
- Alternative: a 'precipitation change over the past 50 years' globe, similar to
 that complements
  .
. - Suggestion: swap green for blue, the colour of water. Uwappa (talk) 20:36, 26 February 2024 (UTC)
- Uwappa: I don't think you are convincing anybody here on the thermopluviogram or any other highly technical type of graph. I'm not that keen on another graph in the lead, but the precipitation change over 50 years is quite nice. —Femke 🐦 (talk) 20:48, 26 February 2024 (UTC)
- I think that consensus here over the years is to resist foundational changes in how things are charted. Warming stripes were resisted because they were new and too simplistic; conversely, climograms are resisted because they're new and techy (and describe only two dimensions of climate change rather than one—not much of an improvement). I'm afraid we have to be ~conventional in our communication, especially in high-level articles, mostly because our audience is lay people who are not eager to learn new charting methods. —RCraig09 (talk) 04:34, 27 February 2024 (UTC)
- I am not suggesting a thermometer, thermopluviogram or any highly technical graph. Here is a rephrase of the question:
- Uwappa: I don't think you are convincing anybody here on the thermopluviogram or any other highly technical type of graph. I'm not that keen on another graph in the lead, but the precipitation change over 50 years is quite nice. —Femke 🐦 (talk) 20:48, 26 February 2024 (UTC)
- Seconding what Craig said. Also, I'm not sure what you are expecting people to learn from looking at the "one climate" image. I don't see a monthly breakdown as interesting. For showing precipitation changes, the soil moisture map that is later in the article works better, as precipitation changes will be a highly localized phenomena. That image is unfortunately a bit too technical for the lead I think, as it shows standard deviations of moisture change and is a projection at 2 C. We want to keep the lead squarely focused on the basics. Efbrazil (talk) 19:05, 26 February 2024 (UTC)
-
one temperature
-
 temperature change

-
 one climate
 -
climate change

Uwappa (talk) 08:05, 27 February 2024 (UTC)
Two possible answers to the question "What would a climate change diagram look like":
-
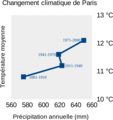 Four periods of each 30 years. Each period is hotter and drier than the previous, with the exception of 1941-1970 which was hotter but drier.
 -
 Climate change in Paris 1881-2000 by month. All months are hotter. Most months are wetter, but summer months June and August are drier.


![[31]](https://en.wikipedia.org/wiki/Tipping_points_in_the_climate_system#/media/File:Tipping_points_2022_list.jpeg)
Suggestion: zoom out. These are diagrams for just one city. What would a diagram look like for a country, a continent, earth? My answer: same style of diagrams can be used, just feed them with other data. Uwappa (talk) 08:10, 28 February 2024 (UTC)
Long-term chart
Talking of graphs and charting I'm minded to include this (from NOAA) to introduce a long term context. What do you think?
- [32]https://www.climate.gov/media/11332 Lukewarmbeer (talk) 07:52, 27 February 2024 (UTC)
- That's from here BTW Lukewarmbeer (talk) 07:54, 27 February 2024 (UTC)
- Extremely long time frames like the one you linked to are more likely to be confusing to a lay audience, as they could make it appear that climate change is no big deal in the grand sweep of planetary history. What's important about climate change is how it relates to life on Earth today (including us), not how it relates to our planetary history of solar, atmospheric, and geological processes.
- I think the best "long" time frame to add would be from when modern humans evolved, which is about 300K years ago. Ideally the smoothing would be a 20 year interval, to match the IPCC definition of climate. We have this high resolution data from the last 2K years, maybe it could be extended back further. The trouble is that data sets going back further are less reliable and don't have annualized data. Efbrazil (talk) 18:48, 27 February 2024 (UTC)
- I'm not sure providing a long time frame for context is going to mislead anyone.
- Can you help me understand why that would be the case. Lukewarmbeer (talk) 17:51, 28 February 2024 (UTC)
- Current global warming, which is "only" 1.4+ °C in comparison, looks dwarfed by changes millions of years ago. This visual juxtaposition gives layman viewers the impression the current global warming is trivial, which it's not. —RCraig09 (talk) 18:00, 28 February 2024 (UTC)
- Well said. I'd also point out that current warming is happening on a time scale that those older charts do not include, as they smooth data over time periods of thousands to millions of years. If you honor that smoothing function, current warming wouldn't show up at all.
- Also, the impacts of climate change are going to be felt by life on Earth today, so what's relevant is the time period that life on Earth evolved to live in. Data prior to a few million years back may be interesting in an academic sense, but it's irrelevant to the concerns of life on Earth today. Efbrazil (talk) 19:54, 28 February 2024 (UTC)
- I understand. I'll have a more thorough look at our section
- Temperature records prior to global warming
- and Main articles: Climate variability and change; Temperature record of the last 2,000 years; and Paleoclimatology
- and see how these articles are fitting together and come back. Lukewarmbeer (talk) 21:58, 28 February 2024 (UTC)
- Current global warming, which is "only" 1.4+ °C in comparison, looks dwarfed by changes millions of years ago. This visual juxtaposition gives layman viewers the impression the current global warming is trivial, which it's not. —RCraig09 (talk) 18:00, 28 February 2024 (UTC)
Tidying up list of sources?
I noticed that there are quite a few of these notifications in the list of sources now: "Harv warning: There is no link pointing to this citation. The anchor is named CITEREFThe_Guardian,_26_January2015." (I can't remember now if one needs to have a script installed to see this Harv warnings or if they're always there). Can someone, or shall I, remove those particular sources now? I assume they are "left overs" when sentences were removed. EMsmile (talk) 10:39, 12 March 2024 (UTC)
- Wikipedia featured articles
- Featured articles that have appeared on the main page
- Featured articles that have appeared on the main page twice
- Old requests for peer review
- Wikipedia In the news articles
- FA-Class vital articles
- Wikipedia level-3 vital articles
- Wikipedia vital articles in Physical sciences
- FA-Class level-3 vital articles
- Wikipedia level-3 vital articles in Physical sciences
- FA-Class vital articles in Physical sciences
- FA-Class Antarctica articles
- High-importance Antarctica articles
- WikiProject Antarctica articles
- FA-Class Arctic articles
- High-importance Arctic articles
- WikiProject Arctic articles
- FA-Class Climate change articles
- Top-importance Climate change articles
- WikiProject Climate change articles
- FA-Class Environment articles
- Top-importance Environment articles
- FA-Class Effective Altruism articles
- High-importance Effective Altruism articles
- FA-Class geography articles
- Top-importance geography articles
- WikiProject Geography articles
- FA-Class Geology articles
- High-importance Geology articles
- High-importance FA-Class Geology articles
- WikiProject Geology articles
- FA-Class Globalization articles
- High-importance Globalization articles
- FA-Class sanitation articles
- Mid-importance sanitation articles
- WikiProject Sanitation articles
- FA-Class Science Policy articles
- High-importance Science Policy articles
- FA-Class Weather articles
- Top-importance Weather articles
- FA-Class Climate articles
- Top-importance Climate articles
- WikiProject Weather articles
- Pages in the Wikipedia Top 25 Report
- Externally peer reviewed articles
- Externally peer reviewed articles by The Denver Post
- Wikipedia pages referenced by the press
- Wikipedia articles that use British English