
Wikipedia:Reference desk/Mathematics: Difference between revisions
→Am I smarter than a 5th grade math textbook?: hedgehogs, half bees and stuff |
|||
| Line 186: | Line 186: | ||
:I can't make sense of all that, but there is a famous book called [[How to Lie with Statistics]] that is probably the sort of thing you are looking for. [[User:Looie496|Looie496]] ([[User talk:Looie496|talk]]) 06:47, 2 March 2013 (UTC) |
:I can't make sense of all that, but there is a famous book called [[How to Lie with Statistics]] that is probably the sort of thing you are looking for. [[User:Looie496|Looie496]] ([[User talk:Looie496|talk]]) 06:47, 2 March 2013 (UTC) |
||
::Actually, the first sentence is the question. [[User:Sneazy|Sneazy]] ([[User talk:Sneazy|talk]]) 06:55, 2 March 2013 (UTC) |
::Actually, the first sentence is the question. [[User:Sneazy|Sneazy]] ([[User talk:Sneazy|talk]]) 06:55, 2 March 2013 (UTC) |
||
:::Actually there are two questions and one statement with an appending question mark. Looie answered your second question. As for the first, indeed correlation is correlation and not causation. Your reasoning is somewhat convoluted and the agency of a statistician need not be invoked to show that they are fundamentally and conceptually different. |
|||
Revision as of 08:51, 2 March 2013
![]()
of the Wikipedia reference desk.
Main page: Help searching Wikipedia
How can I get my question answered?
- Select the section of the desk that best fits the general topic of your question (see the navigation column to the right).
- Post your question to only one section, providing a short header that gives the topic of your question.
- Type '~~~~' (that is, four tilde characters) at the end – this signs and dates your contribution so we know who wrote what and when.
- Don't post personal contact information – it will be removed. Any answers will be provided here.
- Please be as specific as possible, and include all relevant context – the usefulness of answers may depend on the context.
- Note:
- We don't answer (and may remove) questions that require medical diagnosis or legal advice.
- We don't answer requests for opinions, predictions or debate.
- We don't do your homework for you, though we'll help you past the stuck point.
- We don't conduct original research or provide a free source of ideas, but we'll help you find information you need.
How do I answer a question?
Main page: Wikipedia:Reference desk/Guidelines
- The best answers address the question directly, and back up facts with wikilinks and links to sources. Do not edit others' comments and do not give any medical or legal advice.
February 22
stuck on calculus homework (newton's method)
pic of my work (imgur) the lack writing is my prof's, i just don't get how he got the denominator of x3 to be 157,216. the decimal i got, 2.114816558 does not come anywhere near having a denominator of 157,216. help is appreciated, i gotta go to work but ill check this out later. — Preceding unsigned comment added by 24.139.14.254 (talk) 00:17, 22 February 2013 (UTC)
- The key word here is "as fractions". You need to do this entirely by hand, or with a calculator that has a fraction mode. Sławomir Biały (talk) 00:43, 22 February 2013 (UTC)
- My calculator has a fraction mode, but it only allows 3 digits in the denominator (and 8 digits in all). —Tamfang (talk) 04:47, 31 October 2013 (UTC)
- Using f(x) = x4 − 20 and noting that f'(x) = 4x3 and the Newton's method formula we get:
- You can see from the factorisation of the denominator that the fraction will only reduce if the numerator is divisible by 2 or 17, and it isn't. You can also see the improving quality of the approximations as x14 = 16, x24 = 20.3908691..., and x34 = 20.0028007... EdChem (talk) 01:20, 22 February 2013 (UTC)


- Ask yourself why you think "2.114816558 does not come anywhere near having a denominator of 157,216". That's like saying 0.499999999 does not come anywhere near having a denominator of 2, when it is in fact very close to 1/2. It is true that the exact number 2.114816558, as a fraction, has a denominator which is nowhere near 157,216, but that is irrelevant because your decimal value is only an approximation of a number x3 which cannot be fully represented in a finite number of decimal digits (unlike your x2 = 17 / 8 = 2.125). You should follow Sławomir Biały's advice above for this problem, but you should also know how to determine the numerator x where x / 157,216 ≈ 2.114816558. What happens when you multiply 2.114816558 * 157,216? Do you get something close to a whole number?
- Perhaps someone here can point you to a guide on understanding the limitations of calculators, and how to properly use them in a Calculus class. -- ToE 02:10, 22 February 2013 (UTC)
- As a former calculus teacher, I always disliked this sort of thing. In the real world, a person solving this problem would automatically use a calculator -- or a computer program. Looie496 (talk) 16:40, 22 February 2013 (UTC)
- Yeah, well, some of us really like rationals. I'd use Python's fractions module. —Tamfang (talk) 04:47, 31 October 2013 (UTC)
- As a former calculus teacher, I always disliked this sort of thing. In the real world, a person solving this problem would automatically use a calculator -- or a computer program. Looie496 (talk) 16:40, 22 February 2013 (UTC)
What are the house odds of those blackjack variants?
Variant 1: 1-Infinite deck, no surrender, no double down, no split, blackjack pays 1 to 1, dealer show his 2 cards when game start, stand-on-soft-17 variation
Variant 2: 2-Same as 1 but with just one deck. — Preceding unsigned comment added by 177.40.130.246 (talk) 11:29, 22 February 2013 (UTC)
Model of riffle shuffle done by a person
Is there a model of a riffle shuffle done by a typical person? Not a "perfect shuffle", but what a person normally does? That is, x number of cards from the left hand followed by y number of cards from the right hand, etc, where x (and y) have some probability distribution? Bubba73 You talkin' to me? 16:23, 22 February 2013 (UTC)
- Dave Bayer and Persi Diaconis used such a model in their paper Trailing the Dovetail Shuffle to Its Lair, which investigates how "close to random" a deck of cards is after n riffle shuffles and thus how many such shuffles are necessary to thoroughly randomize a deck of cards. Their model of shuffling is described in the second paragraph of the paper. —Bkell (talk) 15:00, 23 February 2013 (UTC)
- Thanks, I downloaded that, but Adobe could not open it. However, I looked at it online. Their method is not like I expected - the number of cards that go at one time is proportional to the number in that stack at the time. But maybe they tested that on people. I expected something fixed like 1 card 25% of the time, 2 cards 40%, 3 cards 30%, etc. Bubba73 You talkin' to me? 15:57, 23 February 2013 (UTC)
- It makes some sense—I think if I had a smaller stack of cards in my left hand and a larger stack in my right, I would try to riffle through the larger stack faster in an attempt to finish both stacks at the same time. That matches the probabilities in the paper. —Bkell (talk) 06:21, 24 February 2013 (UTC)
- Also, that model of the riffle shuffle makes the mathematics in the rest of the paper work out very beautifully, which is another reason to use it. —Bkell (talk) 06:25, 24 February 2013 (UTC)
- Thanks, I downloaded that, but Adobe could not open it. However, I looked at it online. Their method is not like I expected - the number of cards that go at one time is proportional to the number in that stack at the time. But maybe they tested that on people. I expected something fixed like 1 card 25% of the time, 2 cards 40%, 3 cards 30%, etc. Bubba73 You talkin' to me? 15:57, 23 February 2013 (UTC)
- But as a person is shuffling, they aren't really aware that there are more cards in one hand, so they let more cards go past that thumb. I'm looking for something that models how people actually shuffle, not beautiful mathematics. Bubba73 You talkin' to me? 17:32, 24 February 2013 (UTC)
- As one simple experiment, I separated the red and black cards of a deck, and did one riffle shuffle, then counted the runs of each color, starting with the first shuffled. I got: 3 3 2 2 1 1 1 3 4 3 2 4 2 4 4 5 6. Bubba73 You talkin' to me? 18:15, 24 February 2013 (UTC)
- The paper does say, at the beginning of the third paragraph, that experiments have shown that this model "is a good description of the way real people shuffle real cards," with a reference to Diaconis, Group Representations in Probability and Statistics, 1988. —Bkell (talk) 20:15, 24 February 2013 (UTC)
- OK, I'm going with that. Bubba73 You talkin' to me? 23:37, 25 February 2013 (UTC)
 Resolved
- OK, I'm going with that.
February 23
Mathematical symbol for specifically integer division
Anyone know of any published papers in which some specific mathematical symbol other the ones normally used to denote division (fraction line, forward slash, and division sign) was used for specifically integer division (that is, the operation performed by computers when working with integer data types in which 7 / 2 = 3 rather than 7 / 2 = 3.5) in formulas or equations in which there would be ambiguity (in a formula or equation which contains both integer and "rational" division)? For example, according to [1], an earlier version of the programming language Groovy used the backslash (\) as an operator to distinguish integer division from "rational" division, which used the usual forward slash that most programming languages use for the operation. Basically, I'm wondering if there is any previously established symbol in the mathematics scholarly literature for specifically/explicitly integer division. —SeekingAnswers (reply) 00:43, 23 February 2013 (UTC)
Addendum: I know some papers simply surround the expression with the floor function symbols (like ) to get an effectively identical result, but I was wondering if anyone knows of any other symbol for the division operator itself. —SeekingAnswers (reply) 01:11, 23 February 2013 (UTC)

- None that I'm aware of. For some purposes in mathematical logic, it's convenient to have an operation (on the naturals) that's like subtraction except it returns zero if subtraction would give a negative answer — this is called "monus" and is represented by a minus sign with a dot on top. That's a similar sort of idea, in a way, but I don't know of any such thing for integer division. --Trovatore (talk) 01:28, 23 February 2013 (UTC)
- I only know examples from programming languages. PARI/GP uses \. Python (programming language)#expression says: "In both Python 2.2+ and Python 3, // can be used to do integer division." PrimeHunter (talk) 01:34, 23 February 2013 (UTC)
- Basic uses \ -- SGBailey (talk) 22:55, 24 February 2013 (UTC)
make computation
how to make computation easy in chemistry? — Preceding unsigned comment added by 101.58.187.113 (talk) 20:15, 23 February 2013 (UTC)
- In most applications of mathematics, you should start by formulating your question as precisely as possible. I think this holds for applications in chemistry, too. JoergenB (talk) 22:48, 23 February 2013 (UTC)
- Care to tell us what type of computations you mean ? Balancing a chemical equation, for example ? StuRat (talk) 02:59, 25 February 2013 (UTC)
February 24
Terminology in Representation Theory
Suppose one has an action of a group G on a vector V space and a map that is not a homomophism into GL(V) but instead satisfies Π(g1g2) = Π(g2)Π(g1). Is there a standard name for such an "anti-representation"? Same question for Lie algebras; π([X,Y]) = - [π(X),π(Y)]? YohanN7 (talk) 20:43, 24 February 2013 (UTC)
- What you are describing is a right group action on the vector space. (Usually groups are thought of as acting on the left.) The same with the Lie algebra. Sławomir Biały (talk) 21:15, 24 February 2013 (UTC)
- Aha, thank you sir! That was too obvious for me to think of. YohanN7 (talk) 23:23, 24 February 2013 (UTC)
February 25
Linear Regression with Known Uncertainty in Y-Variable
Hi Everyone! I am a TA for an introductory Biology class. In a recent lab, the students had to perform an experiment involving osmosis, the rate of which was measured using scale (change in mass over time). However, for the negative control several students got a minute rate of diffusion (increase mass over time), this change in mass was incredibly small (less than the error associated with the scale). My goal is to explain that a change of 0.2g over a period of time when the known error in the scale is ±0.2g is insignificant. In effect H0=slope of 0 p>0.05. However, when I do a linear regression and correlation test of the students data the data is shown to be significant (reject H0). I feel if uncertainty/error were accounted for, this would not be possible. How can one demonstrate this? I'm currently using SAS for the analysis. The variables are Time and Mass I've given an example data set below. I'm willing to accept the error in the time value is negligable (± 1s) since the measurements are in minutes. Below is the student data. I'm using proc reg in SAS. Last note, I'm trying to prove this statistically to provide concrete explanations for my students instead of "feel good" or "just so" responses, especially since a good few of them were AP students and should understand the math.
Data

Time (min)     Mass (g)
0              10.5
1              10.5
2              10.6
3              10.6
4              10.6
5              10.7

proc reg data=data;
model t=m;
run;

Output from SAS:
Analysis of Variance:
Source          DF     Sum of Squares     Mean Square     F Value     Pr>F
Model            1       0.02414             0.02414        23.05     0.0086
Error            4       0.00419             0.00105
Corrected Total  5       0.02833

Root MSE          0.03237     R-Squared  0.8521
Dependent Mean   10.58333      Adj R-Sq  0.8151
Coeff Var         0.30583

Parameter Estimates:
Variable     DF    Parameter Est.    Stan. Err.    t value   Pr>|t|
Intercept     1         10.49048       0.02343     447.82     <.0001
T             1         0.03714        0.00774     4.80       0.0086   <---Problem?
If all the mass data points are ±0.2 is this really significant? or is it more likely H0 (slope of 0) is true. Currently its reject H0. How to change/fix. I'm also curious for running future analysis on my own data in SAS.
Thanks for the help. 68.2.223.135 (talk) 01:42, 25 February 2013 (UTC)
- Sorry, I'm having a hard time seeing what goes with what in your SAS output. What is the regression coefficient? What is the t-statistic? What is the p-value for the t-statistic? In any event, I don't think the amount of measurement error in the dependent variable (mass) is relevant to the question of significance -- the measurement error in the dependent variable will affect the R2 and nothing else. Duoduoduo (talk) 02:25, 25 February 2013 (UTC)
- I strongly recommend that you talk this over with the professor who runs the course. I think you have a serious misunderstanding of the nature of an experimental control, which is unlikely to get cleared up by an answer here on Wikipedia. It wouldn't be good for you to inflict your misunderstanding on your students. Looie496 (talk) 02:53, 25 February 2013 (UTC)
- @ Duoduoduo and Looie496 Since this is a question regarding SAS and it appears neither of you have used SAS, your responses haven't been very helpful; however, I will attempt to clarify some of the above post to help out.
@ Duoduoduo The t-statistic is under t-value and the p-value for said t-stastistic is under pr>|t|. The parameter estimates are (parameter est.) are the coefficients in the Y=a+bX equation (or M=a+bT in this case). I agree that the measurement error in the dependent variable will decrease the R2 value; however, this value is also related to the p-value. Think multivariate modeling (I know this is a simple linear regression, but perhaps my mistake is attempting to apply a complex subject tot a simple matter) when using a stepwise or backward regression, the p-value is used to determine which variables to include or exclude (lower p-value higher relevance). In this case, the variable T seems to be relevant to a change in mass; however, with the high known error it is unlikely that these data points are actually different. If included in the model the R2 value would decrease as the correlation of the model decreased and the p-value would increase suggesting the variable T is less significant (to the point of exclusion). Thus, since this is a single variable model, the lack of this variable provides an equation with just an intercept (which is significant since this is the weight of the bag). In the SAS output, the intercept is relevant (p-value <.0001); however, so too is the value of b (parameter estimate of T). This suggests that the data does not have a slope of 0 as the variable T is relevant.
@ Looie496 First, I thought this was supposed to be a friendly discussion forum. Attacking the integrity of someone you don't know without proving any credentials yourself seems rather foolhardy/arrogant. Anyway, to your point - Negative controls are groups where no phenomenon is expected. They ensure that there is no effect when there should be no effect. Hence in an osmosis experiment using DT bags immersed in DI water, our negative control is a DT bag filled with DI water submersed in DI water. One would expect no net gain of weight in the DT bag as this solution should be isotonic (no concentration gradient). The data above suggest that water flows into the bag over time (ie something happened). However, the error on the scale being used is of such a great extent that one could simply rationalize "these data are most likely the same." I would like to know how to include the measurement error into the model in SAS to prove this to be true. The P-value of this variable within the model should be such (p>0.05) that we reject the significance of the variable (even if the R2 value shows a good fit).
Hope that clears some of the confusion up. I would appreciate a response from someone who has worked with SAS and can answer the question I posted. Thanks! 68.2.223.135 (talk) 21:25, 25 February 2013 (UTC)
- I don't know SAS, so I can't help you there, but this document discusses your use case (starting on page 8). Specifically, equation 13 tells us that if the y-errors are assumed to be +/- 0.2, then the slope uncertainty on your numbers evaluate as +/- 0.048. Given your parameter estimate of 0.037, such an error would indeed tell you that the slope is consistent with zero. Dragons flight (talk) 21:53, 25 February 2013 (UTC)
- I didn't attack your integrity, I questioned your understanding. It is worrisome that you don't recognize the difference. It is absolutely false that negative controls should show no effect. Their purpose is to show effects that are caused by the measurement process rather than by the thing that is being measured. I repeat that you should talk this over with the course director. Looie496 (talk) 02:13, 26 February 2013 (UTC)
- Honestly Looie, I read your prior comment as unhelpful criticism as well. The original poster correctly recognized that a canned statistical test wasn't considering measurement uncertainty, and he realized that failing to consider such uncertainties had the potential to lead to misleading conclusions. He asked for help in showing if/how that might be the case. That's the essence of the question. He also provided a bit of background that the data in question happened to come from a test run as a negative control. You somehow read that bit of background as indicating some profound ignorance on his behalf, and focused entirely on that secondary aspect in framing a response that didn't even touch on the main thrust of his question. Worse, your first response said essentially "you're wrong" and didn't even bother to explain why, which made it very unhelpful to the poster. Perhaps there are some things that this TA is confused about (and accounting for measurement uncertainty is certainly one of them), but when I read the question, I'm prepared to give him the benefit of the doubt that he isn't making profound errors in thinking about experiment design. Dragons flight (talk) 04:08, 26 February 2013 (UTC)
- The Wikipedia Ref desks really aren't suited to this sort of issue -- I'll just say that if I was running that course, I would very much like this TA to come talk to me about this problem. Looie496 (talk) 06:04, 26 February 2013 (UTC)
@ 68.2.223.135: You presented your SAS output in unreadable form, not lined up conveniently. I said it's hard to read. Then CiaPan changed it to readable form, and then you condescended to explain the readable form to me. Did you even read it when you typed it and notice that for example t-statistic was not under "t-value"?
As for your response to my not very helpful comments, may I point out that you are a TA in an intro course, whereas I taught doctoral students for 25 years, including supervising numerous empirical dissertations. I hope you'll show more respect to your professor that you're TAing for, and to whoever you write a thesis or dissertation under. Take my word for it or look it up in a stat book: noise in the dependent variable does not bias the t-statistic. If your errors in dependent variable measurement are correlated with the independent variable "time", then there would be bias. Now of course your constant term is extremely significant; that's usually the case in regression, and it doesn't have any particular meaning. As for your slope coefficient (coefficient of time), if it's significant then it's significant. Just looking at your data makes it not surprising that the slope is significant: as time goes up, your mass never goes down and sometimes goes up. Maybe there's some systematic mistake in conducting the experiment that leads to data errors that are correlated with time. Or (and this can happen) maybe you've entered the data in reverse order (maybe by conflating "time passed" with "time remaining"). I would also note that the document linked to above by Dragons Flight, on p. 8 that he cites, talks about what happens if absolute measurement error varies by data point, perhaps because relative error is constant. But from what you say the absolute error seems to be constant. If that's the case, then there's nothing you can do about it. The slope estimate and its p-value are as statistically good as you're going to get. Finally, I hope your actual regressions have a lot more data points than what you showed in your example -- even though the significance formula takes into account how few data points you have, I would never trust something with less than, say, 20 or 30 degrees of freedom. Duoduoduo (talk) 15:38, 26 February 2013 (UTC)
@All:
My intention was not to have this post become a "bull session". That said, my academic pursuits are not in statistics. For clarification on my background and why attempting to explain misunderstanding to students in concrete terms is important to me, I am pursuing a doctorate in education with an emphasis on science education and policy. My degree is not in statistics (though I find it to be highly relevant to my field, hence my attempts to learn). I am certain my minimal understanding of statistics is of such a limited extent that others who would post on here can destroy anything I would attempt to say or do. However, the point was to determine if it was possible, in SAS, to incorporate absolute measurement error into the model to show the original conclusion drawn from the data was invalid. My desire to use SAS for this function is that SAS is a program I am attempting to learn. The data referenced in this post is an example of student work whereby the student concluded (from a linear regression in MS Excel) that the data proved flow of water into a DT bag under the condition of zero concentration gradient (ie the negative control for the experiment). Using this, the student also concluded the negative control was a failure and then went on to analyze the rest of their results without discussing the possibility that their data for the negative control didn't support their conclusion when absolute uncertainty was considered (or the fact they have very limited data to begin with, but this is a FRESHMAN level undergraduate bio class). The reason I use the negative control data from one student is because I thought everyone who read the post would be able to get on board with what I presented, that the slope of that line should be zero and given the data (with known absolute error) one could draw that conclusion (ideally with concrete stats analysis).
@Doudoudou: As for the un-helpfulness of your post, your comment on your credentials versus mine also seems irrelevant to the topic. If your comment wasn't helpful, then it wasn't helpful. Citing your authority as having taught doctoral students doesn't change that. With that in mind I do respect that you are attempting to be helpful and appreciate your expertise. In that light, my apologies for my post whereby I misinterpreted your source of misunderstanding. I concede it is likely the output was unreadable in the format I provided and thank CiaPan for correcting it. My comment to you was not intended to be condescending (though your above comment to me appears to be of that nature) I was attempting to explain the output to you (per my understanding of your post) and to anyone else that may come along with an attempt to answer. I agree, 4 degrees of freedom (n-2) for this experiment is suspect, so too is the fact that it is run by undergraduate freshmen who likely have never used a non-digital scale. Another consideration is that the test run is constrained by lab time (they get 2.5 hrs to do a quiz, listen to my lecture, perform the pre-lab from their lab books, design the experiment and run it) I'm absolutely certain there are plenty of non-quantifiable errors I could cite as the source of their data/conclusions being suspect. The goal is to try to demonstrate that even if their data is correct, the conclusion from this data is not. Also, while doing this I want to provide more concrete reasons for their conclusion being incorrect than "just so" stories. Perhaps the way I'm thinking about attempting to explain the problem is the reason for the confusion (and perhaps my general weakness in statistics). So if you'll indulge me this analogy: Say one were measuring a response (y-variable) over several groups who received a treatment measured over time (x-variable). Say too the averages of these responses were consistent with the student data I provided above. And that the analysis of variance showed that the 95% confidence interval for each mean just happened to be equivalent to the measurement error in the above experiment. Would you not conclude looking at that data set that even though there is a slight trend, that perhaps those averages really aren't different and no real conclusion could be made from this experiment? That's kinda how I thought of the problem. Does that help? Again, I'm not trying to be condescending in this post only trying to clarify. Hopefully, further conversation in this post can be more productive than previous attempts. Again, I apologize for any sense of condescending within my post toward you.
- My credentials are irrelevant? Then why did you criticize someone else (Looie496) for not providing his credentials? As for "If your comment wasn't helpful, then it wasn't helpful", my comment was helpful, if you bothered to take it seriously, because it was the correct answer to your question. I'll say it once more (third time), even though it's not the answer you were hoping for. Your question is the analysis of variance showed that the 95% confidence interval for each mean just happened to be equivalent to the measurement error in the above experiment. Would you not conclude looking at that data set that even though there is a slight trend, that perhaps those averages really aren't different and no real conclusion could be made from this experiment? The answer is that there's no basis for that conclusion. Regardless of whether the error variance is tiny or huge, if the p-value for the slope is, say, .0086, then if you ran such regressions from the same data generating process numerous times and if the null of no effect were true, then you would only get a result for the estimated slope so far away from zero 0.86% of the time. Duoduoduo (talk) 20:46, 26 February 2013 (UTC)
- In that you you cite them for the purpose of belittling me, Yes! They Are. Think about when and how you use them. You cite your credentials as an source of absolute authority (against my being only a TA). Do you not remember this is Wikipedia!? You could be anyone, you choose to remain anonymous; therefore, stating you have credentials is irrelevant to your argument. Justification by appeal to authority (especially when the authority cannot be verified) is an incredibly weak argument. On you wikipedia users page, you state Always ask “How do we know that?” ; demand rigorous evidence would you end your argument when someone else's argument is simply an appeal to an unseen authority? I don't think you would.
Also, considering the question I posed in my hypothetical - if 95% CI overlap, one cannot conclude with certainty that the values are themselves different. I'm referencing Tukey's Studentized Range (HSD) here. As such if the hypothetical I provided were correct, I would conclude from an HSD analysis that the measurements were not significantly different. You are correct above to point out that the p-value for the slope would not change. Utilizing an imaginary data set for the hypothetical I provided, the p-value still showed significance (though it changed slightly upward, probably a mis-entry somewhere on my part); however, the R2 value was reduced to 0.013. I would say between an HSD test showing no significant difference between measurements and an incredibly small R2 value that the data is at worst not linear and at best not different. I do concede to your points from before that the p-value wouldn't change if error in the dependent variable were included in the model; however, your answers have been unhelpful in that they haven't provided explanations. Similar to Looie496, you begin by taking an accusatory stance and end with an air arrogant condescending. I have learned something (about statistics none the less) from attempting to deal with this attitude of yours; however it has been incredibly difficult. If I could, may I make a request of you (and Looie496, should he/she wish to participate)? Riddle me this, what was the purpose of your posts other than to boast about your "status" and condescend toward another human being? 68.2.223.135 (talk) 03:27, 27 February 2013 (UTC)
- What was the purpose of my posts? I'm an unpaid volunteer here, trying to help people who want help. You claimed that I have no SAS experience, and I pointed out otherwise. You wrote condescendingly to me, and I responded by pointing out that your condescension was unwarranted. I offered my credentials, not because they prove absolute authority, but because you criticized someone for disagreeing with you without offering their credentials. I offered help, and you responded by calling my efforts not very helpful. If you want help, stick to asking for help rather than going on the attack. Other questioners on this reference desk seem to have no problem with doing it that way. Duoduoduo (talk) 15:31, 27 February 2013 (UTC)
Duoduoduo: from "How do I Answer a Question?" at the top of this page... "The best answers directly address what the questioner asked (without tangents), are thorough, are easy to read, and back up facts with wikilinks and links to sources. Please assume good faith, especially with users new to Wikipedia. Don't edit others' comments and do not give any medical or legal advice." [emphasis added] As I have mentioned several times my original intent in my first response to your response was not intended as condescending. I have also accepted and apologized for my part in that misunderstanding. All I have received in return from you is contrary to what ideally should be a response, per Wikipedia. I can tell these past posts for some reason elicit both anger and a need in you to prove your "superiority" over me. OK, fine. You claim to be a professor emeritus of economics who is highly published and believes "the meaning of life is to live a happy life." (from your wiki user page). So here, go be happy! You're smarter than me (in your field), you've published more than me! You're obviously a superior being. But you obviously have a lot to learn about happiness and letting things go. Perhaps a counselor, or a psychiatrist could help you. I doubt you'll find resolution to these problems in Wikipedia. 149.169.201.148 (talk) 19:07, 27 February 2013 (UTC)
@Louie496: If you were running this course (specifically this experiment), and given all the information you now have about the course (from all previous posts) what would you tell the student in question? I'm curious to know if it would be more than "well you can't make those conclusion because [insert non-quantifiable error]." If that's the case you're simply providing "just-so" stories to the students as to why such and such is/is not the case. What would your response be to a student then asking if one was to remove those error variables through a repeated experiment (under much greater control of course) and they got the same data? My problem for the students perspective isn't to rain down on them (as yours is on me) and show that they are just wrong, it is to provide concrete examples of how to deal with errors and what they mean. Students aren't going to be tested on the stat's ideas that I would present nor am I going to drastically dock them points for their naivete - such is the nature of those seeking knowledge. Likewise, I too am naive in the area of statistical analysis and would attempt to learn. Looking at the comments received thus far you are correct, perhaps the Wikipedia:Reference desk/Mathematics was not the best place to go for this question. However, I thought the point of the ref desks were to help those like myself to find answers to questions in the field they have questions in (I'm pretty sure mine being a stats question falls under mathematics?? maybe I'm too naive here as well). Also, I have discussed with both the professor and lab coordinator every problem I have ever come across. I was told to attempt to figure out how to provide such a concrete example on my own since both the lab coordinator and professor would simply look at the data and conclude that considering all the likely chances for error the data is probably not actually showing a trend. To the point about experimental controls. If the measurement variable changes under the negative control when the expected response is zero, this shows that the test will likely produce false positives (at least there is uncertainty in all positives for the test). Let us assume (taking an example from my prior experience) that I were running flow cytometry to determine leukoreduction on blood samples. Can you guess what our negative control was (we're counting leukocytes)? A sample with 0 leukocytes (known). If the flow cytometer happened to pick up several leukocytes (beyond the acceptable error, it occasionally came up with a number in the <100,00/mL range - below error and below clinical significance)then the control failed and we wouldn't use that machine for testing. In the case of drug trials a negative control (placebo) of course doesn't show absolutely no measurable outcomes; however, it establishes a baseline by which to compare the results of the treatment group. Also, placebo groups can be compared across several studies, if say one's placebo group responded drastically different to other placebo groups this is analogous to a failed control.
- Here is what I would tell them, as far as I can say, not knowing how the measurements were made: (1) There is a slope that is significant with p < 0.01, so it needs to be treated as real. (2) The range of values over time for the negative control is no larger than the measurement error, so unless the measurements are digital, there is a good chance that the effect is due to human error, i.e., biases in reading the instruments that change over time. However, there is no way to know that for sure. There are many other possibilities, and without a specific test, there is no way to know what explanation is correct. (3) Presumably the range of variation for the positive manipulation is much greater, and the difference between manipulation and control is significant -- that's the important thing. Looie496 (talk) 03:53, 27 February 2013 (UTC)
Looie496: I want to thank you for this response. In my previous posts I very much attacked you and your responses - though to a certain extent they may have deserved it, but definitely not from my level of disrespect. For this I apologize. We appear to be on the same page for explaining concepts to a student body. To be honest my concern was not using this to explain to everyone in the class, rather to a single student who himself is incredibly arrogant (and probably smarter than he shows). The goal was to be able to reach him on a level that was not biology since he regularly tries to demonstrate his intellect using mathematics. After some time I did find a response to the original problem posted and it essentially boiled down to "You can do this with SAS, but it is exceptionally difficult and probably not worth the effort for such a data set. Regardless, the p-value may change but it will still likely be <0.05. However, the R2 value would decrease drastically demonstrating that while the variable is relevant, it is not linearly correlated." So, that appears to be the answer, which is a combination of the understanding I drew from Duoduoduo and Dragonsflight, less the actual method in SAS. I wish you well with your work in Neurology and hope that your attempt to encourage greater participation of scientists on Wikipedia is more successful than our conversation has been (No assignment of absolute blame, I am plenty to blame). 149.169.201.148 (talk) 19:07, 27 February 2013 (UTC)
@Dragonsflight: Thanks for your help, support, and benefit of the doubt. I didn't realize that when providing background for a question (that is obviously incomplete and used to provide just that...background) I would be highly scrutinized for the incompleteness of the background. All that aside, I don't know how to incorporate what you cited into SAS, but as you mentioned you too are not familiar with this program. Anyway, if you have any other insights it's greatly appreciated.
Standard deviation is related to probability, just as expectation is related to...?
The answer I'm looking for, is supposed to answer a question from the opposite direction: Expectation is related to probability, just as standard deviation is related to...? Here is a third alternative: Standard deviation is related to expectation, just as probability is related to...? 77.125.99.245 (talk) 08:54, 25 February 2013 (UTC)
- I don't think "crossover" relations (such as "Apple is related to vegetable as cabbage is related to fruit") make much sense. I assume that you gave "variance" as the answer to the original question with the relation "is a measure of". Dbfirs 11:05, 25 February 2013 (UTC)
- I agree that the "third alternative" does not make sense, but the answer to the original question would more precisely be "the magnitude of deviation from the mean". I hope I'm not giving the answer to a homework question here (but I fear that I am). Looie496 (talk) 16:59, 25 February 2013 (UTC)
- To me, those questions are very poorly worded for homework, though Looie's interpretation and answer are good. Here's an analogy that does hold up, in case you are interested: the expectation of a random variable following a probability density function is the same as the center of mass of a physical object that has that mass density distribution. In this case, the standard deviation gives the radius of gyration of the object, which is a nice way of giving a physical interpretation of the probability concept. You can do a nice illustration of the radius of gyration using a standard chalk board eraser: you can easily toss it into the air and watch it smoothly rotate around either of two axes. When you attempt the third axis, all you will get is wobbles, because...(left as an exercise for the reader ;) SemanticMantis (talk) 20:14, 25 February 2013 (UTC)
February 27
The Gamma function and Euler's constant (e)
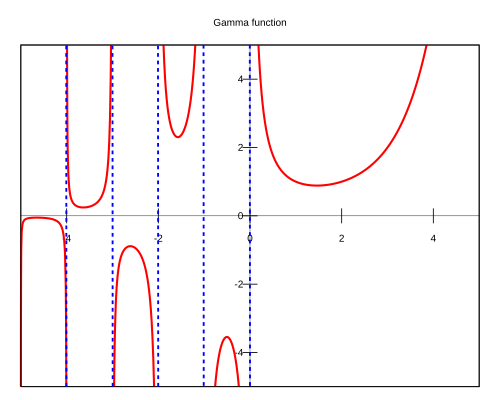
We know that e is defined as the (discrete) sum of the multiplicative inverses of the factorials (of natural numbers): . Now, since the integral is the continuous equivalent of a discrete sum, and the gamma function the generalization of the factorial function, it would follow that would be the continuous equivalent of the mathematical definition of the number e. When I tried to compute this value with Mathematica, it yielded a value close, though not identical, to that of the number e: 2.807770... instead of 2.71828..., the error being about 0.089... I guess my question would be two-fold: (1) is this correct ?, and (2) does it have any meaning ? (Like, for instance, the constant , which is defined as the difference between the [discrete] sum of the inverses of natural numbers, a.k.a the harmonic series, and the [continuous] integral of the same: ). — 79.113.224.159 (talk) 15:56, 27 February 2013 (UTC)


- Shouldn't the analogous integration run from 1 to infinity? Because . Icek (talk) 23:27, 27 February 2013 (UTC)
- No. That yields 2.2665..., which lies even further away from e. (Basically, starting off at 1, or any point other than 0, would be a random choice, and a simple look at the function's graph suffices to understand why). — 79.113.224.159 (talk) 05:57, 28 February 2013 (UTC)
- 0 is just as an arbitrary choice as any other number. Besides the point was that 0! = Γ(1), which is in fact corroborated and not refuted by your link. Lastly there is no reason why taking the continuous limit of an summation must yield the integral which is the closest approximation to the sum. — Preceding unsigned comment added by 202.65.245.7 (talk) 13:56, 28 February 2013 (UTC)
- ...and Gamma(1) is basically a vertical segment, whose surface (which is what the integral function ultimately calculates) is 0. In order for us to have a surface, we must also have a width, not just a height (which is the geometrical reflection of the function's value). We gain that width by starting a step before, at 0, instead of 1. Obviously, a discrete sum is the sum of segment-lengths, so we don't need to create any surfaces there. — 79.113.197.109 (talk) 17:37, 28 February 2013 (UTC)
- Arguing this way you should start integrating at 0 for the harmonic series... which would make the Euler-Mascheroni constant infinite. Icek (talk) 20:51, 28 February 2013 (UTC)
- You're right, I even wrote the definition of wrong the first time (now it's corrected). I guess the explanation is that this is the domain on which the two functions are defined, or that they both have in common: 0 to . In the case of , if we'd extend the domain to include the interval [0, 1], we'd get:
- Arguing this way you should start integrating at 0 for the harmonic series... which would make the Euler-Mascheroni constant infinite. Icek (talk) 20:51, 28 February 2013 (UTC)
- ...and Gamma(1) is basically a vertical segment, whose surface (which is what the integral function ultimately calculates) is 0. In order for us to have a surface, we must also have a width, not just a height (which is the geometrical reflection of the function's value). We gain that width by starting a step before, at 0, instead of 1. Obviously, a discrete sum is the sum of segment-lengths, so we don't need to create any surfaces there. — 79.113.197.109 (talk) 17:37, 28 February 2013 (UTC)
- 0 is just as an arbitrary choice as any other number. Besides the point was that 0! = Γ(1), which is in fact corroborated and not refuted by your link. Lastly there is no reason why taking the continuous limit of an summation must yield the integral which is the closest approximation to the sum. — Preceding unsigned comment added by 202.65.245.7 (talk) 13:56, 28 February 2013 (UTC)
- No. That yields 2.2665..., which lies even further away from e. (Basically, starting off at 1, or any point other than 0, would be a random choice, and a simple look at the function's graph suffices to understand why). — 79.113.224.159 (talk) 05:57, 28 February 2013 (UTC)


- .
- This is known as the Fransén–Robinson constant. DTLHS (talk) 05:59, 28 February 2013 (UTC)
- Thanks ! :-) — 79.113.224.159 (talk) 06:08, 28 February 2013 (UTC)

February 28
4 dimensional equivalents of the Johnson solids?
Is there a standard definition as to what would be the equivalent polychora to the Johnson solids? Would it be
1. Each of the polyhedra that make up the polychoron have to be regular such as a "hyper pyramid with a base of the octahedra" and a "hyper bi-pyramid with a base of a icosahedron" and
2. Each of the polyhedra has to be uniform?
3. Each of the polyhedra has to be a Johnson solid. I believe this is equivalent to requiring that all 2 dimensional faces have to be regular.Naraht (talk) 19:01, 28 February 2013 (UTC)
Percent chance for each individual
It seems to me the answer to the question is yes, but I've found that reality sometimes doesn't correspond to my intuition. If there are ten people in a group and six are going to be chosen at random all at the same moment, doesn't each individual have a 60% chance of being chosen? 67.163.109.173 (talk) 23:06, 28 February 2013 (UTC)
- Should the six out of ten be chosen sequentially, initially all ten have a 60% chance of being chosen, then after the first choice the remaining nine each have a 5/9 chance of being chosen, and so on until finally the remaining four have zero chance of being chosen. But if all six are chosen at the same time, then obvious symmetry gives each the same chance of 60%.←86.186.142.172 (talk) 10:45, 1 March 2013 (UTC)
- You might think the chance of being chosen first = 1/10, 2nd = 1/9, 3rd = 1/8, 4th = 1/7, 5th = 1/6, 6th = 1/5. However, for a given person, you only do the second draw if they weren't chosen the first time, so you multiply that 1/9 by 9/10 to get a 9/90, or 1/10th chance they will be chosen on the second draw, just like the first. This applies to all the draws, so we get 6×(1/10), or 6/10 chance they will be picked, in total, regardless of whether they are drawn at once or not. (If you don't make the adjustment I describe, then a person can be chosen twice or more, and the "chance of being chosen" reflects this, coming out around 0.845635. This is the chance of being chosen once, plus 2 times the chance of being chosen twice, plus three times the chance of being chosen thrice, etc. In fact, if you were to do one additional draw, this number comes out greater than 1.) StuRat (talk) 16:05, 1 March 2013 (UTC)
- To clarify my post, I meant that "after the first choice the remaining nine each have a 5/9 chance of being chosen sometime in the subsequent process", and so on. ←86.186.142.172 (talk) 16:41, 1 March 2013 (UTC)
- OK, have we answered this Q to your satisfaction ? StuRat (talk) 04:14, 2 March 2013 (UTC)
March 1
Am I smarter than a 5th grade math textbook?
I am perfectly mortified to have to be asking this at all, but I'm really confused and have no one else to consult. My husband teaches 5th grade math, and I'm helping him out by grading some papers. One of them has the following question: "Yolanda ate 2/5 of the carrots on the plate, then her brother ate 9 of the remaining carrots. Which expression shows how to find how many total carrots there were?" It's a multiple-choice question, but none of the provided answers makes any sense. The teacher's edition gives the answer as "(2/5)c - 9," but this doesn't make sense to me. Is this answer actually correct? If so, why? If not, what IS the correct answer? — Preceding unsigned comment added by 172.3.129.135 (talk) 19:46, 1 March 2013 (UTC)
- Should be (2/5)c-9 = 0 , then c can be worked out by rearranging the formula to be 22.5 carrots.....
- Yolanda eats (2/5) x 22.5 carrots which leaves 9 carrots for her brother to eat.
- I agree with you its a badly written question and answer.
- The problem does not state that no carrots were left at the end. If you want an expression for the number of carrots that remain, it would be (3/5)c - 9, assuming c is the number at the beginning. So either you copied something down incorrectly, or the textbook contains a typo. Looie496 (talk) 22:49, 1 March 2013 (UTC)
- Yes assuming no carrots left at the end this gives 15 carrots to start but the wording implies there are several remaining.--Gilderien Chat|List of good deeds 23:22, 1 March 2013 (UTC)
- The problem does not state that no carrots were left at the end. If you want an expression for the number of carrots that remain, it would be (3/5)c - 9, assuming c is the number at the beginning. So either you copied something down incorrectly, or the textbook contains a typo. Looie496 (talk) 22:49, 1 March 2013 (UTC)
- Indeed. There's not enough information to work out the number of carrots we began with, because "9 of the remaining carrots" means there were still some left over, and we're not told how many. If c is the starting number, then the simplest expression for the starting number is, surprise, surprise, c; and the other data is just herrings in various shades of red. Unless we assign a value, d, to the number left over at the end. Then d = (3c-45)/5, and c = (5d+45)/3. But if none of these are acceptable answers, then the paper contains a typo and students should not be burdened with the responsibility for that. -- Jack of Oz [Talk] 01:06, 2 March 2013 (UTC)
Thanks all. Actually I came to many of the same conclusions JackofOz did, but "c" wasn't a possible answer, nor was any equation or any expression with multiple variables. (And the problem was definitely asking the students to create an expression of the state of things using numbers and mathematical symbols rather than solving for an unknown value.) After posting this I was able to get in touch with my father, who went farther in math than I did (not that it should matter for a fifth-grade problem; he's just my go-to math expert) and actually enjoys this type of problem, and he didn't know what to make of it either. I know I copied it down correctly, so the problem was with the materials - and not for the first time, either. I just threw the question out altogether and gave them a score based on eleven problems instead of twelve. And now my husband's on his way home from work and we can spend the evening griping about the wretchedness of teaching materials in the state of California. — Preceding unsigned comment added by 172.3.129.135 (talk) 01:18, 2 March 2013 (UTC)
- They just needed to write the last sentence differently. Instead of "Which expression shows how to find how many total carrots there were ?" they should have asked "Which expression shows how many carrots remain, as a function of the original number of carrots, c ?". Your husband can have the students correct the books, either in this class or the next, to make it a reasonable practice question. StuRat (talk) 04:10, 2 March 2013 (UTC)
- Apart from mathematical infelicities, the language of the original question also leaves a lot to be desired. "How many total carrots" - are we to assume that some of these objects are total carrots but some are only partially carrots (crosses between carrots and hedgehogs, perhaps)? Reminds me of Eric the Half Bee. -- Jack of Oz [Talk] 08:21, 2 March 2013 (UTC)
March 2
Correlation =//= Causation... Ever?
If there is a strong positive correlation, then that is still a correlation, right? That can't be considered a causation, because it is still a correlation. My reasoning is that any correlation, no matter how high or low, can be tampered with by selecting a critical r value and comparing the critical r value to the obtained r value (Pearson product-moment correlation coefficient) in order to achieve a desirable result? For example, there may be a lot of evidence (very strong correlation) to suggest a statistically significant change, but because the statistician chooses a ridiculously high critical value, the statistician fails to reject the null hypothesis and maintains that there is no change, because there is a conflict of interest in the experiment that may influence the statistician's own life in some bad way, which the statistician obviously denies in order to preserve his academic credentials even though lying is liable to being accused of academic dishonesty and thus can greatly ruin his career. Are there real examples of such things happening where statisticians intentionally manipulate the data in order to achieve a desirable result and report the result to a scientifically and mathematically illiterate general public? Sneazy (talk) 06:39, 2 March 2013 (UTC)
- I can't make sense of all that, but there is a famous book called How to Lie with Statistics that is probably the sort of thing you are looking for. Looie496 (talk) 06:47, 2 March 2013 (UTC)
- Actually, the first sentence is the question. Sneazy (talk) 06:55, 2 March 2013 (UTC)
- Actually there are two questions and one statement with an appending question mark. Looie answered your second question. As for the first, indeed correlation is correlation and not causation. Your reasoning is somewhat convoluted and the agency of a statistician need not be invoked to show that they are fundamentally and conceptually different.
- Actually, the first sentence is the question. Sneazy (talk) 06:55, 2 March 2013 (UTC)