From Wikipedia, the free encyclopedia
Image shows the 50 states by area. Check the legend for more details. This is a complete list of the states of the United States and its major territories ordered by total area , land area , and water area . The water area numbers include inland waters , coastal waters , the Great Lakes , and territorial waters . Glaciers and intermittent bodies of water are counted as land area.[ 1]
Total area[ 2]
Land area[ 2]
Water[ 2]
State/territory
Rank
sq mi
km²
Rank
sq mi
km²
% land
Rank
sq mi
km²
% water
Alaska 1 665,384.04
1,723,337
1 570,640.95
1,477,953
1 94,743.10
245,384
Texas 2 268,596.46
695,662
2 261,231.71
676,587
8 7,364.75
19,075
California 3 163,694.74
423,967
3 155,779.22
403,466
6 7,915.52
20,501
Montana 4 147,039.71
380,831
4 145,545.80
376,962
26 1,493.91
3,869
New Mexico 5 121,590.30
314,917
5 121,298.15
314,161
49 292.15
757
Arizona 6 113,990.30
295,234
6 113,594.08
294,207
48 396.22
1,026
Nevada 7 110,571.82
286,380
7 109,781.18
284,332
36 790.65
2,048
Colorado 8 104,093.67
269,601
8 103,641.89
268,431
44 451.78
1,170
Oregon 9 98,378.54
254,799
10 95,988.01
248,608
20 2,390.53
6,191
Wyoming 10 97,813.01
253,335
9 97,093.14
251,470
37 719.87
1,864
Michigan 11 96,713.51
250,487
22 56,538.90
146,435
2 40,174.61
104,052
Minnesota 12 86,935.83
225,163
14 79,626.74
206,232
9 7,309.09
18,930
Utah 13 84,896.88
219,882
12 82,169.62
212,818
17 2,727.26
7,064
Idaho 14 83,568.95
216,443
11 82,643.12
214,045
33 925.83
2,398
Kansas 15 82,278.36
213,100
13 81,758.72
211,754
42 519.64
1,346
Nebraska 16 77,347.81
200,330
15 76,824.17
198,974
41 523.64
1,356
South Dakota 17 77,115.68
199,729
16 75,811.00
196,350
29 1,304.68
3,379
Washington 18 71,297.95
184,661
20 66,455.52
172,119
11 4,842.43
12,542
North Dakota 19 70,698.32
183,108
17 69,000.80
178,711
24 1,697.52
4,397
Oklahoma 20 69,898.87
181,037
19 68,594.92
177,660
30 1,303.95
3,377
Missouri 21 69,706.99
180,540
18 68,741.52
178,040
32 965.47
2,501
Florida 22 65,757.70
170,312
26 53,624.76
138,887
3 12,132.94
31,424
Wisconsin 23 65,496.38
169,635
25 54,157.80
140,268
4 11,338.57
29,367
Georgia 24 59,425.15
153,910
21 57,513.49
148,959
22 1,911.66
4,951
Illinois 25 57,913.55
149,995
24 55,518.93
143,793
19 2,394.62
6,202
Iowa 26 56,272.81
145,746
23 55,857.13
144,669
45 415.68
1,077
New York 27 54,554.98
141,297
30 47,126.40
122,057
7 7,428.58
19,240
North Carolina 28 53,819.16
139,391
29 48,617.91
125,920
10 5,201.25
13,471
Arkansas 29 53,178.55
137,732
27 52,035.48
134,771
31 1,143.07
2,961
Alabama 30 52,420.07
135,767
28 50,645.33
131,171
23 1,774.74
4,597
Louisiana 31 52,378.13
135,659
33 43,203.90
111,898
5 9,174.23
23,761
Mississippi 32 48,431.78
125,438
31 46,923.27
121,531
25 1,508.51
3,907
Pennsylvania 33 46,054.35
119,280
32 44,742.70
115,883
28 1,311.64
3,397
Ohio 34 44,825.58
116,098
35 40,860.69
105,829
14 3,964.89
10,269
Virginia 35 42,774.93
110,787
36 39,490.09
102,279
15 3,284.84
8,508
Tennessee 36 42,144.25
109,153
34 41,234.90
106,798
35 909.36
2,355
Kentucky 37 40,407.80
104,656
37 39,486.34
102,269
34 921.46
2,387
Indiana 38 36,419.55
94,326
38 35,826.11
92,789
39 593.44
1,537
Maine 39 35,379.74
91,633
39 30,842.92
79,883
12 4,536.82
11,750
South Carolina 40 32,020.49
82,933
40 30,060.70
77,857
21 1,959.79
5,076
West Virginia 41 24,230.04
62,756
41 24,038.21
62,259
50 191.83
497
Maryland 42 12,405.93
32,131
42 9,707.24
25,142
18 2,698.69
6,990
Hawaii 43 10,931.72
28,313
47 6,422.63
16,635
13 4,509.09
11,678
Massachusetts 44 10,554.39
27,336
45 7,800.06
20,202
16 2,754.33
7,134
Vermont 45 9,616.36
24,906
43 9,216.66
23,871
46 399.71
1,035
New Hampshire 46 9,349.16
24,214
44 8,952.65
23,187
47 396.51
1,027
New Jersey 47 8,722.58
22,591
46 7,354.22
19,047
27 1,368.36
3,544
Connecticut 48 5,543.41
14,357
48 4,842.36
12,542
38 701.06
1,816
Delaware 49 2,488.72
6,446
49 1,948.54
5,047
40 540.18
1,399
Rhode Island 50 1,544.89
4,001
50 1,033.81
2,678
43 511.07
1,324
District of Columbia 68.34
177
61.05
158
7.29
19
Puerto Rico 5,324.84
13,791
3,423.78
8,868
1,901.07
4,924
Northern Mariana Islands 1,975.57
5,117
182.33
472
1,793.24
4,644
United States Virgin Islands 732.93
1,898
134.32
348
598.61
1,550
American Samoa 581.05
1,505
76.46
198
504.60
1,307
Guam 570.62
1,478
209.80
543
360.82
935
Minor Outlying Islands [ 3] [ a] 16.00
41
16.00
41
—
—
—
—
Contiguous United States Total 3,120,426.47
8,081,867
2,954,841.42
7,653,004
165,584.6
428,862
50 states and D.C. Total 3,796,742.23
9,833,517
3,531,905.43
9,147,593
264,836.79
685,924
All U.S. territory Total 3,805,943.26
9,857,348
3,535,948.12
9,158,064
269,995.13
699,284
Area by division
Total area[ 2]
Land area[ 2]
Water[ 2]
Division
Rank
sq mi
km²
Rank
sq mi
km²
% land
Rank
sq mi
km²
% water
East North Central 5 301,368.57
780,541
6 242,902.44
629,114
2 58,466.13
151,427
East South Central 7 183,403.89
475,014
7 178,289.83
461,769
9 5,114.60
13,247
Middle Atlantic 8 109,331.89
283,168
8 99,223.32
256,987
6 10,108.57
26,181
Mountain 2 863,564.63
2,236,622
2 855,766.98
2,216,426
8 7,797.65
20,196
New England 9 71,987.96
186,448
9 62,668.46
162,311
7 9,299.50
24,086
Pacific 1 1,009,687.00
2,615,077
1 895,286.33
2,318,781
1 114,400.67
296,296
South Atlantic 6 292,990.46
758,842
5 265,061.97
686,507
3 27,928.49
72,334
West North Central 3 520,355.80
1,347,715
3 507,620.08
1,314,730
5 12,735.72
32,985
West South Central 4 444,052.01
1,150,089
4 425,066.01
1,100,916
4 18,986.00
49,174
Area by region
Total area[ 2]
Land area[ 2]
Water[ 2]
Region
Rank
sq mi
km²
Rank
sq mi
km²
% land
Rank
sq mi
km²
% water
Midwest 3 821,724.38
2,128,256
3 750,522.52
1,943,844
2 71,201.86
184,412
Northeast 4 181,319.85
469,616
4 161,911.78
419,350
4 19,408.07
50,267
South 2 920,446.37
2,383,945
2 868,417.82
2,249,192
3 52,028.55
134,753
West 1 1,873,251.63
4,851,699
1 1,751,053.31
4,535,207
1 122,198.32
316,492
U.S. states by total area
U.S. states by land area
U.S. states by water area
U.S. states by water percentage
Alaska is the largest state by total area, land area, and water area
The area of Alaska is
18% of the area of the
United States and
21% of the area of the
contiguous United States
The second largest state,
Texas , is only
40% of the total area of the largest state, Alaska
Rhode Island is the smallest state by total area and land area
San Bernardino County is the largest
county in the
contiguous U.S. and is larger than each of the nine smallest states; it is larger than the four smallest states combined.
Michigan is second (after Alaska) in water area, and first in water percentage
Florida is mostly a peninsula, and has the third largest water area and seventh largest water area percentage
See also
Notes
^ Areas were not published in the 2010 census, unlike previous years, as the U.S. Census Bureau no longer collects data on the Minor Outlying Islands.[ 2]
References
External links
Demographics Economy Environment Geography Government Health History Law Miscellaneous


 U.S. states by total area
 U.S. states by land area
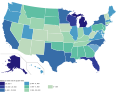 U.S. states by water area
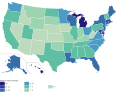 U.S. states by water percentage
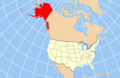 Alaska is the largest state by total area, land area, and water area
 The area of Alaska is 18% of the area of the United States and 21% of the area of the contiguous United States
 The second largest state, Texas, is only 40% of the total area of the largest state, Alaska
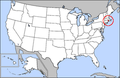 Rhode Island is the smallest state by total area and land area
 San Bernardino County is the largest county in the contiguous U.S. and is larger than each of the nine smallest states; it is larger than the four smallest states combined.
 Michigan is second (after Alaska) in water area, and first in water percentage
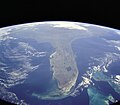 Florida is mostly a peninsula, and has the third largest water area and seventh largest water area percentage


 Definitions from Wiktionary
 Media from Commons
 News from Wikinews
 Quotations from Wikiquote
 Texts from Wikisource
 Textbooks from Wikibooks
 Resources from Wikiversity