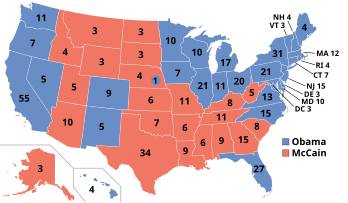
Presidential election results map. Blue denotes states/districts won by Obama/Biden, and Red denotes those won by McCain/Palin. Numbers indicate electoral votes allotted to the winner of each state. Obama won one electoral vote (from Nebraska's 2nd congressional district) of Nebraska's five.
Presidential election results map. Blue denotes states/districts won by Obama/Biden, and Red denotes those won by McCain/Palin. Numbers indicate electoral votes allotted to the winner of each state. Obama won one electoral vote (from Nebraska's 2nd congressional district) of Nebraska's five.
Presidential election results map. Blue denotes states/districts won by Obama/Biden, and Red denotes those won by McCain/Palin. Numbers indicate electoral votes allotted to the winner of each state. Obama won one electoral vote (from Nebraska's 2nd congressional district) of Nebraska's five.


_2006-2_cropped_and_flipped.jpg)


.jpg)


_(cropped).jpg)