
Carbon dioxide in Earth's atmosphere: Difference between revisions
m Bot: Migrating 1 langlinks, now provided by Wikidata on d:Q4468919 |
|||
| Line 23: | Line 23: | ||
Natural sources of atmospheric carbon dioxide include [[volcanic]] [[outgassing]], the [[combustion]] of [[organic compound|organic matter]], [[wildfires]] and the [[Respiration (physiology)|respiration]] processes of living [[aerobic organism]]s; man-made sources of carbon dioxide include the burning of [[fossil fuels]] for heating, [[electricity generation|power generation]] and [[transport]], as well as some industrial processes such as cement making. It is also produced by various [[microorganism]]s from [[fermentation (biochemistry)|fermentation]] and [[cellular respiration]]. [[Plant]]s convert carbon dioxide to [[carbohydrate]]s during a process called [[photosynthesis]]. They gain the energy needed for this reaction through the absorption of sunlight by pigments such as [[chlorophyll]]. The resulting gas, oxygen, is released into the atmosphere by plants, which is subsequently used for respiration by [[heterotrophic]] organisms and other plants, forming a [[carbon cycle|cycle]]. |
Natural sources of atmospheric carbon dioxide include [[volcanic]] [[outgassing]], the [[combustion]] of [[organic compound|organic matter]], [[wildfires]] and the [[Respiration (physiology)|respiration]] processes of living [[aerobic organism]]s; man-made sources of carbon dioxide include the burning of [[fossil fuels]] for heating, [[electricity generation|power generation]] and [[transport]], as well as some industrial processes such as cement making. It is also produced by various [[microorganism]]s from [[fermentation (biochemistry)|fermentation]] and [[cellular respiration]]. [[Plant]]s convert carbon dioxide to [[carbohydrate]]s during a process called [[photosynthesis]]. They gain the energy needed for this reaction through the absorption of sunlight by pigments such as [[chlorophyll]]. The resulting gas, oxygen, is released into the atmosphere by plants, which is subsequently used for respiration by [[heterotrophic]] organisms and other plants, forming a [[carbon cycle|cycle]]. |
||
Most sources of {{CO2}} emissions are natural, and are balanced to various degrees by natural {{CO2}} sinks. For example, the natural decay of organic material in forests and grasslands and the action of forest fires results in the release of about 439 gigatonnes of carbon dioxide every year, while new growth entirely counteracts this effect, absorbing 450 gigatonnes per year.<ref>IPCC Fourth Assessment Report: Climate Change 2007 (AR4) (available online at: http://www.ipcc.ch/publications_and_data/publications_and_data_reports.shtml#.T_EtQZFuqSo)</ref> Although the initial carbon dioxide in the atmosphere of the young Earth was produced by [[volcano|volcanic activity]], modern volcanic activity releases only 130 to 230 [[tonne|megatonnes]] of carbon dioxide each year,<ref>{{cite journal |author=Gerlach, T.M. |title=Present-day {{CO2}} emissions from volcanoes |journal=Eos, Transactions |volume=72 |issue=23 |pages=249, 254–5 |date=4 June 1991 |publisher=American Geophysical Union |doi=10.1029/90EO10192 |bibcode=1991EOSTr..72..249.}}</ref> which is less than 1% of the amount released by human activities (at approximately 29,000 megatonnes).<ref>U.S. Geological Survey, "[http://volcanoes.usgs.gov/Hazards/What/VolGas/volgas.html Volcanic Gases and Their Effects]", [http://volcanoes.usgs.gov volcanoes.usgs.gov]</ref> These natural sources are nearly balanced by natural sinks, physical and biological processes which remove carbon dioxide from the atmosphere. For example, some is directly removed from the atmosphere by land plants for [[photosynthesis]] and it is soluble in water forming [[carbonic acid]]. There is a large natural flux of {{CO2}} into and out of the biosphere and oceans.<ref>{{cite book |author=Cappelluti, G.; Bösch, H.; Monks, P.S. |title=Use of remote sensing techniques for the detection and monitoring of GHG emissions from the Scottish land use sector |publisher=Scottish Government |year=2009 |isbn=978-0-7559-7738-3 |url=http://www.scotland.gov.uk/Publications/2009/12/15084401/0}}</ref> In the pre-industrial era these fluxes were largely in balance. Currently about 57% of human-emitted {{CO2}} is removed by the biosphere and oceans.<ref>{{cite journal |author=Canadell JG, Le Quéré C, Raupach MR, ''et al.'' |title=Contributions to accelerating atmospheric {{CO2}} growth from economic activity, carbon intensity, and efficiency of natural sinks |journal=[[Proc. Natl. Acad. Sci. U.S.A.]] |volume=104 |issue=47 |pages=18866–70 |year=2007 |month=November |pmid=17962418 |pmc=2141868 |doi=10.1073/pnas.0702737104 |url=http://www.pnas.org/cgi/pmidlookup?view=long&pmid=17962418|bibcode = 2007PNAS..10418866C }}</ref> The ratio of the increase in atmospheric {{CO2}} to emitted {{CO2}} is known as the ''airborne fraction'' (Keeling et al., 1995); this varies for short-term averages but is typically about 45% over longer (5 year) periods. Estimated carbon in global terrestrial vegetation increased from approximately 740 billion tons in 1910 to 780 billion tons in 1990.<ref>{{cite journal |author=Post WM, King AW, Wullschleger SD, Hoffman FM |title=Historical Variations in Terrestrial Biospheric Carbon Storage |journal=DOE Research Summary |volume=34 |date=June 1997 |url=http://cdiac.esd.ornl.gov/pns/doers/doer34/doer34.htm |publisher=CDIAC, U.S. Department of Energy |bibcode=1997GBioC..11...99P |last2=King |last3=Wullschleger |pages=99 |doi=10.1029/96GB03942 }}</ref> |
Most sources of {{CO2}} emissions are natural, and are balanced to various degrees by natural {{CO2}} sinks. For example, the natural decay of organic material in forests and grasslands and the action of forest fires results in the release of about 439 gigatonnes of carbon dioxide every year, while new growth entirely counteracts this effect, absorbing 450 gigatonnes per year.<ref>IPCC Fourth Assessment Report: Climate Change 2007 (AR4) (available online at: http://www.ipcc.ch/publications_and_data/publications_and_data_reports.shtml#.T_EtQZFuqSo)</ref> Although the initial carbon dioxide in the atmosphere of the young Earth was produced by [[volcano|volcanic activity]], modern volcanic activity releases only 130 to 230 [[tonne|megatonnes]] of carbon dioxide each year,<ref>{{cite journal |author=Gerlach, T.M. |title=Present-day {{CO2}} emissions from volcanoes |journal=Eos, Transactions |volume=72 |issue=23 |pages=249, 254–5 |date=4 June 1991 |publisher=American Geophysical Union |doi=10.1029/90EO10192 |bibcode=1991EOSTr..72..249.}}</ref> which is less than 1% of the amount released by human activities (at approximately 29,000 megatonnes).<ref>U.S. Geological Survey, "[http://volcanoes.usgs.gov/Hazards/What/VolGas/volgas.html Volcanic Gases and Their Effects]", [http://volcanoes.usgs.gov volcanoes.usgs.gov]</ref> These natural sources are nearly balanced by natural sinks, physical and biological processes which remove carbon dioxide from the atmosphere. For example, some is directly removed from the atmosphere by land plants for [[photosynthesis]] and it is soluble in water forming [[carbonic acid]]. There is a large natural flux of {{CO2}} into and out of the [[biosphere]] and oceans.<ref>{{cite book |author=Cappelluti, G.; Bösch, H.; Monks, P.S. |title=Use of remote sensing techniques for the detection and monitoring of GHG emissions from the Scottish land use sector |publisher=Scottish Government |year=2009 |isbn=978-0-7559-7738-3 |url=http://www.scotland.gov.uk/Publications/2009/12/15084401/0}}</ref> In the pre-industrial era these fluxes were largely in balance. Currently about 57% of human-emitted {{CO2}} is removed by the biosphere and oceans.<ref>{{cite journal |author=Canadell JG, Le Quéré C, Raupach MR, ''et al.'' |title=Contributions to accelerating atmospheric {{CO2}} growth from economic activity, carbon intensity, and efficiency of natural sinks |journal=[[Proc. Natl. Acad. Sci. U.S.A.]] |volume=104 |issue=47 |pages=18866–70 |year=2007 |month=November |pmid=17962418 |pmc=2141868 |doi=10.1073/pnas.0702737104 |url=http://www.pnas.org/cgi/pmidlookup?view=long&pmid=17962418|bibcode = 2007PNAS..10418866C }}</ref> The ratio of the increase in atmospheric {{CO2}} to emitted {{CO2}} is known as the ''airborne fraction'' (Keeling et al., 1995); this varies for short-term averages but is typically about 45% over longer (5 year) periods. Estimated carbon in global terrestrial vegetation increased from approximately 740 billion tons in 1910 to 780 billion tons in 1990.<ref>{{cite journal |author=Post WM, King AW, Wullschleger SD, Hoffman FM |title=Historical Variations in Terrestrial Biospheric Carbon Storage |journal=DOE Research Summary |volume=34 |date=June 1997 |url=http://cdiac.esd.ornl.gov/pns/doers/doer34/doer34.htm |publisher=CDIAC, U.S. Department of Energy |bibcode=1997GBioC..11...99P |last2=King |last3=Wullschleger |pages=99 |doi=10.1029/96GB03942 }}</ref> |
||
===Carbon dioxide emissions=== |
===Carbon dioxide emissions=== |
||
Revision as of 07:10, 2 April 2013

The concentration of carbon dioxide (CO2) in Earth's atmosphere has reached 391 ppm (parts per million) as of October 2012[update][1][2] and rose by 2.0 ppm/yr during 2000–2009 and faster since then. [2][3] This current concentration is substantially higher than the 280 ppm concentration present in pre-industrial times, with the increase largely attributed to anthropogenic sources.[4] Carbon dioxide is used in photosynthesis (in plants and other photoautotrophs), and is also a prominent greenhouse gas. Despite its relatively small overall concentration in the atmosphere, CO2 is an important component of Earth's atmosphere because it absorbs and emits infrared radiation at wavelengths of 4.26 µm (asymmetric stretching vibrational mode) and 14.99 µm (bending vibrational mode), thereby playing a role in the greenhouse effect.[5] The present level is higher than at any time during the last 800 thousand years,[6] and likely higher than in the past 20 million years.[7]
Current concentration
.png)
In 2009, the CO2 global average concentration in Earth's atmosphere was about 0.0387%[9] , or 387 parts per million.[2][10] There is an annual fluctuation of about 3–9 ppmv which roughly follows the Northern Hemisphere's growing season. The Northern Hemisphere dominates the annual cycle of CO2 concentration because it has much greater land area and plant biomass than the Southern Hemisphere. Concentrations peak in May as the Northern Hemisphere spring greenup begins and reach a minimum in October when the quantity of biomass undergoing photosynthesis is greatest.[11]
Sources of carbon dioxide
Natural sources of atmospheric carbon dioxide include volcanic outgassing, the combustion of organic matter, wildfires and the respiration processes of living aerobic organisms; man-made sources of carbon dioxide include the burning of fossil fuels for heating, power generation and transport, as well as some industrial processes such as cement making. It is also produced by various microorganisms from fermentation and cellular respiration. Plants convert carbon dioxide to carbohydrates during a process called photosynthesis. They gain the energy needed for this reaction through the absorption of sunlight by pigments such as chlorophyll. The resulting gas, oxygen, is released into the atmosphere by plants, which is subsequently used for respiration by heterotrophic organisms and other plants, forming a cycle.
Most sources of CO2 emissions are natural, and are balanced to various degrees by natural CO2 sinks. For example, the natural decay of organic material in forests and grasslands and the action of forest fires results in the release of about 439 gigatonnes of carbon dioxide every year, while new growth entirely counteracts this effect, absorbing 450 gigatonnes per year.[12] Although the initial carbon dioxide in the atmosphere of the young Earth was produced by volcanic activity, modern volcanic activity releases only 130 to 230 megatonnes of carbon dioxide each year,[13] which is less than 1% of the amount released by human activities (at approximately 29,000 megatonnes).[14] These natural sources are nearly balanced by natural sinks, physical and biological processes which remove carbon dioxide from the atmosphere. For example, some is directly removed from the atmosphere by land plants for photosynthesis and it is soluble in water forming carbonic acid. There is a large natural flux of CO2 into and out of the biosphere and oceans.[15] In the pre-industrial era these fluxes were largely in balance. Currently about 57% of human-emitted CO2 is removed by the biosphere and oceans.[16] The ratio of the increase in atmospheric CO2 to emitted CO2 is known as the airborne fraction (Keeling et al., 1995); this varies for short-term averages but is typically about 45% over longer (5 year) periods. Estimated carbon in global terrestrial vegetation increased from approximately 740 billion tons in 1910 to 780 billion tons in 1990.[17]
Carbon dioxide emissions
| Technology | Description | 50th percentile (g CO2/kWhe) |
|---|---|---|
| Hydroelectric | reservoir | 4 |
| Wind | onshore | 12 |
| Nuclear | various generation II reactor types | 16 |
| Biomass | various | 18 |
| Solar thermal | parabolic trough | 22 |
| Geothermal | hot dry rock | 45 |
| Solar PV | Polycrystaline silicon | 46 |
| Natural gas | various combined cycle turbines without scrubbing | 469 |
| Coal | various generator types without scrubbing | 1001 |
- Total CO2 emissions
| Countries with the highest CO2 emissions | |||
|---|---|---|---|
| Country | Carbon dioxide emissions per year (106 Tons) (2006) |
Percentage of global total | Avg. emission per km2 of its land (tons) |
| 6,103 | 21.5% | 636 | |
| 5,752 | 20.2% | 597 | |
| 1,564 | 5.5% | 91 | |
| 1,510 | 5.3% | 459 | |
| 1,293 | 4.6% | 3421 | |
| 805 | 2.8% | 2254 | |
| 568 | 2.0% | 2338 | |
| 544 | 1.9% | 54 | |
| 475 | 1.7% | 4758 | |
| 474 | 1.7% | 1573 | |
- Per capita CO2 emissions[19]
| Countries with the highest per capita CO2 emissions | ||
|---|---|---|
| Country | Carbon dioxide emissions per year (Tons per person) (2006) | |
| 56.2 | ||
| 32.8 | ||
| 31.2 | ||
| 28.8 | ||
| 25.3 | ||
| 24.5 | ||
| 22.8 | ||
| 22.3 | ||
| 19 | ||
| 18.1 | ||
Anthropogenic CO2 increase
While CO2 absorption and release is always happening as a result of natural processes, the recent drastic rise in CO2 levels in the atmosphere is known to be entirely due to human activity.[20][citation needed] Researchers know this both by calculating the amount released based on various national statistics, and by examining the ratio of various carbon isotopes in the atmosphere,[20] as the burning of long-buried fossil fuels releases CO2 containing carbon of different isotopic ratios to those of living plants, enabling scientists to distinguish between natural and human-caused contributions to CO2 concentration.
Burning fossil fuels such as coal and petroleum is the leading cause of increased anthropogenic CO2; deforestation is the second major cause. In 2010, 9.14 gigatonnes of carbon (33.5 gigatonnes of CO2) were released from fossil fuels and cement production worldwide, compared to 6.15 gigatonnes in 1990.[21] In addition, land use change contributed 0.87 gigatonnes in 2010, compared to 1.45 gigatonnes in 1990.[21] In 1997, human-caused Indonesian peat fires were estimated to have released between 13% and 40% of the average carbon emissions caused by the burning of fossil fuels around the world in a single year.[22][23][24] In the period 1751 to 1900 about 12 gigatonnes of carbon were released as carbon dioxide to the atmosphere from burning of fossil fuels, whereas from 1901 to 2008 the figure was about 334 gigatonnes.[25]
This addition, about 3% of annual natural emissions as of 1997[update], is sufficient to exceed the balancing effect of sinks.[26] As a result, carbon dioxide has gradually accumulated in the atmosphere, and as of 2009[update], its concentration is 39% above pre-industrial levels.[3]
Various techniques have been proposed for removing excess carbon dioxide from the atmosphere in carbon dioxide sinks.
-
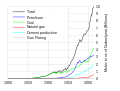 Global fossil carbon emissions 1800–2007.
 -
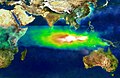 False-color image of smoke and ozone pollution from Indonesian fires, 1997.
 -
 Biosphere CO2 Flux in the northern hemisphere summer (NOAA Carbon Tracker).
 -
 Biosphere CO2 Flux in the northern hemisphere winter (NOAA Carbon Tracker).


Past variation
The most direct method for measuring atmospheric carbon dioxide concentrations for periods before direct sampling is to measure bubbles of air (fluid or gas inclusions) trapped in the Antarctic or Greenland ice sheets. The most widely accepted of such studies come from a variety of Antarctic cores and indicate that atmospheric CO2 levels were about 260–280 ppmv immediately before industrial emissions began and did not vary much from this level during the preceding 10,000 years (10 ka). In 1832 Antarctic ice core levels were 284 ppmv.[27]


One study disputed the claim of stable CO2 levels during the present interglacial of the last 10 ka. Based on an analysis of fossil leaves, Wagner et al.[32] argued that CO2 levels during the period 7–10 ka were significantly higher (~300 ppm) and contained substantial variations that may be correlated to climate variations. Others have disputed such claims, suggesting they are more likely to reflect calibration problems than actual changes in CO2.[33] Relevant to this dispute is the observation that Greenland ice cores often report higher and more variable CO2 values than similar measurements in Antarctica. However, the groups responsible for such measurements (e.g. H. J Smith et al.[34]) believe the variations in Greenland cores result from in situ decomposition of calcium carbonate dust found in the ice. When dust levels in Greenland cores are low, as they nearly always are in Antarctic cores, the researchers report good agreement between Antarctic and Greenland CO2 measurements.
The longest ice core record comes from East Antarctica, where ice has been sampled to an age of 800 ka.[6] During this time, the atmospheric carbon dioxide concentration has varied between 180–210 ppm during ice ages, increasing to 280–300 ppm during warmer interglacials.[35][36] The beginning of human agriculture during the current Holocene epoch may have been strongly connected to the atmospheric CO2 increase after the last ice age ended, a fertilization effect raising plant biomass growth and reducing stomatal conductance requirements for CO2 intake, consequently reducing transpiration water losses and increasing water usage efficiency.[37]
On long timescales, atmospheric CO2 content is determined by the balance among geochemical processes including organic carbon burial in sediments, silicate rock weathering, and volcanism. The net effect of slight imbalances in the carbon cycle over tens to hundreds of millions of years has been to reduce atmospheric CO2. On a timescale of billions of years, such downward trend appears bound to continue indefinitely as occasional massive historical releases of buried carbon due to volcanism will become less frequent (as earth mantle cooling and progressive exhaustion of internal radioactive heat proceeds further). The rates of these processes are extremely slow; hence they are of no relevance to the atmospheric CO2 concentration over the next hundreds, thousands, or millions of years.
Various proxy measurements have been used to attempt to determine atmospheric carbon dioxide levels millions of years in the past. These include boron and carbon isotope ratios in certain types of marine sediments, and the number of stomata observed on fossil plant leaves. While these measurements give much less precise estimates of carbon dioxide concentration than ice cores, there is evidence for very high CO2 volume concentrations between 200 and 150 Ma of over 3,000 ppm and between 600 and 400 Ma of over 6,000 ppm.[7] In more recent times, atmospheric CO2 concentration continued to fall after about 60 Ma. About 34 Ma, the time of the Eocene–Oligocene extinction event and when the Antarctic ice sheet started to take its current form, CO2 is found to have been about 760 ppm,[38] and there is geochemical evidence that volume concentrations were less than 300 ppm by about 20 Ma. Carbon dioxide decrease, with a tipping point of 600 ppm, was the primary agent forcing Antarctic glaciation.[39] Low CO2 concentrations may have been the stimulus that favored the evolution of C4 plants, which increased greatly in abundance between 7 and 5 Ma.
Assuming a future absence of human impact influencing releasing of sequestered carbon, the long term natural trend is for the plant life on land to die off altogether, as most of the remaining carbon in the atmosphere will become sequestered underground on a billion-years timescale, as natural releases of CO2 by radioactivity-driven tectonic activity will continue to slow down.[40] Some microbes are capable of photosynthesis at concentrations of CO2 of a few parts per million. Last life forms would probably disappear only because of rising temperatures and loss of the atmosphere when the sun becomes a red giant some four-billion years from now.[41] The loss of plant life will also result in the eventual loss of oxygen (see also Future of the Earth).
Relationship with oceanic concentration

The Earth's oceans contain a huge amount of carbon dioxide in the form of bicarbonate and carbonate ions — much more than the amount in the atmosphere. The bicarbonate is produced in reactions between rock, water, and carbon dioxide. One example is the dissolution of calcium carbonate:
- CaCO
3 + CO2 + H
2O ⇌ Ca2+
+ 2 HCO−
3
Reactions like this tend to buffer changes in atmospheric CO2. Since the right-hand side of the reaction produces an acidic compound, adding CO2 on the left-hand side decreases the pH of sea water, a process which has been termed ocean acidification (pH of the ocean becomes acidic although the pH value remains in the alkaline range). Reactions between carbon dioxide and non-carbonate rocks also add bicarbonate to the seas. This can later undergo the reverse of the above reaction to form carbonate rocks, releasing half of the bicarbonate as CO2. Over hundreds of millions of years this has produced huge quantities of carbonate rocks.
Ultimately, most of the CO2 emitted by human activities will dissolve in the ocean;[42] however, the rate at which the ocean will take it up in the future is less certain. Even if equilibrium is reached, including dissolution of carbonate minerals, the increased concentration of bicarbonate and decreased or unchanged concentration of carbonate ion will give rise to a higher concentration of un-ionized carbonic acid and dissolved carbon dioxide gas. This, along with higher temperatures, would mean a higher equilibrium concentration of carbon dioxide in the air.
Irreversibility and uniqueness of carbon dioxide
Carbon dioxide has unique long-term effects on climate change that are largely "irreversible" for one thousand years after emissions stop (zero further emissions) even though carbon dioxide tends toward equilibrium with the ocean on a scale of 100 years. The greenhouse gases methane and nitrous oxide do not persist over time in the same way as carbon dioxide. Even if human carbon dioxide emissions were to completely cease, atmospheric temperatures are not expected to decrease significantly in the short term.[43][44][45][46]
See also
- Avoiding Dangerous Climate Change — A Scientific Symposium on Stabilisation of Greenhouse Gases
- Carbon cycle
- Carbon dioxide equivalent
- Climate change
- Eddy covariance flux (aka eddy correlation, eddy flux)
- Global warming
- Greenhouse effect
- List of countries by carbon dioxide emissions per capita
- List of countries by carbon dioxide emissions
- List of countries by ratio of GDP to carbon dioxide emissions
- Ocean acidification
- Snowball Earth
References
- ^ NOAA Mauna Loa dataset (reported online at: http://co2now.org/ )
- ^ a b c Tans, Pieter. "Trends in Carbon Dioxide". NOAA/ESRL. Retrieved 11 December 2009.
- ^ a b Carbon Budget 2009 Highlights, globalcarbonproject.org, retrieved 2 November 2012 Cite error: The named reference "carbon budget" was defined multiple times with different content (see the help page).
- ^ Etheridge, D. M. (1996). "Natural and anthropogenic changes in atmospheric CO2 over the last 1000 years from air in Antarctic ice and firn". Journal of Geophysical Research. 101 (D2): 4115–4128. Bibcode:1996JGR...101.4115E. doi:10.1029/95JD03410. ISSN 0148-0227.
{{cite journal}}: Unknown parameter|coauthors=ignored (|author=suggested) (help) - ^ Petty, G.W. (2004). A First Course in Atmospheric Radiation. Sundog Publishing. pp. 229–251.
- ^ a b Amos, Jonathan (4 September 2006). "Deep ice tells long climate story". BBC News. Retrieved 28 April 2010.
- ^ a b Climate Change 2001: The Scientific Basis
- ^ US Environmental Protection Agency (EPA), Causes of Climate Change: Climate Change: US EPA
- ^ Earth System Research Laboratory Global Monitoring Division>"Trends in Atmospheric Carbon Dioxide".
- ^ "Current atmospheric CO2 concentration at http://co2unting.com".
{{cite web}}: External link in|title= - ^ "Frequently Asked Questions". Carbon Dioxide Information Analysis Center (CDIAC).
- ^ IPCC Fourth Assessment Report: Climate Change 2007 (AR4) (available online at: http://www.ipcc.ch/publications_and_data/publications_and_data_reports.shtml#.T_EtQZFuqSo)
- ^ Gerlach, T.M. (4 June 1991). "Present-day CO2 emissions from volcanoes". Eos, Transactions. 72 (23). American Geophysical Union: 249, 254–5. Bibcode:1991EOSTr..72..249.. doi:10.1029/90EO10192.
- ^ U.S. Geological Survey, "Volcanic Gases and Their Effects", volcanoes.usgs.gov
- ^ Cappelluti, G.; Bösch, H.; Monks, P.S. (2009). Use of remote sensing techniques for the detection and monitoring of GHG emissions from the Scottish land use sector. Scottish Government. ISBN 978-0-7559-7738-3.
{{cite book}}: CS1 maint: multiple names: authors list (link) - ^ Canadell JG, Le Quéré C, Raupach MR; et al. (2007). "Contributions to accelerating atmospheric CO2 growth from economic activity, carbon intensity, and efficiency of natural sinks". Proc. Natl. Acad. Sci. U.S.A. 104 (47): 18866–70. Bibcode:2007PNAS..10418866C. doi:10.1073/pnas.0702737104. PMC 2141868. PMID 17962418.
{{cite journal}}: Explicit use of et al. in:|author=(help); Unknown parameter|month=ignored (help)CS1 maint: multiple names: authors list (link) - ^ Post WM, King AW, Wullschleger SD, Hoffman FM; King; Wullschleger (June 1997). "Historical Variations in Terrestrial Biospheric Carbon Storage". DOE Research Summary. 34. CDIAC, U.S. Department of Energy: 99. Bibcode:1997GBioC..11...99P. doi:10.1029/96GB03942.
{{cite journal}}: CS1 maint: multiple names: authors list (link) - ^ http://srren.ipcc-wg3.de/report/IPCC_SRREN_Annex_II.pdf see page 10 Moomaw, W., P. Burgherr, G. Heath, M. Lenzen, J. Nyboer, A. Verbruggen, 2011: Annex II: Methodology. In IPCC Special Report on Renewable Energy Sources and Climate Change Mitigation.
- ^ International Carbon Dioxide Emissions and Carbon Intensity Energy Information Administration
- ^ a b e.g. Gosh, Prosenjit; Brand, Willi A. (2003). "Stable isotope ratio mass spectrometry in global climate change research" (PDF). International Journal of Mass Spectrometry. 228: 1–33. doi:10.1016/S1387-3806(03)00289-6.
- ^ a b G.P. Peters et al. Global carbon budget 2010 (summary), Tyndall Centre for Climate Change Research
- ^ Attention: This template ({{cite doi}}) is deprecated. To cite the publication identified by doi:10.1038/nature01131, please use {{cite journal}} (if it was published in a bona fide academic journal, otherwise {{cite report}} with
|doi=10.1038/nature01131instead. - ^ Lazaroff, Cat (8 November 2002). "Indonesian Wildfires Accelerated Global Warming". Environment New Service. Retrieved 7 November 2011.
- ^ Pearce, Fred (6 November 2004). "Massive peat burn is speeding climate change". New Scientist.
- ^ Calculated from file global.1751_2008.csv in [1] from the Carbon Dioxide Information Analysis Center.
- ^ US Global Change Research Information Office, "Common Questions about Climate Change"
- ^ "Historical CO2 record derived from a spline fit (20 year cutoff) of the Law Dome DE08 and DE08-2 ice cores". Retrieved 12 June 2007.
- ^ Royer, Dana L. (2006). "CO2-forced climate thresholds during the Phanerozoic" (PDF). Geochimica et Cosmochimica Acta. 70 (23): 5665–75. Bibcode:2006GeCoA..70.5665R. doi:10.1016/j.gca.2005.11.031.
- ^ Guinan; Ribas (2002). "Our Changing Sun: The Role of Solar Nuclear Evolution and Magnetic Activity on Earth's Atmosphere and Climate". In Montesinos, Benjamin; Gimenez, Alvaro; Guinan, Edward F. (ed.). The Evolving Sun and its Influence on Planetary Environments. ASP Conference Proceedings. Vol. 269. San Francisco: Astronomical Society of the Pacific. p. 85. ISBN 1-58381-109-5.
{{cite book}}: External link in|chapterurl=|chapterurl=ignored (|chapter-url=suggested) (help)CS1 maint: multiple names: editors list (link) - ^ Beerling, David (2008). The Emerald Planet: How Plants Changed Earth's History. Oxford University Press. ISBN 9780199548149.
- ^ Foellmi, K.B. (2012). "Early Cretaceous life, climate and anoxia". Cretaceous Research. 33: 230–257. doi:10.1016/j.cretres.2011.12.005.
- ^ Wagner, Friederike (2002). "Rapid atmospheric O
2 changes associated with the 8,200-years-B.P. cooling event". Proc. Natl. Acad. Sci. U.S.A. 99 (19): 12011–4. Bibcode:2002PNAS...9912011W. doi:10.1073/pnas.182420699. PMC 129389. PMID 12202744.{{cite journal}}: Unknown parameter|coauthors=ignored (|author=suggested) (help) - ^ Indermühle, Andreas (1999). "Early Holocene Atmospheric CO2 Concentrations". Science. 286 (5446): 1815. doi:10.1126/science.286.5446.1815a.
{{cite journal}}: Unknown parameter|coauthors=ignored (|author=suggested) (help) - ^ Smith, H.J. (1997). "The CO2 concentration of air trapped in GISP2 ice from the Last Glacial Maximum-Holocene transition". Geophysical Research Letters. 24 (1): 1–4. Bibcode:1997GeoRL..24....1S. doi:10.1029/96GL03700.
{{cite journal}}: Unknown parameter|coauthors=ignored (|author=suggested) (help) - ^ Hileman B (November 2005). "Ice Core Record Extended: Analyses of trapped air show current CO2 at highest level in 650,000 years". Chemical & Engineering News. 83 (48): 7. ISSN 0009-2347.
- ^ Vostok Ice Core Data, ncdc.noaa.gov
- ^ Richerson PJ, Boyd R, Bettinger RL (July 2001). "Was Agriculture Impossible During The Pleistocene But Mandatory During The Holocene?" (PDF). American Antiquity. 66 (3): 387–411. doi:10.2307/2694241. JSTOR 2694241.
{{cite journal}}: CS1 maint: multiple names: authors list (link) - ^ "New CO2 data helps unlock the secrets of Antarctic formation". Physorg.com. 13 September 2009.
- ^ http://www.sciencedaily.com/releases/2011/12/111201174225.htm
- ^ Ward, Peter Douglas; Brownlee, Donald (2003). The life and death of planet Earth. Macmillan. pp. 117–128. ISBN 0-8050-7512-7.
- ^ Caldeira, Ken; Kasting, James F. (December 1992). "The life span of the biosphere revisited". Nature. 360 (6406): 721–3. Bibcode:1992Natur.360..721C. doi:10.1038/360721a0. PMID 11536510.
- ^ Archer, D. (2005). "Fate of fossil fuel CO2 in geologic time". J. Geophys. Res. 110. Bibcode:2005JGRC..11009S05A. doi:10.1029/2004JC002625.
- ^ Solomon S, Plattner GK, Knutti R, Friedlingstein P (2009). "Irreversible climate change due to carbon dioxide emissions". Proc. Natl. Acad. Sci. U.S.A. 106 (6): 1704–9. Bibcode:2009PNAS..106.1704S. doi:10.1073/pnas.0812721106. PMC 2632717. PMID 19179281.
{{cite journal}}: Unknown parameter|month=ignored (help)CS1 maint: multiple names: authors list (link) - ^ "2010 in the top three warmest years, 2001-2010 warmest 10-year period". WMO statement on the global climate in 2010. World Meteorological Organization. 2010. Retrieved 7 November 2011.
- ^ Cohen, Judah (25 December 2010). "Bundle Up, It's Global Warming". The New York Times.
- ^ Carrington, Damian (4 July 2011). "Sulphur from Chinese power stations 'masking' climate change". The Guardian. London.
| |||||||||||||
| |||||||||||||
| |||||||||||||
| |||||||||||||
| |||||||||||||
| |||||||||||||