From Wikipedia, the free encyclopedia
1967 Japanese general election Turnout 73.99% (
First party
Second party
Third party
Leader
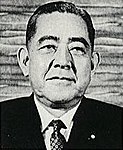
Eisaku Satō
Kōzō Sasaki
Suehiro Nishio
Party
Liberal Democratic
Socialist
Democratic Socialist
Leader since
1 December 1964
6 May 1965
1960
Last election
283 seats, 56.0%
144 seats, 29.0%
23 seats, 7.4%
Seats won
277
140
30
Seat change
Popular vote
22,447,838
12,826,104
3,404,464
Percentage
48.9%
27.9%
7.4%
Swing
Fourth party
Fifth party
Leader
Tsuji Takehisa
Sanzō Nosaka
Party
Komeito
Communist
Leader since
9 December 1964
1 August 1958
Last election
New
5 seats, 4.0%
Seats won
25
5
Seat change
New
Popular vote
2,472,371
2,190,564
Percentage
5.4%
4.8%
Swing
N/A
General elections were held in Japan on 29 January 1967. The result was a victory for the Liberal Democratic Party , which won 277 of the 486 seats.[ 1]
Results
Party
Votes
%
Seats
+/-
Liberal Democratic Party 22,447,838
48.8
277
-6
Japan Socialist Party 12,826,104
27.9
140
-4
Democratic Socialist Party 3,404,464
7.4
30
+7
Komeitō 2,472,371
5.4
25
New
Japanese Communist Party 2,190,564
4.8
5
0
Other parties
101,244
0.2
0
0
Independents
2,553,989
5.6
9
-3
Total 45,996,574 100 486 +19
Source: Nohlen et al.
Vote share
LDP
48.80%
JSP
27.88%
DSP
7.40%
KP
5.38%
JCP
4.76%
Independents
5.55%
Others
0.22%
Parliament seats
LDP
57.00%
JSP
28.81%
DSP
6.17%
KP
5.14%
JCP
1.03%
Independents
1.85%
References


