Opinion polling for the 2022 Australian federal election is within the scope of WikiProject Australia, which aims to improve Wikipedia's coverage of Australia and Australia-related topics. If you would like to participate, visit the project page.AustraliaWikipedia:WikiProject AustraliaTemplate:WikiProject AustraliaAustralia articles
This article is within the scope of WikiProject Elections and Referendums, an ongoing effort to improve the quality of, expand upon and create new articles relating to elections, electoral reform and other aspects of democratic decision-making. For more information, visit our project page.Elections and ReferendumsWikipedia:WikiProject Elections and ReferendumsTemplate:WikiProject Elections and ReferendumsElections and Referendums articles
I realised the lines on the poll graphs are straight. Are we using a moving average or are they just plotted points which are connected? Also, people that were there for the last election, when does the graph usually get added? 4 data points doesn't seem like it'd make an accurate graph. Catiline52 (talk) 09:10, 21 September 2019 (UTC)[reply]
The most analogous article to 2022 in the Philippines would be "2021..." or "2022 in Australia', which don't exist for probably same reason as the main deletion rationale: WP:CRYSTAL. Perhaps some future/next election articles could be at risk of being proposed or nominated for deletion (they list party leaders although these can change, e.g. Di Natale/Bandt), but I don't think the consensus at the 2022 AfD (unless 2022 Philippine presidential election gets deleted) are so clearly connected to these that they could convincingly override supporting consensus should these election articles end up at AfD. And this article ("Opinion polling for the next Australian federal election") is even further from the future year in [country] or future election articles—it lists opinion polls which have already occurred so is not presupposing a future state of affairs. --Canley (talk) 01:41, 7 February 2020 (UTC)[reply]
What to do with "don't know" when it is published[edit]
The ANUpoll of primary voting intention from 20 January – 3 February 2020 was published as a raw poll with a "don't know" response variable.
This differs from the standard practice among the commercial pollsters who attribute the "don't know" responses across the other response categories on a pro-rata basis.
For consistency, I suggest we do the same with the ANUpoll so that it can be compared with the other polls in this table. Alternatively, we could introduce a "don't know" column, so that it is clear that it has been published on a different basis.
Hi, there's currently an edit war between three different versions of the same information, but on different graphs. I'd like to hear other editors views, and we can reach consensus about which graph to use rather than it constantly being changed every time a new poll gets announced.
Which one should we use? I suggest Canley's, since it would keep the graphs consistent to previous elections, the data is clearer, and there is a clear delineation between the 2PP and 1PP to make the data more readable and understandable. Catiline52 (talk) 03:28, 8 June 2020 (UTC)[reply]
As one of the options, obviously I'm biased! In a way, it's good that there are multiple editors willing and able to produce the polling charts, but it seems a bit presumptuous, even a little impolite, to replace a long-standing chart set with one's own without discussion or a reason. If I hadn't updated them in months or said I didn't have the time anymore, of course it would be fine, but that's not the case.
I started doing these in August 2018, as they were only being updated every three months and there was a lot of interest in the immediate effect of leadership spills and other events on polls, so I approached the editor who had been updating them and they were happy for me to take it over. I made the R code and data available on Github so that if I stopped updating them, someone else could take up the mantle, but I have updated them same day for every poll since then. I will keep doing so even if they are not used (they are still shown on the election page), and I haven't reverted the changes by the other charters (I didn't want to get into an edit war about it), but have just hoped that other Auspol editors (such as yourself, and thank you for your support) would see the value in what I hope are their clarity and real-time updating.
Julio974gaming's charts are good (also done in ggplot2!), but they are producing charts and maps for many elections around the world – that's fantastic, but they are only updated monthly and lack some knowledge of the Australian situation in my opinion (such as making the 2PP data less prominent when it is the key figure). I don't have a problem with using both, maybe one on the election page and a more detailed one on the polling page, but now we have the silly situation where another editor (Arachnus64) has turned up and is replacing both my and Julio974gaming's charts with yet another version! In both the others, I'm not a fan of the full term width x-axis, but it's not a huge problem as there are not many polls in this term so you're not losing too much by compressing the axis scale. Arachnus64's charts should also be SVG not PNG, but they seem to have a better understanding of Australian polling.
In summary, I'll keep updating my charts as soon as new polls are released, but if there is consensus on replacing them, that's fine with me... I just would have appreciated a heads-up, some feedback or a rationale from the others before replacing them wholesale. --Canley (talk) 05:32, 8 June 2020 (UTC)[reply]
For the comment about making 2PP more prominent than first choice, it's ready for the next update. For the rest, I suggest doing like what has somewhat been agreed for the New Zealand elections, which is to not determine a favorite graph, and just let whoever has the most updated version put their polling graph (but only changing when new polls are added, to avoid edit wars). Julio974◆ (Talk-Contribs) 07:46, 8 June 2020 (UTC)[reply]
A bit late of a response, but I only did the graphs at the time because I saw that the primary voting intention and the 2pp graphs had been combined, and I felt given how important 2pp is in determining the results of Australian elections (and the general focus placed on it by pollsters & media), that it needed to be split out to give it more prominence and to make changes in it easier to determine.
For example, a shift of 1 - 2% on primary votes doesn't matter much, especially if the votes go to ideologically similar parties (e.g. if centre-left Labor drops by 1% but left-leaning Greens rise by 1.3%, then the net effect on 2pp is basically zero), but 1 - 2% swings on the 2pp can decide elections (especially considering how close Australian federal elections tend to be, on the 2pp). Hence I felt putting them on the same graph, where the same scale was used for both, compressed significant changes on the 2pp due to the axis used.
Apologised if that devolved into some kind of edit war (don't recall what happened exactly). For the record I was perfectly fine with Canley graphs, I just objected to the graphs in place at the time which combined 2pp and primary vote. Arachnus64 (talk) 08:29, 22 April 2021 (UTC)[reply]
I'd like to discuss this change before adding it to the infobox. Essentials recently released a series of opinion polls for votes since January 2020. However, instead of doing a simple 2PP, they are releasing a 2PP with the undecided voters separated into their own section. What would be the best way to integrate this new way of polling, should we add a separate column? Catiline52 (talk) 23:29, 27 July 2020 (UTC)[reply]
Considering the reason for the inclusion of undecideds and the overall revamp (and the fact that for polling trends people will often come to this article) being to provide more nuance in the horse race discussion; to illustrate the potential of change I am of the position that we should add an undecided collum, or if we do not agree to that (or if an editing war starts) then we add a note that explains the number of undecided and the 2PP with them. For the graph I think we would need to ignore undecideds for it to make sense. Not Another NPC 03:39, 29 July 2020
Added the new format to the page, if it causes too many issues with the graphs we could separate it into a dedicated 2pp+ section. Catiline52 (talk) 05:57, 29 July 2020 (UTC)[reply]
I'll do some more reading on the 2PP+ methodology and let you know if any issues. --Canley (talk) 06:03, 29 July 2020 (UTC)[reply]
Hey, I was just wondering if an editor could make some minor adjustments to the graph. Is it possible that the primary vote graph could start off with 0 at the base of the graph, rather than it being relatively high up? It makes minor parties look like they have significantly higher support than they do, and it isn't the same standard used on other graphs. Catiline52 (talk) 01:44, 7 February 2021 (UTC)[reply]
Sure, no problem. --Canley (talk) 02:39, 7 February 2021 (UTC)[reply]
Recent changes have ruined the two-party preferred graphical summary.[edit]
I suggest a revert to Revision as of 01:38, 31 March 2021, where the graph had symmetry around 50%. MathewMunro (talk) 11:54, 5 April 2021 (UTC)[reply]
I suspect that is because the new chart likely includes the Essential "2PP+" values which the charts I was doing didn't. It should be simple to take them out, I agree they probably shouldn't be included as the methodology is so different to Newspoll and Morgan, they can't be aggregated with the others without causing strange effects like loss of symmetry. --Canley (talk) 12:12, 5 April 2021 (UTC)[reply]
I strongly prefer the old graphs anyway. Now, the lines aren't really trendlines, they're just random. --Gbuvn (talk) 12:29, 5 April 2021 (UTC)[reply]
The advantage of the Chart module is that anyone can update the graphs in the wiki markup, but I'm not a big fan of the interpolation it uses either. --Canley (talk) 12:38, 5 April 2021 (UTC)[reply]
I want to include all the data in the graphs. I'll convert the survey data that includes 'undecided' to a 2pp format symmetric about the 50% axis by grossing it up, for example, if ALP was 32%, Lib was 48% and undecided was 20%, ALP 2pp would be 32%/(32% + 48%) = 40%, and Lib would be 48%/(32% + 48%) = 60%, and I'll round to 1dp where necessary. MathewMunro (talk) 13:24, 5 April 2021 (UTC)[reply]
(edit conflict) I don't really see the point in making updates easier as long as the svg used isn't out of date, especially when the alternative isn't just graphically worse but even hard to justify as being mathematically correct. --Gbuvn (talk) 13:31, 5 April 2021 (UTC)[reply]
It's probably too much effort to keep up to date in the article, but for interest sake, I'll post it in Talk.
I think the trend lines available in Wikipedia are a little erratic and it's not ideal that Wikipedia's 'bundle' and 'basis' trendlines (the only ones that are even half-decent) always starts and ends at the first & last data points on the graph.
I personally prefer a weighted average, with greater weight given to data points close to the trendline point that you're estimating.
For the graph below, I took a weighted average of three data points on either side of the trendline point I was estimating, for a total of seven points (with the exception of either end of the graph), with relative weights of (0.178, 0.366, 0.582, 1.000, 0.582, 0.366 and 0.178). That's based on the formula (1 - (0.5x - 0.25x^2)^0.5)^0.5, where x is the number of surveys away (in time) from the survey that I was estimating the trendline point for. For the first & last trendline point, I used the relative weights (1.000, 0.582, 0.366 and 0.178) and (0.178, 0.366, 0.582, 1.000) respectively. Similarly, for the second/second-last, and third/third-last points, I used five and six data points respectively to estimate the trendline point.
You could improve it further by making the weights depend on the number of days rather than the number of surveys away, and/or the survey sample size or past predictive success, or interpolate points, and/or make the trendline turning-points rounded, or use LOWESS smoothing.
I've also depicted ALP data points with a '+' and LNP data points with an 'x', so that when the points overlap, you can see both.
Primary voting intentionUntil they were replaced yesterday, the graphs I've been updating as soon as a poll comes out did use LOESS smoothing and an alpha transparency on the points so that if they coincide on 50 they are visible as purple. I will keep updating these on Commons whether or not they are used here, so if there is consensus to use these (or your weighted average model which I could adapt them to), they'll still be there and kept up-to-date. --Canley (talk) 22:20, 5 April 2021 (UTC)[reply]
I've added the Essential polls to the SVG charts using allocating the undecided voters according to the decided voter ratio. I also did the same for the primary votes chart. --Canley (talk) 02:28, 6 April 2021 (UTC)[reply]
OK, then let's revert to your version. Can I suggest that you incorporate the polling data by 'Essential' which reports their "two-party preferred" data as split three-ways, including 'undecided', (if you weren't already doing that), by converting it to a comparable format, by applying the simple formula to transform ALP2PP+U + LNP2PP+U + Undecided = 1 to ALP2PP + LNP2PP = 1, namely:
Yes, that was exactly what I did. --Canley (talk) 05:58, 6 April 2021 (UTC)[reply]
I think the trend lines available in Wikipedia are a little erratic and it's not ideal that Wikipedia's 'bundle' and 'basis' trendlines (the only ones that are even half-decent) always starts and ends at the first & last data points on the graph. I can see that here. Bundle could be made less erratic with a lower beta, but I can't see where in the module to add that option (and d3 defaults to 0.85). Basis is even more erratic, as it's the basic spline, corresponding to a bundle beta of 1. I asked about the option of specifying the beta in the template here. As for matching first & last points exactly, I see no hope for that (till someone implements LOWESS in d3). — Guarapiranga☎ 23:23, 3 May 2022 (UTC)[reply]
Actually, LOESS is there! Not in d3, but in Vega, which is the engine underneath {{Graph:Chart}}. Now we just someone to build the Lua interface to use it (don't look at me!). — Guarapiranga☎ 13:02, 8 May 2022 (UTC)[reply]
I'd like someone to develop a second version of the trend-line, still based on local regression, but depicted with smoothly shaded probability cloud(s), like electron orbital models, gradually fading to white by the 95th percentiles, rather than two solid lines, with the width of the cloud varying in time, based on a smoothed trend-line of a locally-weighted standard deviation of survey results. It would be clearer with a single cloud rather than a mirror-image, perhaps with the colour of the cloud at each point in time smoothly varying from red to purple to blue based on the underlying trendline, and perhaps rotated 90-degrees so you can mouse-wheel-scroll past old data and have recent data fill the screen. MathewMunro (talk) 04:10, 21 May 2022 (UTC)[reply]
R, which is what Canley uses for his graphing here, has some amazing visual libraries. You're quite likely to find what you envision there, MathewMunro.
Having said that, the problem with clouds is that most people's eyes are not apt (or trained) to changes in dispersion (at least not as clearly as solid lines). — Guarapiranga☎ 05:21, 21 May 2022 (UTC)[reply]
What is the LOESS smoothing (if any) setting used on the current graph? (8:30 am, 22 April 2021 UTC) I think whatever settings/software currently being used to generate the trendlines, they don't provide an accurate depiction of the trends in voting intention.
To illustrate my case, look at the early months of 2020 (Jan-2020 to Apr-2020). Labor (red) was clearly ahead in the 2pp for all of these polls, yet the trendline "smooths" them out to put the Coalition (blue) ahead:
It isn't just one anomalous period. During the latter half of 2020, polling mostly showed the Coalition ahead, with only a few polls showing Labor ahead. Instead of smoothing this out in some way or another, the current trendline as of 8:40 am, 22 April 2021 UTC shows massive swings in the 2-party-preferred voting intention, like some kind of moving average? Or assuming that the polls showing Labor must showing a swing to Labor, instead of such results simply being part of the random chance inherent in opinion polls?
That's not to mention the fact that the trendline seems to place disproportionate weight on the most recent result (often producing the impression of massive swings simply so it can fit that last datapoint on the trendline), which really isn't accurate when you consider that we're not even at the election yet. I personally was happy with Canley's poll summaries, which seem well-tailored to the Australian polling seen and whose trendline settings seem to appropriately fit the trends seen in polling at any given time.
Considering the inaccurate representation of polling trends produced by the current graphical summaries, I would like to suggest that we revert to using Canley's graphs both on this page and the Next Australian federal election page if they're willing to continue to update them. Arachnus64 (talk) 09:07, 22 April 2021 (UTC)[reply]
I much prefer Canley's graphs. The current one has gigantic swings for outliers and minor changes. Previous talks on this page have said Canley's graph is the one that should be used. If other editors agree for it's reinstatement, I'd suggest adding a note saying to not change the graph without getting consensus on this page. Catiline52 (talk) 23:54, 23 April 2021 (UTC)[reply]
I've reverted the graphs to the previous ones. The Chart module is great for regular polls from a single company like in Tasmania. It doesn't seem to be using LOESS local regression, and looks like some kind of local Bézier cubic spline interpolation, which doesn't appear to work well for a point cloud kind of scatter plot like this. --Canley (talk) 23:36, 25 April 2021 (UTC)[reply]
I think that the current table design does not look very good, and it can be hard to follow and track the data. I suggest you look at Opinion polling for the 44th Canadian federal election's table, I think that table looks much more organised. Most of the other opinion polling pages on Wikipedia also use a similar design in tables, so if we change to that type of design, it'll also look more consistant. — Eric0892 (talk) 00:25, 16 June 2021 (UTC)[reply]
If someone could add those to the graph and table that would be great.
On a related note, surely there's an easier way to make these graphs than running a piece of software from github. I don't want to have to download software to contribute here. Can we use embedded graphs?
@DiamondIIIXX: If you want to produce your own charts, you don't have to download anything – you can download just the data if you want, or just copy it from the tables here (although as you say the last quarter's Essential polling is missing), but in terms of software you don't have to use the R script, you can use whatever you want such as Excel or Python. You could use the embedded graphing module in MediaWiki (which is used for the PPM charts) and we did for a while, but as discussed above the trendline is a messy Bezier spline and consensus was the LOESS regression smoothing in the ggplot charts was preferred. I've added the Essential 2PP+ values to the voting intention charts, but you can certainly add the PPM data to the table and their charts as these editable directly in Wikipedia. --Canley (talk) 04:22, 13 November 2021 (UTC)[reply]
I wasn't talking about making my own charts, only on improving the ones here.
I saw you updated the github and image but not the table?
I had a little play with using the included charts in wikipedia, and found this one - https://en.wikipedia.org/w/index.php?title=User:DiamondIIIXX/2&oldid=1054989230 - using basis-open for interpolation - seems to be decent. Considering it would be much easier to update, it could be worth using this style of graph instead of the ggplot one for the 2PP? DiamondIIIXX (talk) 05:19, 13 November 2021 (UTC)[reply]
The chart module is definitely easier for anyone to update, as I said in the discussion above, but the interpolation/smoothing is still pretty awful even with the basis-open setting (and it's only slightly different from the existing PPM chart). If that can be improved to use a moving average or LOESS I see no reason not to switch to those, but as per the discussion above, the interpolation methods used in these modules are not satisfactory or useful, and do not work well for high-volume point cloud style data like this (but they work great for infrequent polling by a small number of pollsters like 2022 South Australian state election). --Canley (talk) 05:57, 13 November 2021 (UTC)[reply]
@DiamondIIIXX I'm of the opinion that the trendline in the Wikipedia chart module (as well as the design in general) produces an inaccurate graphical summary of published opinion polling.
Firstly, it uses solid dots. This is minor, but it conveys an inaccurate picture of opinion poll results by making it harder to determine what the polling consensus is at any given time. For example, if there's three polls all saying Labor 51, and one poll saying Labor 54, the solid-point style of the Wikipedia chart module makes it look like there's only two polls, one saying 54 and the other saying 51. In contrast, the translucent-point style used by Canley makes it easier to tell if multiple polls are reporting similar figures or not.
Secondly, the Wikipedia chart module's trendline function is godawful. Trendlines need to do two things:
1) convey an accurate depiction of the trend at any given time - so for example if there were four polls over a couple months all showing Labor ahead and no polls showing the Coalition ahead, the trendline should show Labor ahead for that timeframe.
2) smooth out outliers and anomalies in the data. For example, if I had four consecutive polls with the results being Coalition 52, 53, 49, 53, the trendline should not jump from ~52 to 50 and then back to 53 again. The reasoning here is that the 49 is most likely an outlier (unless you have data from other pollsters to prove there was a drop in Coalition voting intention during that timeframe) and hence should be smoothed out.
The Wikipedia chart module's trendline function completely fails on both counts. If you scroll up to the "Trendline used in the graphs" section, you'll see how 1) the Wikipedia trendline doesn't seem to fit the data very well, showing the Coalition ahead even when all available polls show Labor ahead, and 2) how the Wikipedia trendline produces sharp swings in response to outliers (this is also evident in the graph you shared).
There's also the fact that the trendline, for some reason, insists on fitting the first and last points used in the dataset. For example, let's say the election was held on 15/May/2022, and we have 5 polls. Four of these polls were conducted on 13/May/2022, and showed the Coalition ahead 52-48. The last poll was conducted on 14/May/2022, and showed Labor ahead 52-48. The trendline would force the spline to go through the Labor 52-48 poll even though any reasonable interpretation of the polls would be "Coalition mostly ahead with one outlier" (and a simple polling average would show something like Coalition 51-49). This portrays an inaccurate graphical summary of the polling.
I understand your concern about allowing others to contribute without downloading software. However, until LOESS regression or other similar trendline functions become more widely available, some statistical software will have to be used to produce graphs with quality trendlines. It's unfortunate, but I don't think we can use more commonly available software like the Wikipedia chart module (or even vanilla Excel) without producing charts with trendlines which do not accurately reflect the polls.
I will also note with regards to Canley's script specifically - R and RStudio are both free and open-source software packages. So it's not like people have to buy proprietary software to be able to edit the graphs and contribute if they wish. Hence, I don't think it's a particularly excessive burden especially when you consider the quality and accuracy tradeoffs mentioned above. Arachnus64 (talk) 03:10, 19 November 2021 (UTC)[reply]
@Arachnus64 I did manage to fix the "first and last points" problem by using basis-open for interpolation, which I wrote up above, it gives a better line but I can see your point.
It's a shame wikipedia doesn't have a better graph interpolation.. DiamondIIIXX (talk) 04:27, 19 November 2021 (UTC)[reply]
Macron claim that Morrison lied and its relevance to voting intention[edit]
Macron's statement that he knew Morrison had lied was inserted into the article timeline, removed by an IP (unexplained), restored by me, and now removed on the basis that "No substantial news coverage about how a French PM's views affected the vote. Heavy coverage of vaccination, bushfires, and AUKUS however". But this is not accurate. A quick search located the following news articles that cover this issue extensively: [1][2][3][4][5]. Seems substantial to me. Peacemaker67 (click to talk to me) 23:35, 26 November 2021 (UTC)[reply]
Lots of coverage; after Macron said "I don't think, I know", many media outlets had cover for calling Scott Morrison a liar and now many articles exist about the political impact of this statement. Along with this example and the links you listed I think it's fair to include it as a "political influence" on the polling in the chronological list of poll results. DiamondIIIXX (talk) 02:33, 6 December 2021 (UTC)[reply]
It is not an issue of whether it affected Australian politics. The issue here is: if we start adding news events, where do we stop? This is a type of sorites problem in which we have no firm criterion to say what's strongly influential and what's not. There is no well-defined boundary. And if there were, it would be WP:OR for Wikipedia to express it.
Other events should be added in the "YYYY in [country]" articles linked above, but for some reason the practice didn't spread to the Australian page, so I've just added it.
The custom on other pages is to keep it minimal. The United Kingdom article (see discussions in 2015, discussions in 2017) adds just three types of events: new party leaders, other elections, and nationally disruptive events (such as a terror attack, or a nationwide lockdown).
Interesting that you removed only the Macron line, but not any of the others that don't meet the types of events you outline. At this stage, the weak consensus is to retain that specific line, and there is no requirement to slavishly follow the British version, or that it is better or more useful to readers. Of course, you could start a RfC to resolve the difference of opinion. Cheers, Peacemaker67 (click to talk to me) 22:38, 13 January 2022 (UTC)[reply]
You don't have to assume bad faith, indeed all of these events should be moved to 2021 in Australia. I thought I could replace the "X called Y a liar" by the AUKUS pact, but these events were in fact six weeks apart, so I removed this obvious piece of editorializing to see if there would be any reactions.
If you scroll through the 2015 debate on the UK page, you'll see that the Australian page was said to include no events at all.
It makes sense. This isn't just a custom for the UK page, but for all polling pages, because you quickly end up with a logical limitation to draw a line between what's influential and what's not. What's next, the showdown with Djokovic? As Bondegezou would certainly say, this is a list of pre-election opinion polling, not an essay.
One reason not to include such commentary is because it is WP:SYNTH. By including such lines, the article is asserting that they have some impact on polling, but where are the citations demonstrating this? Editors cannot just claim it has influence on polling off their own bat: WP:V always applies.
If you want commentary about the polls, that can be dealt with in some narrative text around the table of polling. Bondegezou (talk) 10:25, 14 January 2022 (UTC)[reply]
I'm inclined to agree with the comment above—these events listed in these rows were previously limited to changes of party leadership (probably beginning when Australia went through a spate of leadership challenges from 2010) which could pretty demonstrably have a dramatic effect on polling and I would suggest would be worth noting to explain sudden shifts. However this seems to have evolved into other events (as party leaderships became more stable perhaps), and started including other arguably notable events, but I agree that other events (even if references can be found which suggest an effect on polling) such as Macron's comments, vaccination milestones or Novak Djokovic could easily be considered subjective and selective. --Canley (talk) 11:24, 14 January 2022 (UTC)[reply]
Hardly, for example, this article in the SMH specifically references the link between the declining Resolve survey results on Morrison's leadership and Macron calling him a liar. There are other examples. Peacemaker67 (click to talk to me) 22:44, 15 January 2022 (UTC)[reply]
I don’t see a consensus for this significant expansion of commentary rows, so I’ve chopped them. Bondegezou (talk) 09:29, 16 January 2022 (UTC)[reply]
I think discussion is warranted, rather than deletion and reversion. I don't find practices on other similar opinion polling articles a compelling argument for some sort of purist approach where only leadership changes are included, every country has a unique political system with its significant events. If there is a dispute here which cannot be reconciled, then an RfC may be appropriate to get a wider community view. Peacemaker67 (click to talk to me) 23:48, 17 January 2022 (UTC)[reply]
There has been some discussion. I don't see much support for these commentary rows; I do see opposition to them. Further discussion is, of course, fine, but as per WP:BRD and WP:CONSENSUS, let's leave material out until such time as there is a clear consensus to return it. An RfC sounds like a great idea, go for it. Bondegezou (talk) 11:45, 18 January 2022 (UTC)[reply]
The more I thought, the more I felt an RfC was needed, so I've just gone ahead and started an RfC! See below. Bondegezou (talk) 11:56, 18 January 2022 (UTC)[reply]
In the latest newspoll labor were 38 and coalition 36 for first preferences but on the graph the values are swapped with coalition ahead 2001:8003:942F:B400:9130:9A76:4946:84C7 (talk) 05:50, 6 December 2021 (UTC)[reply]
Thanks, I've fixed it. --Canley (talk) 06:35, 6 December 2021 (UTC)[reply]
Changing the Approval/Preferred Prime Minister graphs[edit]
Given that there appears to exist a consensus on using Canley's graphs for the primary vote and 2pp voting intention, I'd like to suggest that we also replace the graphs for approval rating (both Prime Minister + Opposition Leader) as well as for Preferred Prime Minister with ones created by Canley (if they'd be willing to create code to do so). Arachnus64 (talk) 07:35, 25 December 2021 (UTC)[reply]
Should the table of polling results include rows commenting on particular events, e.g. the row that says, "31 October 2021: French President Emmanuel Macron calls Scott Morrison a liar", as has been being discussed above? The obvious options are No, Yes minimally (only changes in party leaders and election results) (as was the model being used) or Yes maximally (commentary on many events) (as with the current version of the article). Editors may wish to add other options.
If yes to the last of those options, what items should be included and how should this be determined? Options here might include Any items receiving considerable RS coverage or Any items where RS discuss how the event may shift polling or Any items where RS say the event shifted polling. Again, editors may wish to add other options. We can presume that normal rules, WP:CONSENSUSetc., would apply. Bondegezou (talk) 11:55, 18 January 2022 (UTC)[reply]
No or Yes minimally (party leaders/by-elections). There are polling articles for most democracies. Most of them do not have any commentary rows: see Nationwide opinion polling for the 2020 United States presidential election, Opinion polling for the next German federal election, Opinion polling for the 2022 French presidential election, Opinion polling for the 2019 Indian general election and many, many more. In UK articles, changes in leader and other elections are included, but there's no running commentary on other events, even when they are having a significant impact on polling (as with the current Partygate): Opinion polling for the next United Kingdom general election. New Zealand articles are similar, but go slightly further with a few other very significant events, but still not on the scale of what is currently done here: Opinion polling for the 2020 New Zealand general election. I see no good reason why this article should be so different. There are good reasons against this sort of commentary, namely that it's WP:SYNTH. The inclusion of an event is an editorial decision that a particular event warrants noting and that others do not. We should steer clear of such editorialising. (If people really want commentary rows, they should have clear sourcing that they impacted on polling.) Most events make no impact on polling: the table shows no shifts in polling associated with most of the commentary rows. If people want a timeline of events, they can use something like 2022 in Australia. If people want to comment on how polls have gone up and down, they can use some narrative text after the table (with appropriate sourcing). Bondegezou (talk) 12:10, 18 January 2022 (UTC)[reply]
No Doing so is asking for endless debate on what should be mentioned, etc. Adoring nanny (talk) 12:13, 18 January 2022 (UTC)[reply]
Absolutely no. This is a recurrent debate in opinion polling articles, and it comes mostly because at how things were initially done at UK opinion polling election articles (with users typically adding whatever events they thought as of relevant, and others simply mirroring this behaviour for other countries). It should be noted, first and foremost, that opinion polling tables are not meant as listings of events. Adding events into opinion polling tables basically makes an editorial decision that such event has an impact and/or is relevant to opinion polling, which is, most of the time, a very difficult (if not outrightly impossible) situation to prove: opinion polling tends to be influenced by many events, sometimes by a chain of them, and many times their impact cannot be ascertained until weeks or even months later (at which point, subsequent events will have taken place that may have made the initial changes moot). It would also force us to determine what should be deemed as a "reasonable" polling impact for an event to be included (the discussion on the "Macron calling Morrison a liar"-event is very descriptive of this rather pointless debate), including the duration of such impact as well (a one-point variation in one poll would be enough for an event to be added? A ten-point variation over a ten-week span? What should be considered as having an "impact"?). Because of this, it should be left to the readers' themselves to reach such conclusions if they want, not for us to pre-establish what influences polling and what not. Using pages such as 2022 in Australia to list such events and making the link to such article available above the tables would be a solution much more respectful with Wikipedia's policies and guidelines and, in particular, avoid WP:SYNTH and WP:NPOV issues. Impru20talk 12:29, 18 January 2022 (UTC)[reply]
No, most of the points I wanted to contribute have been covered by previous editors! There were some extremely major events, such as the 2020 bushfires and the parliamentary sex scandals, which could have sourcing that it may have influenced voting behaviour. However, it'd be potentially misleading to argue or hint that these events definitely caused changes without solid sourcing. It'd be simpler to just list opinion polling. Catiline52 (talk) 14:03, 18 January 2022 (UTC)[reply]
No (invited by the bot) First, the article should stick to it's title. Second and third, this would make it a coatrack for all kinds of politics. Next editor-selected inclusions are going to be uninformative, except for being an update on who is winning at the resultant eternal wikilawyering debate at the article. North8000 (talk) 14:46, 18 January 2022 (UTC)[reply]
No, for the reasons stated above (the talk section before this RfC). Kahlores (talk) 19:32, 18 January 2022 (UTC)[reply]
With the lack of a single yes vote, I now have some empathy for Peacemaker67. Let me tell him I fully understand the intent, which is to help analyze trends, and I may myself have indulged in adding one or two events years ago, until I found a more neutral way by providing readers links to "Year in Country" above. That said, it should not refrain anyone from creative attempts to neutrally assess the possible factors behind polling trends. For instance, we might plot keyword trends in political news--up for anyone to correlate. But sadly, as far as I know, there's no secondary source we could use for that. Kahlores (talk) 19:32, 18 January 2022 (UTC)[reply]
That may point to having to decide what the topic of the article actually is which might be:
The polls themselves (the literal title). Who is doing them, what is their methodology etc.
The poll results
That which is being measured by the polls. Political and voting sentiments that are relevant to the election.
Sincerely, North8000 (talk) 19:48, 18 January 2022 (UTC)[reply]
Opinion polling before elections may be very extensive in some surveys and overlap broader social debates. So we may also have a sorites problem here: where to draw the line. Indeed, some of the surveys most relevant may be done on election day or right afterwards, and I think we should include these. There are also very interesting polls on social issues, but Wikipedia can include them in specific articles; we should restrict this one to partisan politics.
What few people know is that only a fraction of the polls conducted are being published. Some surveys ask questions that are spinned to create the desired number and partisan media coverage. We should avoid to include these and focus on regular polling.
If you want to include broader political polling, the UK articles do that. However, Wikipedia does not allow WP:OR interpreting polls. If editors want some discussion of polling trends, that could be done with a text section before or after the table, using WP:RS. Bondegezou (talk) 21:53, 18 January 2022 (UTC)[reply]
Yes maximally (commentary on many events). Require political events to have 3+ reliable sources covering the topic, cited inline. Each event, if opposed could be discussed on the talk page, and determined by consensus. Having these events in the chronological polling order is important as it gives context to the numbers. DiamondIIIXX (talk) 22:47, 18 January 2022 (UTC)[reply]
Let's put up a practical example: "Morrison sneezes so strongly he hits his head against a wall". An event which is cited by at least three sources; in a poll conducted shortly afterwards, the Lib/Nat coalition increases its support by three points (unsure whether there is a direct implication, maybe it's just an outlier within the statistical margin of error, but hey, this increase did indeed happen after the catastrophic sneeze). Would this "give context to the numbers"? Repeat this thinking with every possible event and situation you may think of: the Lib/Nats propose X, Labor does Y, a fly in Ireland is reported as starting speaking out loud and insulting Morrison, etc. What "helps give context to the numbers"? Do we really need to come to the talk page to waste everyone else's time and efforts to discuss every event for an article which is definitely not about events?
You can accomplish the same through the use of pages such as 2022 in Australia, listing all relevant events in the country there and leaving the readers themselves to reach their own conclusions on whether those "give context" to the numbers or not, rather than editorializing and cherry-picking it ourselves. Impru20talk 06:21, 19 January 2022 (UTC)[reply]
For many years I have seen absurd events being added into opinion polling tables across Wikipedia on the basis of "providing context". Indeed, the example I bring forward is an extreme one, but not a "strawman". I am asking you what would you do in such a situation; maybe it won't happen with "Morrison sneezes so strongly he hits his head against a wall", but it has happened with "Macron called Morrison a liar". You indeed do not refute that this would indeed be an enormous waste of time and effort for everyone involved, nor that using 2022 in Australia-like articles for listing all events would be a better solution. The point of the argument is very clear, I think. Impru20talk 09:15, 19 January 2022 (UTC)[reply]
Charles VIII of France died in 1498 after accidentally striking his head on the lintel of a door at the Château d'Amboise. Kahlores (talk) 10:18, 19 January 2022 (UTC)[reply]
To try and make the discussion more concrete... DiamondIIIXX, when you say Require political events to have 3+ reliable sources covering the topic, do you mean 3+ RS saying the topic happened (e.g.George Christensen resigning from a Parliamentary committee recently would count) or 3+ RS saying the topic may, or has, affected polling? Bondegezou (talk) 15:40, 19 January 2022 (UTC)[reply]
Wouldn’t that lead you to a commentary row practically every weekday? Bondegezou (talk) 23:22, 19 January 2022 (UTC)[reply]
Currently there are 11 "important events" spread across 2 years and 8 months, or 979 days. That's an average of 89 days between events. So far, these events cover: 3 New Leaders, (political), Bushfire (political (Climate Change)), Pandemic (political), Sexual misconduct allegations in the parliament (political) (twice), International defense agreements (political), International leader commentary (political + local response), Pandemic vaccine (political), Opposition Climate targets (political).
If there was nothing obviously politically relevant it would have been removed already, as part of upkeep. DiamondIIIXX (talk) 01:15, 20 January 2022 (UTC)[reply]
There was an attempt to remove 1+ rows, which led to a long discussion that was never resolved, which led us here. Bondegezou (talk) 12:48, 20 January 2022 (UTC)[reply]
Yes minimally: Include information such as a party leader stepping down or getting caught in some kind of big scandal or some event of national political importance happens (hopefully doesn't), like declaring war or any terrorist activity. Other than that nothing should be included, scandals by individual MPs or someone calling someone a liar or anything like that will be offtopic and will not be encyclopedic enough to be added here. Cheers! ---CX Zoom(he/him)(let's talk|contribs) 15:05, 20 January 2022 (UTC)[reply]
Yes minimally I think changes in party leadership are especially relevant, maybe other very significant political events, but this page does have too much. Reywas92Talk 22:05, 24 January 2022 (UTC)[reply]
No or yes, minimally, per the above. (All my arguments about this have already been stated by others pretty concisely.) — SMcCandlish☏¢ 😼 14:14, 25 January 2022 (UTC)[reply]
Yes for any event that has its own article – Any event notable enough to have its own article (e.g. leadership spill, the bushfires, the Jenkins report, so on) can be assumed to be important enough to have an effect on public opinion. 5225C (talk • contributions) 09:55, 29 January 2022 (UTC)[reply]
I don’t think that’s workable. You’d still need to determine what’s political. So, Adass Israel School sex abuse scandal has an article and is in the 2021 in Australia article, so would you include that? And what particular date would you pick? Bondegezou (talk) 22:59, 29 January 2022 (UTC)[reply]
It has been more than 2 weeks since the debate began. I count 2 yeas absolute or maximal, 5 absolute nays (not specifying about the handful of events customarily added), 4 nays/yeas minimal (the custom). Kahlores (talk) 21:45, 1 February 2022 (UTC)[reply]
As per WP:RFCEND, we can just decide among ourselves that we've come to a conclusion, or we can post a request for closure at WP:CR. (Or we could ask for more input with a neutral message on some appropriate WikiProject.)
It seems apparent to me that the maximal approach has been firmly rejected and we could just delete those rows now. What seems unclear to me is whether we go to a minimal approach (leadership changes + by-elections) or whether we go for no commentary rows whatsoever. Bondegezou (talk) 11:42, 2 February 2022 (UTC)[reply]
Done Since we have a consensus to remove the non-customary events, they were moved to 2021 in Australia, including: Macron's criticism; the sexual misconduct investigations (opening, and report); the 80% vaccination target reached; the new Labor policy goal to cut emissions. Kahlores (talk) 23:25, 2 February 2022 (UTC)[reply]
I've kept the party leader changes, as well as one nationally disruptive event: the COVID-19 national emergency declared on 27 February 2020. That said, the real disruption was the lockdown which started in most areas on 23 March 2020. And about any reader who will read this is supposed to know what occured worldwide in early 2020, so this would make the case for removing the event as well. Kahlores (talk) 23:25, 2 February 2022 (UTC)[reply]
Given the above rough consensus, I don't think the debates should really be included. Thoughts? Peacemaker67 (click to talk to me) 10:42, 9 May 2022 (UTC)[reply]
There appears to be a error with the graphing for the 2 party preference, they polled others as 16% and 17% respectively, but are but under 15% in the graph. 172.197.101.1 (talk) 00:43, 21 January 2022 (UTC)[reply]
OK thanks, it was the Primary vote graph not the two party preference one, but I see what you mean and have fixed those issues. --Canley (talk) 03:46, 21 January 2022 (UTC)[reply]
Is this credible? LNP on 23% primary vote? This poll hasn't been included in this series up to now, should it be? Peacemaker67 (click to talk to me) 06:45, 23 January 2022 (UTC)[reply]
The poll is done through an opt-in survey for specifically Australian election polls, unlike reputable polling companies. This means although there is a higher sample size, it's highly biased towards people who share the poll on Twitter and sign up like-minded people. It results in substantially higher Labor / "Voices Of" supporters than most other polls. Also, unlike other minor polling companies such as Redbridge, the results are never really reported on by journalists due to the questionable methodology of the polls. Even independent sources such as Poll Bludger don't include them. I don't think KORE should be included due to them not fitting WP:RELIABILITY. Catiline52 (talk) 06:58, 23 January 2022 (UTC)[reply]
Actually the results are often reported, particularly in the AFR and by AAP - and it uses 4 different sources or participant recruitment, as it clearly says at the top of each poll result post, and the numbers are comparable with other polls, so the claim of higher Labor/'voices of' supporters is obviously bogus. 2001:4479:1C00:E400:3055:C6B0:CFB0:C34A (talk) 21:03, 26 March 2022 (UTC)[reply]
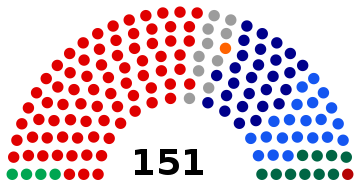
The projected result by the ABC, 23/May/2022:
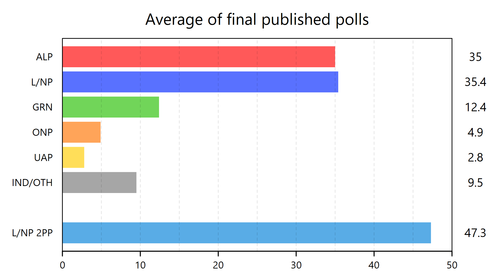
Average of the final-week polling:
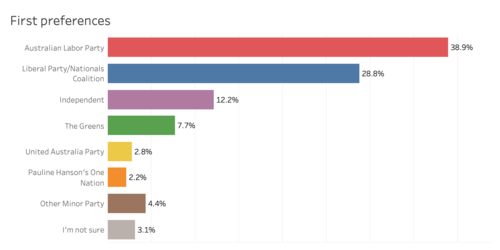
First-preference votes from the last (mid-March) KORE poll:
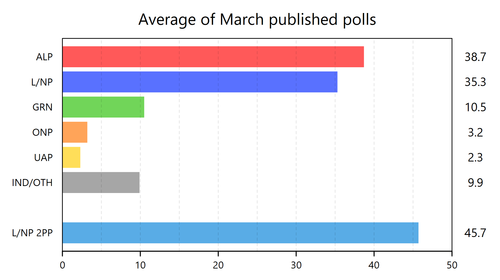
Average of first-preference vote shares from public, non-opt-in pollsters in mid-March:
All the data in my averages is from the polls archived on this page. On this basis, I think it's very clear that the KORE poll over-estimated the Independent vote as expected by the experts cited below and based on how they tracked relative to other pollsters. When the Independents' voting intention is combined with other minor parties and undecideds excluded to make it an apples-to-apples comparison with other pollsters, the OTH in the mid-March KORE would be 17.1 versus 9.9 for other pollsters. There was also a large under-estimate of L/NP voting intention - 29.7 once undecideds are excluded, again to make it apples-to-apples comparison with other polls. In contrast the polls were pretty accurate on the L/NP vote even a couple of months out. Additionally both public polling and KORE over-estimated the Labor vote; however the KORE poll did so by more (again as expected).
On this basis I think the claim of "higher 'voices of' supporters" was accurate, and there was a small over-estimate of Labor but a big under-estimate of Coalition-intending voters. Hence, I think they do indeed fail to fit WP:RELIABILITY given the criticism by poll experts and the errors seen at this election. Arachnus64 (talk) 05:28, 23 May 2022 (UTC)[reply]
I second Catiline52 on this. Opt-in polls are historically less reliable than traditional opinion polling because they are subject to worse response bias (Jacob Sohlberg, Mikael Gilljam & Johan Martinsson (2017) Determinants of polling accuracy: the effect of opt-in Internet surveys, Journal of Elections, Public Opinion and Parties, 27:4, 433-447, DOI: 10.1080/17457289.2017.1300588).
It's particularly bad for KORE, because their panel recruitment methodology is basically being shared on social media. This means that one or two influential social media users can completely mess up the results by sharing it to their followers (who may lean one way or the other), or sharing it with an attached message (e.g. "go give the government a kicking!", "go show your support for our PM!"). With this specific poll (the 17/Jan/20222 one), we know that this almost certainly happened because of the sheer number of comments on Twitter 1] mistaking this for a poll by the Coalition (e.g. https://twitter.com/GeoffSpinmonkey/status/1484688763603529728) and 2] using it to "send a message" to the government. The pollster has claimed that 176 responses who said they believed the poll was for PM Scott Morrison were deleted; however:
a) Many respondents who come into the poll with that belief will not explicitly state so in their response
b) It is very difficult to differentiate between genuine respondents who dislike the government and respondents who do the poll solely to "give the government a kicking" (motivated response bias)
c) Even if everyone who came in with the false belief of the poll being a Morrison poll was successfully removed, it doesn't fix the problems with recruitment. Without a methods change, the poll will be heavily skewed by whichever party's supporters choose to retweet or share the recruitment link on their social media.
Taking all that into consideration, I would highly recommend removing the KORE poll from the dataset unless it changes its methodology. Arachnus64 (talk) 04:22, 24 January 2022 (UTC)[reply]
Given there has been no opposition to its removal, I've done that. But whomever does the graphs at the top may need to tweak them if they contain data from KORE. Cheers, Peacemaker67 (click to talk to me) 10:35, 25 January 2022 (UTC)[reply]
Morgan poll data, and separately-displayed parties/groupings[edit]
Someone seems to have gone through the Morgan poll data and attempted to split out IND, but placed the IND figures in the undecided (UND) column instead:
For reference, see the below screenshots from the most recent Morgan polls:
I'll try and fix up the changes, but I think we should consider whether we want to split out certain parties or groupings in the first place. e.g. UAP, Independents etc.
Additionally, many pollsters do report an undecided figure even if they don't "keep them in" as Essential does. We may also want to consider adding in an undecided figure for the other pollsters who report it (Morgan usually reports it in their poll report, Newspoll does so in their Australian Polling Council disclosures). Arachnus64 (talk) 23:45, 22 February 2022 (UTC)[reply]
Apologies. I mistook UND for IND.
The reason I delved into the Roy Morgan polls is because I found the "19% others" particularly high and wondered which minor party not included in the table is driving that surge.
It turns out, independents take almost half of that number, and the next minor party is Palmer's UAP at around 1.5%.
Which means that there is no nationwide surge for another party. I now understand why they were tallied together.
That said, some opinion polling pages on Wikipedia detail the remaining parties' numbers using footnotes. See this page for instance. It could be used if a party's nationwide numbers become noteworthy (say, at or above ON's levels).
With multiple polling companies now including independents separated from 'other', and an increasing prominence of independent politicians, should we consider a dedicated column for independents? They would likely need to be included in the 'other' in the graph, as not every polling company includes them, but it would help explain why some polls have higher non-major party votes. Catiline52 (talk) 01:54, 24 February 2022 (UTC)[reply]
Agree, this could help when making comparisons between different pollsters. But will anyone take the time and effort to find all of the numbers for the whole 2019-2022 period? We could at least agree on providing those details for the next Parliament. Kahlores (talk) 23:38, 26 February 2022 (UTC)[reply]
I was going to say the problem is that Newspoll were not splitting UAP out from the Others, but they now are and their polling is higher than One Nation, so I agree, if the other polls are listing them they should probably be listed (although only with recent polls where their polling figure is given. --Canley (talk) 10:55, 27 February 2022 (UTC)[reply]
Agreed that the UAP should be included in it's own section. To simplify the change, should we make each year of polls it's own subsection (eg 2019, 2020, 2021), similarly to the UK elections? This'd stop a long line of blank sections for the polls before the UAP were polled, and help the long list become more readable. Catiline52 (talk) 02:10, 1 March 2022 (UTC)[reply]
The circled area shows what I believe are "interpolated"? values from the polls with undecided voters? Their inclusion is distorting the graph, as none of the recent polls without undecided have gone near 50-52% for Labor. @Canley @Catiline52DiamondIIIXX (talk) 22:57, 9 March 2022 (UTC)[reply]
Yes, the methodology for displaying the Essential "2PP+" data is discussed above, which is to exclude the undecided voters and allocate the decided ones to the same 2PP ratio (which is essentially what the other pollsters are doing, calculating a 2PP for decided respondents only). While it would be easy to exclude Essential entirely from the chart and smoothed trend line, they are very proud of the 2PP+ formula and assert it is more accurate, so why should it be excluded because their 2PP ratio is usually closer (and, it could be argued, more realistic) than Morgan and Newspoll? Including the raw 2PP+ values will truly distort the chart to an asymmetrical mess. Any different polling methodology is going to add or reduce some amount of bias which is why multiple polls are being smoothed like this (also to reduce statistical "noise")—asserting it is "incorrect" because one is consistently different is a bit of a stretch in my opinion, but if there's consensus to remove Essential or concerns about how their 2PP ratio is calculated (for example, the Essential figures often don't "add up" to 100% when the undecided voters are included) I can remove them. --Canley (talk) 02:04, 10 March 2022 (UTC)[reply]
Can also do several versions with and without Essential "distorting" the trend, if that's what people want to see or have the option to choose between (probably wouldn't include them all). --Canley (talk) 02:07, 10 March 2022 (UTC)[reply]
I disagree with including the raw values as it's not a complete dataset. I am in preference of removing all polls with undecided voters DiamondIIIXX (talk) 21:10, 10 March 2022 (UTC)[reply]
I personally agree with simply "dropping" the undecideds as @Canley is currently doing.
Firstly, it's exactly the same thing that other pollsters are doing. For example, the latest Newspoll methodology statement says "Undecided respondents who answered “don’t know” were asked a leaner question which also included a “don’t know” option. Those who answered don’t know were excluded from published voting intention figures but not from the survey. 7% were thus excluded from published voting intention figures" (emphasis mine). This is no different from simply assuming the undecided will split the same way on 2pp as the decideds.
Secondly, splitting out the undecideds has no impact on the 2pp lead suggested by Essential. As an example, given a 7% undecided rate for the 14/March/2022 Newspoll, they could've reported the 2pp as being 51-42-7 - which would still translate into a 55-45 lead once the undecideds were dropped. Instead, the reason why Essential shows such narrow 2pp leads is because it has smaller Labor leads on the primary vote. For example, the Labor - L/NP primary margin for the last four Essential polls have been +1, -1, +3, -2. On the other hand, Newspoll's Labor - L/NP primary margin is +6, +6, +7.
Given that Essential is a certified member of the Australian Polling Council and provides methodology disclosures which give some insight into why it may be showing smaller leads (likely its weights, especially weighting by party ID), I don't believe it's appropriate to exclude it from the polling graph just because it's an outlier. As mentioned above, the inclusion/exclusion of undecideds in its report has no impact on the size of the 2pp lead produced. Since another pollster removes undecideds the same way @Canley is currently doing (Newspoll) and is reporting larger leads, excluding Essential would amount to attempting to remove any outliers we think are "distorting" the graph and would open up a can of worms (e.g. is Resolve's high OTH distorting the OTH graph? Is Morgan's high GRN distorting the GRN graph?). Arachnus64 (talk) 05:54, 2 April 2022 (UTC)[reply]
Some poll numbers add to 100%, others don't. Are they on different denominators (i.e. % of all votes vs % of votes on the two main parties)? 144.132.223.90 (talk) 22:03, 23 April 2022 (UTC)[reply]
It's probably the Essential polls which include an undecided figure (e.g. ALP = 46, LNP = 43, undecided = 11). However sometimes the declared Essential undecided percentage and the 2PP percentages do not add up to 100% – not sure why, probably some issue with rounding. --Canley (talk) 05:44, 24 April 2022 (UTC)[reply]
Ah, right! Hadn't noticed the UND column (was on my phone). I can see you've corrected for that on the charts already. — Guarapiranga☎ 23:50, 24 April 2022 (UTC)[reply]
Graphs should reflect different sample sizes...[edit]
... by varying bubble sizes and weighing local regressions accordingly, as a matter of WP:WEIGHT. — Guarapiranga☎ 22:17, 23 April 2022 (UTC)[reply]
OK, I've tried that. See what people think. --Canley (talk) 05:46, 24 April 2022 (UTC)[reply]
My suggestion is that we weight by the square root of the sample size. This is due to the formula for theoretical standard error being sqrt((p*(1-p))/n) where p = proportion of voters expressing support for Party X and n = sample size. Hence accuracy should increase as a function of sqrt(Sample Size). Arachnus64 (talk) 09:03, 24 April 2022 (UTC)[reply]
Yes, the weighting is the square root of the sample size. --Canley (talk) 23:46, 24 April 2022 (UTC)[reply]
Awesome! Love it. Thank you — Guarapiranga☎ 23:00, 24 April 2022 (UTC)[reply]
Are you sure about the LOWESS on this part of the chart...[edit]
... Canley? How can the bubbles be all on one side of the trend? (the fat ones at least)
Or are you plotting the bubbles excluding the undecided votes, and the trend including them?
No, the bubbles and the trend line both exclude undecided votes. One thing to note is the weighting in the local regression is the square root of the sample size but the bubble size weighting is not, although this actually doesn't make much difference. I think the issue is the scaling of the bubbles might be a little misleading by making the larger weighting look like more than it is, and it's actually the low 2PPs for the Essential polls which is dragging the line down – even though their sample size is small (about 1000) they are quite frequent and consistent. If Essential are removed entirely, the line goes through the middle of the larger bubbles, which is why I think it is these that are pulling the trend line down. --Canley (talk) 13:48, 8 May 2022 (UTC)[reply]
And incidentally it is precisely the Essential (and Ipsos) polls that split 2PPs into the 3 buckets--ALP, LNP, Und--are they not? If when Essential are removed entirely, the line goes through the middle of the larger bubbles, it seems very likely you're forgetting to normalise the Essential (and Ipsos) data (dividing by the % of decided voters), before feeding it all to the LOESS model.
As for the bubble size, are you scaling them by area or diameter? If you scale by area, then both the diameter and the LOESS weighting will be proportional to the sqrt of the sample sizes, right? — Guarapiranga☎ 01:27, 9 May 2022 (UTC)[reply]
The Essential and Ipsos polls are being normalised (the bubbles and weighting would be asymmetrical otherwise) before anything happens:
Good suggestion about the point scaling, I have changed the scaling to area, which looks a little more realistic: the smaller points (~1000 sample size) are now bigger and more proportional by area to the larger ones, which makes their influence on the LOESS weighting look more reasonable. --Canley (talk)
I don't quite understand your normalisation there, but if you're confident... We can't really offer you a 2nd pair of eyes until the day LOESS is added into Module:Graph (why shouldn't it? It's right there in Vega!).
Having said that, presuming undec is the % of undecided voters, shouldn't it be...
Oh wait, strike Ipsos. I now see they've already normalised the 2PP figures over decided voters only. That's why you said it's really just the Essential polls that make all the difference to the chart. Now I'm even more convinced there's something wrong with your normalisation, Canley! — Guarapiranga☎ 04:43, 9 May 2022 (UTC)[reply]
Your formula will work if undec is a decimal fraction (e.g. 0.06 = 6% undecided), but if that's the case then they are exactly the same.
Using the last Essential poll: tpp_lnp_raw = 45, top_alp_raw = 49, undec = 6
The Essential polls make a difference because they are so close to 50, like the 20 April one which works out to 49.5 / 50.5 [46/(1-0.07) = 49.46 and/or 47+(7*47/93) = 50.54]. I can't see anything wrong with the normalisation and the results are identical to your formula. --Canley (talk) 08:10, 9 May 2022 (UTC)[reply]
Your formula will work if undec is a decimal fraction Isn't it always? After all,
The Essential polls make a difference because they are so close to 50 Isn't that the case precisely bc they're reported over the total of voters instead of the total of decided voters like all the others?
Shouldn't the Essential polls be normalised on the table to be on the same basis and easily comparable to all others? (e.g. on that last one you mentioned, it would say Und=6%, LNP=48%, ALP=52%, instead of 6%, 45%, 49% respectively, as it currently does)
As you can see, mine uses 6 and yours uses 0.06. It works out the same because the total is 100−undecided, and you end up dividing the raw party score by 100/6 which is multiplying it by 6/100 = 0.06. Yes, the Essential polls are reported as a percentage of total respondents including undecided, but this is not why they are close to 50 when normalised, they are close to 50 because they are close already, like 46/47. The difference between Ipsos and Essential is that Ipsos reports the 2PP excluding undecided but Essential does not. --Canley (talk) 11:11, 10 May 2022 (UTC)[reply]
Oh wait (2!): Ipsos 30–2 Apr 2022 poll numbers are not normalised like on the other dates. How confusing! — Guarapiranga☎ 06:22, 10 May 2022 (UTC)[reply]
They were normalised when I added it, looks like it and another Ipsos got reverted with the comment "Stop messing things up. The 2pp vote has always included undecided voters." --Canley (talk) 11:11, 10 May 2022 (UTC)[reply]
Online tools for helping voters rank candidates[edit]
Australia's ranked voting, in spite of its theoretical perfections, is a bit of a nightmare for voters in practice. I'm surprised there aren't more sites helping voters rank candidates in accordance with their views (the only one I know of is ISideWith, which is still working in spite of seeming a bit derelict). What other such tools are there, and may they contain data worth reflecting on WP? (not WP:unduely on par with 'official' polls, of course). — Guarapiranga☎ 03:45, 9 May 2022 (UTC)[reply]
Can someone please pull back in the data for Sub-national polling (ie. polling by state)? It seems to have been removed in the past couple of days, and being new to wikipedia, I don't want to undo anyone else's hard work by attempting to do this myself. Thanks! — Preceding unsigned comment added by Sbutler44 (talk • contribs) 22:07, 11 May 2022 (UTC)[reply]
Exactly, I see no consensus to remove that data. Please reinstate it. Thanks, Peacemaker67 (click to talk to me) 00:21, 12 May 2022 (UTC)[reply]
Completely agreed! The Sub-national polling belongs on this page. VeryBoredAnalyser (talk) 03:29, 12 May 2022 (UTC)[reply]
No, the by state polling (polling for an entire state). It was in the earlier versions. SatireisUnderrated (talk) 21:51, 12 May 2022 (UTC)[reply]
Definitely not. Just reinstate it fully or I will revert you and you can do the clean up. You had no consensus for such a drastic change without discussion. Thanks, Peacemaker67 (click to talk to me) 23:06, 12 May 2022 (UTC)[reply]
At some point recently the tables changed from their old look to their current one, for an example of the old look at the equivalent page for the 2019 election. The current tables in my opinion don't make sense as it has the greens going first, other in the middle of the two major parties as well as not looking as good. Personally I am in favour of moving the table back to their old look. — Preceding unsigned comment added by VeryBoredAnalyser (talk • contribs) 12:01, 12 May 2022 (UTC)[reply]
I agree. We already have 2PP preferred to see how the preferences flow.
Also, Ideology isn't 1 dimensional. There are times the Greens vote with the Coalition and times One Nation votes with Labor. Micmicm (talk) 01:55, 13 May 2022 (UTC)[reply]
I proposed that change. Happy to change it back. The idea is precisely to be able to check the 2PP figures by simply eyeballing them on a spectrum (as I commented on the edit). Assuming mostly all Green votes end up with ALP, and mostly all One and UAP votes end up with LNP, if they fail to elect a 3rd party/indep candidate, a casual reader can simply eyeball the figures and see if s/he agrees with the 2PP projections. I, for one, am suspicious of pollsters who allocate Other votes half-half between ALP and LNP (like Roy Morgan), or even 2/3-1/3 to ALP and LNP respectively (like YouGov). — Guarapiranga☎ 07:13, 13 May 2022 (UTC)[reply]
Please could it be changed back? When I first saw the change I thought "What the…..!" It seems obvious to me that the two largest parties should be adjacent to one another, and the smaller parties follow after the first two. The TPP comparison does for the TPP comparison - there’s no need to have the Greens next to the ALP for that. And I also liked seeing One Nation and the UAP adjacent to the Greens, to compare those percentages. In other words, for me there are innumerable advantages to the way the columns had been ordered before, and none at all to the way it is now. Further, dare I suggest that a change as major as this should perhaps have been run past the Talk page first? Boscaswelltalk 02:49, 15 May 2022 (UTC)[reply]
I believe that the new design (with borders) is better, but the way the parties are ordered doesn't make sense. – Eric0892 (talk) 22:47, 15 May 2022 (UTC)[reply]
I agree that the changes don't make sense, are difficult to read, and aren't as visually appealing. Sbutler44 (talk) 01:37, 16 May 2022 (UTC)[reply]
I also think it should be changed back. Why? For example, the 2PP columns make zero sense, especially considering they include Undecided (UND), which for Ipsos polls, means that the totals are over 100% Sbutler44 (talk) 00:55, 16 May 2022 (UTC)[reply]
That I didn't change. But to me, it makes more sense to keep Ipsos figures as they are, perhaps making it clear the UND% is included in the ALP/LNP %s, as all other pollsters do (except Essential, whose figures should be put into the same basis as the others'; currently, they are incomparable). — Guarapiranga☎ 02:18, 16 May 2022 (UTC)[reply]
Wouldn't it make more sense to have two UND columns? One under Primary vote and the other under 2PP, making the figures clearer. Sbutler44 (talk) 07:47, 16 May 2022 (UTC)[reply]
Is that how the pollsters publish it? All we can do here is represent what they publish as WP:NEUTRAL and WP:VERIFIABLE as possible. The latest poll, for one, makes it clear they don't have an undecided category for the primary vote:
Because the Resolve Political Monitor asks voters to nominate their primary votes in the same way they would write “1” on the ballot papers for the lower house at the election, there is no undecided category in the results, a key difference from some other surveys.
If it's okay, could you please fix the undecided 1PP? You removed it and merged it with Other, when it's an entirely different metric (They're votes undecided, not for other candidates). Catiline52 (talk) 07:48, 18 May 2022 (UTC)[reply]
You removed it and merged it with Other
I didn't. I may have (mistakenly?) put it under the 2PP when re-reordering the cols, bc I understood that's what Ipsos and Essential, the only two pollsters that we have reporting it on these tables, meant by undecided (isn't it?). I certainly didn't remove or merge columns. — Guarapiranga☎ 09:14, 18 May 2022 (UTC)[reply]
Is that how it's meant to be? Either way, ALP+LNP should be 100% on all rows regardless (Essential's still don't). — Guarapiranga☎ 09:32, 18 May 2022 (UTC)[reply]
After all said and done, I noticed the col order I had proposed is precisely the same as in these parliament seat charts: — Guarapiranga☎ 06:19, 1 June 2022 (UTC)[reply]
I see you've updated your charts just 3 days ago, Canley, but their data seems stuck in mid April. I had a look at your data on GitHub, and I see it's up-to-date. Running both polling-graph-weighted and polling-graph.r scripts yielded the same charts you uploaded, but with warnings:
I'm betting these 11-12 rows comprise precisely the missing month (and you've got a nifty script that does this all automagically; hence why you didn't notice it). — Guarapiranga☎ 03:01, 17 May 2022 (UTC)[reply]
No, the chart does go to mid-May if you look closely at where the diagonal labels end (the last "column" is actually June 2022, I have tried a few things to get it to cut off at the end of May but with no success – I may be able to force this after the last poll when it doesn't need to "work out" what the end date is). I know what the missing values in the warnings are: they are Resolve polls which don't publish 2PP figures, so R removes the missing values (NA) when plotting the points and smoothing for the 2PP chart, which is fine as there is no 2PP data. --Canley (talk) 03:50, 17 May 2022 (UTC)[reply]
the last "column" is actually June 2022
Aha! I thought the labels were for the tickmarks, indicating the beginning the month, as spreadsheets generally do, not the columns. All good then. Cheers. — Guarapiranga☎ 04:00, 17 May 2022 (UTC)[reply]
I couldn't find them anywhere. Are on the same basis as the polls? Do they refer to total (2PP) party vote, or to seat %s? — Guarapiranga☎ 00:13, 24 May 2022 (UTC)[reply]
If you're asking about the current election, the 2PP count from the AEC is at the bottom of this page. It's the percentage proportions of the total of all the 2PP counts conducted so far (and the AEC will eventually go back and recount the non-classic two-candidate seats on a two-party basis for statistical purposes). --Canley (talk) 02:13, 24 May 2022 (UTC)[reply]
Right! Updated and ref'd then. Cheers. — Guarapiranga☎ 03:43, 24 May 2022 (UTC)[reply]
May I point out that ALP + GRN = 44.8% = L/NP + ONP + UAP?[edit]
I thought that was interesting to note. The result of the election is pretty much obscured by how the cookie crumbles in the OTH category. — Guarapiranga☎ 10:38, 18 June 2022 (UTC)[reply]
It's an interesting point but not an equal comparison. GRN voters' preferences flow to ALP at 80+% rates (85.7% at the 2022 election, see https://results.aec.gov.au/27966/Website/HouseStateTppFlow-27966-NAT.htm) while ONP and UAP voters preference the L/NP at about a 2-to-1 rate (ONP 64.3%, UAP 61.9% at the 2022 election).
So yes the preferences of voters in the OTH category are important, but Labor is probably ahead if ALP + GRN have the same first-preference vote as L/NP + ONP + UAP at an election (unless the Coalition can win a majority of OTH voters' preferences). Due to the difference in pref flows between the parties of the left vs the parties of the right, adding up first-preference for parties on either side is unfortunately not an alternative to two-party-preferred calculations as a way to figure out who's ahead. Arachnus64 (talk) 12:13, 6 November 2022 (UTC)[reply]


 — Guarapiranga ☎ 23:00, 24 April 2022 (UTC)
 Restored — Guarapiranga ☎ 06:52, 13 May 2022 (UTC)
 — Guarapiranga ☎ 06:19, 1 June 2022 (UTC)