1936 United States presidential election in South Carolina
Appearance
| ||||||||||||||||||||||||||
| ||||||||||||||||||||||||||
 County results
Roosevelt Roosevelt—>90%
| ||||||||||||||||||||||||||
| ||||||||||||||||||||||||||
| Elections in South Carolina |
|---|
 |
The 1936 United States presidential election in South Carolina was held on November 3, 1936. The state voters chose eight electors to the Electoral College, who voted for president and vice president.
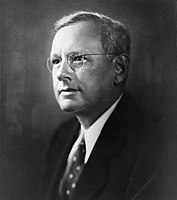
South Carolina voted for Democratic Party candidate and incumbent President Franklin D. Roosevelt, over Republican Party candidate incumbent Governor of Kansas Alf Landon. Roosevelt, who won the state by a landslide margin of 97.14 percent, carried all counties with over ninety percent of the vote, and his 98.57 percent of the popular vote is the highest for any presidential candidate in South Carolina since popular voting was first used in the 1868 election.
Results
| United States presidential election in South Carolina, 1936[1] | ||||||||
|---|---|---|---|---|---|---|---|---|
| Party | Candidate | Running mate | Popular vote | Electoral vote | ||||
| Count | % | Count | % | |||||
| Democratic | Franklin Delano Roosevelt of New York | John Nance Garner of Texas | 113,791 | 98.57% | 8 | 100.00% | ||
| Republican | Alf Landon of Kansas | Frank Knox of Illinois | 1,646[a] | 1.43% | 0 | 0.00% | ||
| Total | 115,437 | 100.00% | 8 | 100.00% | ||||
Results by county
| County | Roosevelt# | Roosevelt% | Landon# | Landon% | Total votes cast[2] |
|---|---|---|---|---|---|
| Abbeville | 1,265 | 98.21% | 23 | 1.79% | 1,288 |
| Aiken | 3,298 | 98.95% | 35 | 1.05% | 3,333 |
| Allendale | 1,236 | 99.76% | 3 | 0.24% | 1,239 |
| Anderson | 4,025 | 99.36% | 26 | 0.64% | 4,051 |
| Bamberg | 1,542 | 99.68% | 5 | 0.32% | 1,547 |
| Barnwell | 2,157 | 99.91% | 2 | 0.09% | 2,159 |
| Beaufort | 501 | 92.10% | 43 | 7.90% | 544 |
| Berkeley | 690 | 98.85% | 8 | 1.15% | 698 |
| Calhoun | 821 | 99.88% | 1 | 0.12% | 822 |
| Charleston | 8,015 | 95.05% | 417 | 4.95% | 8,432 |
| Cherokee | 2,280 | 99.00% | 23 | 1.00% | 2,303 |
| Chester | 2,155 | 99.49% | 11 | 0.51% | 2,166 |
| Chesterfield | 3,192 | 99.44% | 18 | 0.56% | 3,210 |
| Clarendon | 1,260 | 98.67% | 17 | 1.33% | 1,277 |
| Colleton | 1,463 | 99.46% | 8 | 0.54% | 1,471 |
| Darlington | 1,995 | 99.40% | 12 | 0.60% | 2,007 |
| Dillon | 1,104 | 99.55% | 5 | 0.45% | 1,109 |
| Dorchester | 889 | 96.95% | 28 | 3.05% | 917 |
| Edgefield | 1,304 | 99.92% | 1 | 0.08% | 1,305 |
| Fairfield | 1,005 | 98.72% | 13 | 1.28% | 1,018 |
| Florence | 4,194 | 99.41% | 25 | 0.59% | 4,219 |
| Georgetown | 1,273 | 95.43% | 61 | 4.57% | 1,334 |
| Greenville | 8,310 | 98.91% | 92 | 1.09% | 8,402 |
| Greenwood | 3,064 | 99.38% | 19 | 0.62% | 3,083 |
| Hampton | 1,253 | 99.37% | 8 | 0.63% | 1,261 |
| Horry | 2,927 | 100.00% | 0 | 0.00% | 2,927 |
| Jasper | 452 | 99.12% | 4 | 0.88% | 456 |
| Kershaw | 1,400 | 98.59% | 20 | 1.41% | 1,420 |
| Lancaster | 2,631 | 100.00% | 0 | 0.00% | 2,631 |
| Laurens | 3,069 | 99.58% | 13 | 0.42% | 3,082 |
| Lee | 1,045 | 99.52% | 5 | 0.48% | 1,050 |
| Lexington | 2,138 | 98.53% | 32 | 1.47% | 2,170 |
| Marion | 656 | 98.80% | 8 | 1.20% | 664 |
| Marlboro | 1,219 | 99.59% | 5 | 0.41% | 1,224 |
| McCormick | 988 | 99.30% | 7 | 0.70% | 995 |
| Newberry | 2,615 | 99.66% | 9 | 0.34% | 2,624 |
| Oconee | 2,057 | 97.49% | 53 | 2.51% | 2,110 |
| Orangeburg | 2,947 | 98.04% | 59 | 1.96% | 3,006 |
| Pickens | 2,678 | 98.17% | 50 | 1.83% | 2,728 |
| Richland | 6,728 | 97.79% | 152 | 2.21% | 6,880 |
| Saluda | 1,324 | 99.25% | 10 | 0.75% | 1,334 |
| Spartanburg | 10,739 | 98.41% | 173 | 1.59% | 10,912 |
| Sumter | 2,062 | 97.26% | 58 | 2.74% | 2,120 |
| Union | 3,458 | 99.74% | 9 | 0.26% | 3,467 |
| Williamsburg | 1,284 | 99.53% | 6 | 0.47% | 1,290 |
| York | 3,083 | 97.81% | 69 | 2.19% | 3,152 |
| Totals | 113,791 | 98.57% | 1,646 | 1.43% | 115,437 |
Notes
References
- ^ "1936 Presidential General Election Results - South Carolina". U.S. Election Atlas. Retrieved 23 December 2013.
- ^ Scammon, Richard M. (compiler); America at the Polls: A Handbook of Presidential Election Statistics 1920-1964; p. 395 ISBN 0405077114


