
Solar variation: Difference between revisions
m rv to SEWilco |
m rm dupl |
||
| Line 3: | Line 3: | ||
'''Solar variations''' are fluctuations in the amount of energy emitted by the [[Sun]]. Small variations have been measured from satellites during recent decades. Of interest to climate scientists is whether these variations have a significant effect on the temperature of the earth's atmosphere. |
'''Solar variations''' are fluctuations in the amount of energy emitted by the [[Sun]]. Small variations have been measured from satellites during recent decades. Of interest to climate scientists is whether these variations have a significant effect on the temperature of the earth's atmosphere. |
||
The amount of [[solar radiation]] received at the outer surface of Earth's atmosphere does not change much (see [[solar constant]]) from an average value of 1366 W/m².[ |
The amount of [[solar radiation]] received at the outer surface of Earth's atmosphere does not change much (see [[solar constant]]) from an average value of 1366 W/m².[http://www.pmodwrc.ch/pmod.php?topic=tsi/composite/SolarConstant] The variations in total solar output are so slight (as a percentage of total output) that they remained at or below the threshold of detectability until the satellite era, although the small fraction in ultra-violet wavelengths varies by a few percent. Total solar output is now measured to vary (over the last two 11-year sunspot cycles) by less than 0.1% {{ref|IPCCtarWG1244}}{{ref|AIPsolar}} or about 1 W/m² peak-to-trough of the 11 year sunspot cycle. There are no direct measurements of the longer-term variation and interpretations of [[proxy]] measures of variations differ. Nonetheless, some theorise that solar variation is the primary cause of [[climate change]]. |
||
[[Image:Zurich sunspot number since 1750.png|thumb|350px|[[Wolfer number|Sunspot number]] since [[1750]].]] |
[[Image:Zurich sunspot number since 1750.png|thumb|350px|[[Wolfer number|Sunspot number]] since [[1750]].]] |
||
Revision as of 14:31, 2 October 2005

Solar variations are fluctuations in the amount of energy emitted by the Sun. Small variations have been measured from satellites during recent decades. Of interest to climate scientists is whether these variations have a significant effect on the temperature of the earth's atmosphere.
The amount of solar radiation received at the outer surface of Earth's atmosphere does not change much (see solar constant) from an average value of 1366 W/m².[1] The variations in total solar output are so slight (as a percentage of total output) that they remained at or below the threshold of detectability until the satellite era, although the small fraction in ultra-violet wavelengths varies by a few percent. Total solar output is now measured to vary (over the last two 11-year sunspot cycles) by less than 0.1% [2][3] or about 1 W/m² peak-to-trough of the 11 year sunspot cycle. There are no direct measurements of the longer-term variation and interpretations of proxy measures of variations differ. Nonetheless, some theorise that solar variation is the primary cause of climate change.

History of study of solar variations
The longest recorded aspect of solar variations are changes in sunspots. Shortly after astronomers began using the telescope in 1609, sunspots and their motions were observed. Initial study was focused on their nature and behavior. Although the physical aspects of sunspots was not identified until the 1900s, observations continued. Study was hampered during the 1600s and 1700s due to the low number of sunspots during what is now recognized as an extended period of low solar activity, this event named the Maunder Minimum. By the 1800s records of their numbers began to show variations in their numbers.
Around 1900 connections between solar variations and weather on Earth began to be explored. Challenges are shown in the efforts of Charles Greeley Abbot, assigned by the Smithsonian Astrophysical Observatory (SAO) to detect changes in the radiation of the Sun. His team had to begin by inventing instruments to measure solar radiation. Later, when he was head of the SAO, it established a solar station at Calama, Chile to complement its data from Mount Wilson Observatory. He detected 27 harmonic periods within the 273-month Hale cycles, including 7, 13, and 39 month patterns. He looked for connections to weather by means such as matching opposing solar trends during a month to opposing temperature and precipitation trends in cities.
Statistical studies of solar activity with weather and climate were particularly popular until the 1980s, when publications blossomed with studies of weather fronts and global meteorological patterns. Photos from space and weather satellites emphasized the importance of clouds and weather fronts. Climate studies and weather forecasting have been enhanced by increasing use of climate models, beginning with simple computer simulations and replacing "solar constant" values with more detailed solar variation as computing power increased and understanding of weather processes improves.
Solar activity
Sunspots

Sunspots are relatively dark areas on the surface of the Sun and are thus cooler than its average surface. The number of sunspots correlates with the intensity of solar radiation. The variation is small (of the order of 1 W/m² or 0.1% of the total) and was only established once satellite measurements of solar variation became available in the 1980s. The Solar Maximum Mission detected that because the areas surrounding sunspots are brighter, the overall effect is that more sunspots means a brighter sun.
Various studies have been made using sunspot number (for which records extend over hundreds of years) as a proxy for solar output (for which good records only extend for a few decades). Also, ground instruments have been calibrated by comparison with high-altitude and orbital instruments. Researchers have combined present readings and factors to adjust historical data. Other proxy data - such as the abundance of cosmogenic isotopes - have been used to infer solar magnetic activity and thus likely brightness.
Sunspot activity has been measured using the Wolfer number for about 300 years. This index (also known as the Zürich number) uses both the number of sunspots and the number of groups to compensate for variations in measurement.

Sunspot numbers over the past 11,400 years have been reconstructed using dendrochronologically dated radiocarbon concentrations. The level of solar activity during the past 70 years is exceptional - the last period of similar magnitude occurred over 8,000 years ago. The Sun was at a similarly high level of magnetic activity for only ~10% of the past 11,400 years, and almost all of the earlier high-activity periods were shorter than the present episode.[4]
| Event | Start | End |
|---|---|---|
| Oort minimum | 1040 | 1080 |
| Medieval maximum | 1100 | 1250 |
| Wolf minimum | 1280 | 1350 |
| Spörer Minimum | 1450 | 1550 |
| Maunder Minimum | 1645 | 1715 |
| Dalton Minimum | 1790 | 1820 |
Solar cycles
Solar cycles are cyclic changes in behavior of the Sun. Many possible patterns have been noticed.
- 11 years: Most obvious is a gradual increase and decrease of the number of sunspots over a period of about 11 years, called the Schwabe cycle. The Babcock Model explains this as being due to a shedding of entangled magnetic fields. The Sun's surface is also the most active when there are more sunspots, although the luminosity does not change much due to an increase in bright spots (faculae).
- 22 years: Hale cycle. The magnetic field of the Sun reverses during each Schwabe cycle, so the magnetic poles return to the same state after two reversals.
- 88 years: Gleissberg cycle (70-100 years) is thought to be an amplitude modulation of the 11-year Schwabe Cycle (Sonnett and Finney, 1990).
- 200 years: Suess cycle.
- 2,300 years: Hallstatt cycle.
- Other patterns have been detected:
- In carbon-14: 105, 131, 232, 385, 504, 805, 2,241 years (Damon and Sonnett, 1991).
- During the Upper Permian 240 million years ago, mineral layers created in the Castile Formation show cycles of 2,500 years.
Predictions based on patterns
- A simple model based on emulating harmonics by multiplying the basic 11-year cycle by powers of 2 produced results similar to Holocene behavior. Extrapolation suggests a gradual cooling during the next few centuries with intermittent minor warmups and a return to near Little Ice Age conditions within the next 500 years. This cool period then may be followed approximately 1,500 years from now by a return to altithermal conditions similar to the previous Holocene Maximum. [5]
- There is weak evidence for a quasi-periodic variation in the sunspot cycle amplitudes with a period of about 90 years. These characteristics indicate that the next solar cycle should have a maximum smoothed sunspot number of about 145±30 in 2010 while the following cycle should have a maximum of about 70±30 in 2023. [6]
- Because carbon-14 cycles are quasi periodic, Damon and Sonett (1989) predict future climate: [7]
| Cycle length | Cycle name | Last positive carbon-14 anomaly |
Next "warming" |
|---|---|---|---|
| 2241 | Landscheidt | AD 1400 (cool) | AD 2520 |
| 232 | --?-- | AD 1922 (cool) | AD 2038 |
| 208 | Suess | AD 1898 (cool) | AD 2002 |
| 88 | Gleisberg | AD 1986 (cool) | AD 2030 |
Solar irradiance of Earth and its surface
Solar irradiance, or insolation, is the amount of sunlight which reaches the Earth. The equipment used might measure optical brightness, total radiation, or radiation in various frequencies. Historical estimates use various measurements and proxies.

There are two common meanings:
- the radiation reaching the upper atmosphere
- the radiation reaching some point within the atmosphere, including the surface.
Various gases within the atmosphere absorb some solar radiation at different wavelengths, and clouds and dust also affect it. Hence measurements above the atmosphere are needed to observe variations in solar output, within the confounding effects of changes to the atmosphere. Indeed, there is some evidence that sunshine at the Earth's surface has been decreasing in the last 50 years (see global dimming) possibly caused by increased atmospheric pollution, whilst over roughly the same timespan solar output has been nearly constant.
Milankovitch cycle variations

Some variations in insolation are not due to solar changes but rather due to the Earth moving closer or further from the Sun, or changes in the relative amount of radiation reaching regions of the Earth. These have caused variations of as much as 25% (locally; global average changes are much smaller) in solar insolation over long periods. The most recent significant event was an axial tilt of 24° during boreal summer at near the time of the Holocene climatic optimum.
For details see the main article: Milankovitch cycles
Solar interactions with Earth
There are several ways that solar variations may affect Earth. Some variations, such as changes in the size of the Sun, are presently only of interest in the field of astronomy.
Changes in total irradiance
- Overall brightness may change.
- The variation during recent cycles has been about 0.1%.
- Changes corresponding to solar changes with periods of 9-13, 18-25, and >100 years been measured in sea-surface temperatures.
- Since the Maunder Minimum, over the past 300 years there probably has been an increase of 0.1 to 0.6%, with climate models often using a 0.25% increase.
Changes in ultraviolet irradiance
- Ultraviolet irradiance (EUV) ranges widely through factors of 2 to 10 during a solar cycle.
- Energy changes in the UV wavelengths involved in production and loss of ozone have atmospheric effects.
- The 30 hPa pressure level has changed height in phase with solar activity during the last 4 solar cycles.
- UV irradiance increase causes higher ozone production, leading to stratospheric heating and to poleward displacements in the stratospheric and tropospheric wind systems.
- A proxy study estimates that UV increased by 3% since the Maunder Minimum.
Changes in the solar wind and the Sun's magnetic flux
- A more active solar wind and stronger magnetic field reduces the cosmic rays striking the Earth's atmosphere.
- Variations in the solar wind affect the size and intensity of the heliosphere, the volume larger than the Solar System filled with solar wind particles.
- Levels of 14C and 10Be show changes tied to solar activity.
- Cosmic ray ionization in the upper atmosphere does change, but significant effects are not obvious.
- As the solar coronal-source magnetic flux doubled during the past century, the cosmic-ray flux has decreased by about 15%.
- The Sun's total magnetic flux rose by a factor of 1.41 from 1964-1996 and by a factor of 2.3 since 1901.
Effects on clouds
- Cosmic rays may affect formation of clouds.
- 1983-1994 data from the International Cloud Climate Project (ISCCP) showed that global low cloud formation was highly correlated with cosmic ray flux.
- The Earth's albedo decreased by about 2.5% over 5 years during the recent solar cycle, as measured by lunar "Earthshine". Similar reduction was measured by satellites during the previous cycle.
- Mediterranean core study of plankton detected a solar-related 11 year cycle, and an increase 3.7 times larger between 1760 and 1950. A considerable reduction in cloud cover is proposed.
Other effects due to solar variation
Interaction of solar particles, the solar magnetic field, and the Earth's magnetic field, cause variations in the particle and electromagnetic fields at the surface of the planet. Extreme solar events can affect electrical devices. Weakening of the Sun's magnetic field is believed to increase the number of interstellar cosmic rays which reach Earth's atmosphere, altering the types of particles reaching the surface. It has been speculated that a change in cosmic rays could cause an increase in certain types of clouds, affecting Earth's albedo.
Geomagnetic effects

The Earth's polar aurora are visual displays created by interactions between the solar wind, the solar magnetosphere, the Earth's magnetic field, and the Earth's atmosphere. Variations in any of these affect aurora displays.
Sudden changes can cause the intense disturbances in the Earth's magnetic fields which are called geomagnetic storms.
Solar proton events
Energetic protons can reach Earth within 30 minutes of a major flare's peak. During such a solar proton event, Earth is showered in energetic solar particles (primarily protons) released from the flare site. Some of these particles spiral down Earth's magnetic field lines, penetrating the upper layers of our atmosphere where they produce additional ionization and may produce a significant increase in the radiation environment.
Galactic cosmic rays

An increase in solar activity (more sunspots) is accompanied by an increase in the "solar wind," which is an outflow of ionized particles, mostly protons and electrons, from the sun. The Earth's geomagnetic field, the solar wind, and solar magnetic field deflects galactic cosmic rays (GCR). A decrease in solar activity increases the GCR penetration of the troposphere and stratosphere. GCR particles are the primary source of ionization in the troposphere above 1 km (below 1 km, radon is a dominant source of ionization in many areas).
Levels of GCRs have been indirectly recorded by their influence on the production of carbon-14 and beryllium-10. The Hallstatt solar cycle length of approximately 2300 years is reflected by climatic Dansgaard-Oeschger events. The 80-90 year solar Gleissberg cycles appear to vary in length depending upon the lengths of the concurrent 11 year solar cycles, and there also appear to be similar climate patterns occurring on this time scale.
Cloud effects
Changes in ionization affect the abundance of aerosols that serve as the nuclei of condensation for cloud formation. As a result, ionization levels potentially affect levels of condensation, low clouds, relative humidity, and albedo due to clouds. Clouds formed from greater amounts of condensation nuclei are brighter, longer lived, and likely to produce less precipitation. Changes of 3-4% in cloudiness and concurrent changes in cloud top temperatures have been correlated to the 11 and 22 year solar (sunspot) cycles, with increased GCR levels during "antiparallel" cycles.[8] Global average cloud cover change has been found to be 1.5-2%. Several studies of GCR and cloud cover variations have found positive correlation at latitudes greater than 50° and negative correlation at lower latitudes.[9] However, not all scientists accept this correlation as statistically significant, and some that do attribute it to other solar variability (e.g. UV or total irradiance variations) rather than directly to GCR changes.[10][11] Difficulties in such correlations include that many aspects of solar variability change at similar times, and some climate systems have delayed responses.
Carbon-14 production


The production of radiocarbon (Carbon-14: 14C) also is related to solar activity. Radiocarbon is produced in the upper atmosphere by bombardment of atmospheric nitrogen (14N) with neutrons from outer space (cosmic rays). Increased solar activity reduces cosmic rays and reduces 14C production. Therefore, the 14C concentration of the atmosphere is lower during sunspot maxima and higher during sunspot minima. By measuring the captured 14C in wood and counting tree rings, production of radiocarbon relative to recent wood can be measured and dated. A reconstruction of the past 10,000 years shows that the 14C production was much higher during the mid-Holocene 7,000 years ago and decreased until 1,000 years ago. In addition to variations in solar activity, the long term trends in Carbon-14 production are influenced by changes in the Earth's geomagnetic field and by changes in carbon cycling within the biosphere (particularly those associated with changes in the extent of vegetation since the last ice age)[12].
Global warming
Some researchers have correlated solar variation with changes in the Earth's average temperature and climate - sometimes finding an effect, and sometimes not. When effects are found they have tended to be greater than can be explained by direct response to the change in radiative forcing from solar change, so feedback or amplification mechanisms are required.[13] For a discussion of attribution of causes of current global warming see: Attribution of recent climate change
Research by Willie Soon and Sallie Baliunas presents evidence that variations in solar radiation produced the warming that "put the green in Greenland" and led to a "Little Ice Age". The IPCC's estimate of solar forcing since 1750 is available [14]. More recently Lean et al 2002 say that total solar irradiance may also lack significant secular trends.
Douglass and Clader, Geophysical Research Letters, 2002 indicate that the climate response to forcings due to solar variations has been about twice that of simple radiation balancing, in agreement with the standard idea that some feedback mechanism is required to explain the influence of solar forcing found in ocean measurements and paleo data.
In 2003, Shaviv and Veizer compared a temperature reconstruction of the last 500 million years to expected changes in cosmic ray flux as the solar system moves around the galaxy. They concluded that, at least over very long time scales, cosmic ray variations had a much larger impact on climate than other processes (such as greenhouse gas changes) [15]. Since, as described above, cosmic rays are also affected solar variations, their work may imply a larger role for solar variability in recent climate change than has previously been appreciated. Also, by looking at the temperature changes not ascribed to cosmic rays, they estimated that the climate response to doubling CO2 is only about 0.75 °C as compared to the 1.5-4.5 °C reported by the IPCC [16]. However, long-term processes occurring over millions of years may make it impossible to interpret of Shaviv & Veizer's results over the short time scales relevant to recent warming. [17].
Solar variation in climate models

Climate models are computer simulations which are used to examine understanding of climate behavior. Some models use constant values for solar irradiance, while some include the heating effects of a variable Sun. A good simulation by GCMs of global mean temperature over the last 100 years requires both natural (solar; volcanic) and human (greenhouse gas) factors.
There is currently no clear agreement as to the likely magnitude of long-term (last hundred or more years) solar variation. The IPCC discuss this in section 6.11 of the TAR [18] and show various results including Lean et al. (1995) [19]. However the Lean 1995 value may well be too high: more recently Lean et al (GRL 2002, [20]) say:
- Our simulation suggests that secular changes in terrestrial proxies of solar activity (such as the 14C and 10Be cosmogenic isotopes and the aa geomagnetic index) can occur in the absence of long-term (i.e., secular) solar irradiance changes. ...this suggests that total solar irradiance may also lack significant secular trends. ...Solar radiative forcing of climate is reduced by a factor of 5 when the background component is omitted from historical reconstructions of total solar irradiance ...This suggest that general circulation model (GCM) simulations of twentieth century warming may overestimate the role of solar irradiance variability. ...There is, however, growing empirical evidence for the Sun's role in climate change on multiple time scales including the 11-year cycle ...Climate response to solar variability may involve amplification of climate modes which the GCMs do not typically include. ...In this way, long-term climate change may appear to track the amplitude of the solar activity cycles because the stochastic response increases with the cycle amplitude, not because there is an actual secular irradiance change.
In 2003, Stott et al found that "current climate models underestimate the observed climate response to solar forcing over the twentieth century as a whole, indicating that the climate system has a greater sensitivity to solar forcing than do models." His work has revised the IPCC TAR assessment of the solar contribution to the post 1950 warming. "The best estimate of the warming from solar forcing is estimated to be 16% or 36% of greenhouse warming depending on the solar reconstruction."."Do Models Underestimate the Solar Contribution to Recent Climate Change" Peter A. Stott, et al, Journal of Climate, 15 DECEMBER 2003
Solar variation theory
Solar variation theory is one attempt to account for global warming. Various hypotheses have been proposed to link terrestrial temperature variations to solar variations. The meteorological community has responded with skepticism, in part because theories of this nature have come and gone over the course of the 20th century [21]. The solar variations theory also has counter evidence in the form of measured global dimming which shows that the intensity of sunlight at the Earth's surface actually fell from the 1950s–1990s. To reconcile theories of an increase in solar radiation with the measurements would require other changes either in the spectrum of the sun (which has not been observed) or in the absorption profile of the atmosphere, which would probably imply some kind of climate change.
Sami Solanki, the director of the Max Planck Institute for Solar System Research in Göttingen, Germany said:
- The sun has been at its strongest over the past 60 years and may now be affecting global temperatures... the brighter sun and higher levels of so-called "greenhouse gases" both contributed to the change in the Earth's temperature, but it was impossible to say which had the greater impact. [22]
Willie Soon and Sallie Baliunas of the Harvard Observatory correlated historical sunspot counts with temperature proxies. They report that when there are fewer sunspots, the earth cooled (see Maunder Minimum, Little Ice Age) — and that when there are more sunspots the earth warmed (see Medieval Warm Period, though since sunspot numbers were only counted from 1700 the link to the MWP warmth is speculative).
The theories have usually represented one of three types:
- Solar irradiance changes directly affecting the climate. This is generally considered unlikely, as the variations seem to be too small.
- Variations in the ultraviolet component having an effect. The UV component varies by more than the total.
- Effects mediated by changes in cosmic rays (which are affected by the solar wind, which is affected by the solar output) such as changes in cloud cover.
Although correlations often can be found, the mechanism behind these correlations is a matter of speculation. Many of these speculative accounts have fared badly over time, and in a paper "Solar activity and terrestrial climate: an analysis of some purported correlations" (J. Atmos. and Solar-Terr. Phy., 2003 p801–812) Peter Laut demonstrates problems with some of the most popular, notably those by Svensmark and by Lassen (below). Damon and Laut report in Eos [23] that the apparent strong correlations displayed on these graphs have been obtained by incorrect handling of the physical data. The graphs are still widely referred to in the literature,and their misleading character has not yet been generally recognized.
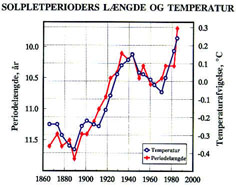
In 1991, Knud Lassen of the Danish Meteorological Institute in Copenhagen and his colleague Eigil Friis-Christensen found a strong correlation between the length of the solar cycle and temperature changes throughout the northern hemisphere. Initially, they used sunspot and temperature measurements from 1861 to 1989, but later found that climate records dating back four centuries supported their findings. This relationship appeared to account for nearly 80 per cent of the measured temperature changes over this period (see graph). Damon and Laut, however, show that when the graphs are corrected for filtering errors, the sensational agreement with the recent global warming, which drew worldwide attention, has totally disappeared. Nevertheless,the authors and other researchers keep presenting the old misleading graph [24]. Note that the prior link to "graph" is one such example of this.
Sallie Baliunas, an astronomer at the Harvard-Smithsonian Center for Astrophysics, has been among the supporters of the theory that changes in the sun "can account for major climate changes on Earth for the past 300 years, including part of the recent surge of global warming." [25]
On May 6, 2000, however, New Scientist magazine reported that Lassen and astrophysicist Peter Thejll had updated Lassen's 1991 research and found that while the solar cycle still accounts for about half the temperature rise since 1900, it fails to explain a rise of 0.4 °C since 1980. "The curves diverge after 1980," Thejll said, "and it's a startlingly large deviation. Something else is acting on the climate.... It has the fingerprints of the greenhouse effect."[26]
Later that same year, Peter Stott and other researchers at the Hadley Centre in the United Kingdom published a paper in which they reported on the most comprehensive model simulations to date of the climate of the 20th century. Their study looked at both "natural forcing agents" (solar variations and volcanic emissions) as well as "anthropogenic forcing" (greenhouse gases and sulphate aerosols). They found that "solar effects may have contributed significantly to the warming in the first half of the century although this result is dependent on the reconstruction of total solar irradiance that is used. In the latter half of the century, we find that anthropogenic increases in greenhouses gases are largely responsible for the observed warming, balanced by some cooling due to anthropogenic sulphate aerosols, with no evidence for significant solar effects." Stott's team found that combining all of these factors enabled them to closely simulate global temperature changes throughout the 20th century. They predicted that continued greenhouse gas emissions would cause additional future temperature increases "at a rate similar to that observed in recent decades". It should be noted that their solar forcing included "spectrally-resolved changes in solar irradiance" and not the indirect effects mediated through cosmic rays for which there is still no accepted mechanism — these ideas are still being fleshed out.Cosmic Rays, Clouds, and Climate, K. S. Carslaw, R. G. Harrison, and J. Kirkby Science Nov 29 2002: 1732-1737 and those articles citing it In addition, the study notes "uncertainties in historical forcing" — in other words, past natural forcing may still be having a delayed warming effect, most likely due to the oceans.[27] A graphical representation of the relationship between natural and anthropogenic factors contributing to climate change appears in "Climate Change 2001: The Scientific Basis", a report by the Intergovernmental Panel on Climate Change (IPCC). [28]
It should be noted that Stott's 2003 work mentioned in the model section above largely revised his assessment, and found a significant solar contribution to recent warming, although still smaller than that of the green house gases.[29]
See also
References
- ^ "Solar Forcing of Climate". Climate Change 2001: Working Group I: The Scientific Basis. March 10.
{{cite web}}: Check date values in:|date=and|year=/|date=mismatch (help) - ^ "Changing Sun, Changing Climate?". The Discovery of Global Warming. February 21.
{{cite web}}: Check date values in:|date=and|year=/|date=mismatch (help) - ^ Template:Journal reference issue doi:10.1038/nature02995 "11,000 Year Sunspot Number Reconstruction". Global Change Master Directory. March 11.
{{cite web}}: Check date values in:|date=and|year=/|date=mismatch (help) - ^ Template:Journal reference issue doi:10.1073/pnas.230423297
- ^ "What the Sunspot Record Tells Us about Space Climate" (PDF). Submitted to Solar Physics 2004/08/31. March 11.
{{cite web}}: Check date values in:|date=and|year=/|date=mismatch (help) - ^ "SOLAR VARIABILITY: climatic change resulting from changes in the amount of solar energy reaching the upper atmosphere". INTRODUCTION TO QUATERNARY ECOLOGY. March 11.
{{cite web}}: Check date values in:|date=and|year=/|date=mismatch (help) - ^ Template:Journal reference issue
- ^ "Atmospheric Ionization and Clouds as Links Between Solar Activity and Climate". Tinsley, Brian A. and Fangqun Yu, in: Solar Variability and Its Effects on the Earth's Atmospheric and Climate System. March 10.
{{cite web}}: Check date values in:|date=and|year=/|date=mismatch (help) . ISBN 0-87590-406-8.{{cite book}}: Missing or empty|title=(help); Unknown parameter|Author=ignored (|author=suggested) (help); Unknown parameter|Publisher=ignored (|publisher=suggested) (help); Unknown parameter|Title=ignored (|title=suggested) (help); Unknown parameter|Year=ignored (|year=suggested) (help) - ^ Template:Journal reference issue doi:10.1016/j.jastp.2004.07.041
- ^ Template:Journal reference issue doi:10.1029/2004GL021167
- ^ "Variations in CO2 Growth Rate Associated with Solar Activity". Still Waiting for Greenhouse. March 10.
{{cite web}}: Check date values in:|date=and|year=/|date=mismatch (help)
- Template:Journal reference issue
- "The Sun and Climate". U.S. Geological Survey Fact Sheet 0095-00. February 21.
{{cite web}}: Check date values in:|date=and|year=/|date=mismatch (help) - "The Sun's role in Climate Changes" (PDF). Proc. of The International Conference on Global Warming and The Next Ice Age, 19-24 August, 2001, Halifax, Nova Scotia. February 21.
{{cite web}}: Check date values in:|date=and|year=/|date=mismatch (help) - Template:Journal reference issue
External links
- Gerrit Lohmann, Norel Rimbu, Mihai Dima (2004). Climate signature of solar irradiance variations: analysis of long-term instrumental, historical, and proxy data. International Journal of Climatology 24(8), 1045-1056 - Abstract: http://www.palmod.uni-bremen.de/~gerrit/abstractSolar.html
- Solar Climatic Effects (Recent Influence) — Summary. Center for the Study of Carbon Dioxide and Global Change. 19 March 2003. http://www.co2science.org/subject/s/summaries/solarrecin.htm
- NOAA / NESDIS / NGDC (2002) Solar Variability Affecting Earth NOAA CD-ROM NGDC-05/01. This CD-ROM contains over 100 solar-terrestrial and related global data bases covering the period through April 1990. http://www.ngdc.noaa.gov/stp/CDROM/solar_variability.html
- S.K Solanski, M. Fligge (2001) Long-term changes in solar irradiance ESA SP-463, ESA Publications Division. http://www.astro.phys.ethz.ch/papers/fligge/solspa_2.pdf
- S.K. Solanki, M. Fligge (2000) Reconstruction of past solar irradiance Space Science Review 94, 127-138 http://www.astro.phys.ethz.ch/papers/fligge/solfli_rev.pdf
- George C. Reid (1995) The sun-climate question: Is there a real connection? Aeronomy Laboratory, NOAA/ERL, Boulder, Colorado. U.S. National Report to IUGG, 1991-1994 Rev. Geophys. Vol. 33 Suppl. http://www.agu.org/revgeophys/reid00/reid00.html
In a barotropic atmosphere the geostrophic wind is independent of height.